

“While we are not public health experts or medical doctors, our profession does require us to price financial assets and evaluate their risks. This means understanding and pricing the effects of COVID on companies and their cash flows”
Read on in this Edition of the Canso Market Observer:
- Governments Did The Right Thing
- The Polls Favour Biden
- The 2021 COVID News Should Be Better
- Canada Does Better on Employment
- Massive Government Support Avoided Disaster
- Helicopter “Trump Bucks”
- Time is Running Out on Further Stimulus Funding
- The Negatives of Negative Yields
- A Spoonful of Inflation Medicine
- Compounding Debt Problems
- The Ghost of Markets Past
- Turbulence Ahead
- Summary
We write this newsletter with President Trump of the United States back in the White House after being hospitalized for COVID-19. He was reportedly transported by helicopter “while he could still walk” to avoid the negative optics of him being rolled into an ambulance on a stretcher. The White House doctor now says the President is doing well, but Mr. Trump was sent back to the White House while still infected. The treatments he has received suggest the President had a severe case, but his doctor says Mr. Trump is cleared to campaign in person this coming week.
Mr. Trump seems to have been “patient zero” in an outbreak that has infected a reported 35 people who came into contact with him, making the White House a COVID “red zone” by his own CDC’s definitions. The infected include the First Lady and many members of his personal White House staff and advisers. After downplaying the COVID pandemic during the election campaign, this was not something helpful to Mr. Trump’s re-election prospects.
As Mr. Trump, his Campaign staff and family as well as many other Republicans recently infected can now attest to from their personal experience, COVID is very obviously a highly contagious and dangerous virus. Those who dispute the medical and scientific advice about COVID do so at their own peril. If this virus can penetrate the heavy testing regime and physical security of the White House, it is an important caution to the rest of us.
Public Health Measures Work
A serious effort to control the COVID pandemic is not optics and spin. Vaccines and miracle cures might very well just be around the corner, but the countries that have succeeded in lessening the worst of the COVID pandemic have applied very obvious and time tested strict public health measures to control it. They certainly weren’t spending their time debating the medical efficacy of masks and social distancing or making mask wearing a pledge of allegiance to a particular political party.
Many of the successful countries have had to re-impose stricter controls as COVID spread when their measures were eased. The U.S. states that went “all in” with the economic reopening are seeing surges in cases and deaths. In Canada, our home province of Ontario and other provinces are also experiencing an increase in COVID cases as colder fall weather keeps people indoors and schools re-open.
Herd Immunity Was Not Practical
We are not public health experts or medical doctors, but our profession does require us to price financial assets and evaluate their risks. This means understanding and pricing the effects of COVID on companies and their cash flows. Governments around the world saw what happened in China, Italy and Spain in February and March with uncontrolled spread and raced to “flatten the curve” from straight up exponential growth to something medically manageable. They accomplished this in March and April with an accompanying collapse of economic activity.
They had no choice but to act with these severe public health measures. Letting COVID run its course until “herd immunity” was achieved was simply not practical. It would have been horribly expensive both socially and financially. The initial 1% death rate and 10% hospitalization rate with a U.S. population of 331 million would have meant 3.3 million dead and 33 million in hospital. Canada, with its population of 37 million, would have had 370,000 deaths and 3.7 million hospitalized. The medical systems would have been overwhelmed and the economy would have been shut down by panic through consumer behaviour anyways.
Governments Did the Right Thing
As our clients know from our Canso Client Letters in March and our April Market Observer, we believed that central banks and governments globally would have to react to the dire economic and financial effects of the pandemic, which they have.
The good news is that we went into the market sell-off in March with very conservative positioning in our major credit portfolios. This allowed us to take advantage of the very low prices in March and April with the panic selling of the securities of companies with businesses inordinately affected by the pandemic lock-down and social distancing.
Monetary policy was loosened, interest rates plummeted, and Credit Crisis liquidity programs were put back into action to ensure proper functioning of the financial markets. These worked very well. All the cash flowing into the financial markets stopped the downdraft of March and the liquidity of cash they created unleashed a huge updraft in the financial markets that started in late March and continues currently. This was a good thing because a financial market crisis during an unprecedented global pandemic and economic shut down would have ended very, very badly.
“The Emperor Has No Clothes!”
The medical and macroeconomic backdrop and response has been confused by politics. Now things have really changed for the United States with its pandemic approach and especially for the 2020 election, which is less than a month away. We are reminded of the children’s Fairy Tale by Hans Christian Andersen, “The Emperor Has No Clothes”. Everyone ignores the obvious when the Emperor parades naked down the street except for child who blurts out “The Emperor Has No Clothes”. It was obvious but nobody wanted to say anything.
To us, this seems to be a similar situation. Trump’s diagnosis with a seemingly severe case of COVID puts the focus of the remainder of the 2020 election campaign on his response to the COVID pandemic, clearly not his strong point based on voter opinion polls. Trump and his administration have downplayed and claimed victory over COVID-19 many times, despite the obvious evidence to the contrary for all to see. Watching Fox and Friends, said to be Mr. Trump’s favourite TV show, on the day of Trump’s COVID diagnosis, we were thunderstruck to hear one of the pro-Trump hosts, Ainsley Earhardt, blurt out something along the lines of “This is such a dangerous virus… think of all the people who have died” while the other hosts sat uncomfortably at her stating of the obvious.
The Polls Favour Biden
Trump is now touting his “miracle recovery” from COVID as an election strategy. It is not likely that Trump’s bout with COVID will help him in the election if the latest polls are correct. An IPSOS/ABC News poll said 7 out of 10 Americans believe that Trump did not take the COVID threat to his personal health seriously enough and hadn’t taken the appropriate personal protections to avoid being infected. That includes the Senate Republican Leader Mitch McConnell who recently said that he hadn’t gone to the White House in a month because of their lax COVID protocols.
Overall, we don’t really think that this will change things for the election very much because there are so few undecided voters. If the polls are right, they show Biden beating Trump. On the other hand, nobody wants to write Trump off since he seemingly came out of nowhere to beat Hillary Clinton. The difference this time around has shown Trump unable to grow his base beyond his devoted supporters and polls show that Biden at over 50%, is ahead by more than 10% compared to Trump’s 40%. At this point in the 2016 election, Clinton led by much less in the polls.
The polls also showed that most voters thought Biden won the Presidential Debate, and some polls now show him creeping up to a 14% advantage. Trump could still win, but he has a lot of ground to make up. The statistics show that many U.S. states, especially those with Trump-centric governors, are showing large increases in COVID infections and deaths. The COVID news is not getting better as the election approaches and advanced voting is well underway.
The 2021 COVID News Should Be Better
The good news is that, in our view, no matter who wins the election, the COVID situation in the U.S. will improve early in 2021 because of better public health implementation and possible vaccines. Clearly COVID is not “going away” and whoever wins the election is likely to understand the seriousness of the medical situation. If Biden wins, it will be sensible policy and implementation of proper public health measures nationally.
If Mr. Trump wins re-election, he should hopefully now understand the virulent nature and threat of COVID. Trump has admitted that he was “very sick” with his COVID infection. As he further improves and gets back to campaigning and governing, his brush with a serious COVID infection might translate into better public health policy from the Trump Administration and Republican governors supporting him.
We are not that optimistic that Mr. Trump really understands the need for his leadership on the subject, as was the case with UK Prime Minister Boris Johnson. One of Trump’s latest tweets seems to encourage Americans to go out and get infected because they will beat it like he has. Mr. Trump is not “out of the woods” by his own Doctor’s admission, so his declaration of victory might be premature. It is obvious what Mr. Trump is trying to do. Desperate to turn around his failing election campaign, Mr. Trump wants to triumph over COVID to win back voters. We will have to see if the virus and voters cooperate.
Not World Beating
The reality is, despite President Trump’s boasts that the U.S. COVID response has been world beating, the experience in many countries has been much better. As Kamala Harris said in the recent Vice-Presidential debate, the COVID death rate per capita in Canada is one third that of the United States. This is not happenstance. The Canadian Federal and Provincial governments have taken the serious public health measures necessary, no matter what their ideological bent. Wearing masks and social distancing are public health measures and are not debated as a form of political posturing. Ideology and party loyalty is one thing, but the numbers don’t lie. A look north to Canada is instructive. Canada and the United States are close allies and their economies are inextricably linked through economic geography and trade. Both countries were hit with COVID at the same time, have advanced health systems and experienced the first wave outbreak at the same time.
Canada Does Better on Employment
Did Trump and Republican State Governor’s push to “Reopen the Economy” really work? The chart below, which we first saw in a BAML Economics publication, indexes both Canadian and US employment to 100. It shows clearly that Canadian employment is recovering faster than in the United States. The difference seems to be the Canadian consensus, despite political differences, that public health policy should be left to the professionals and not politicians.
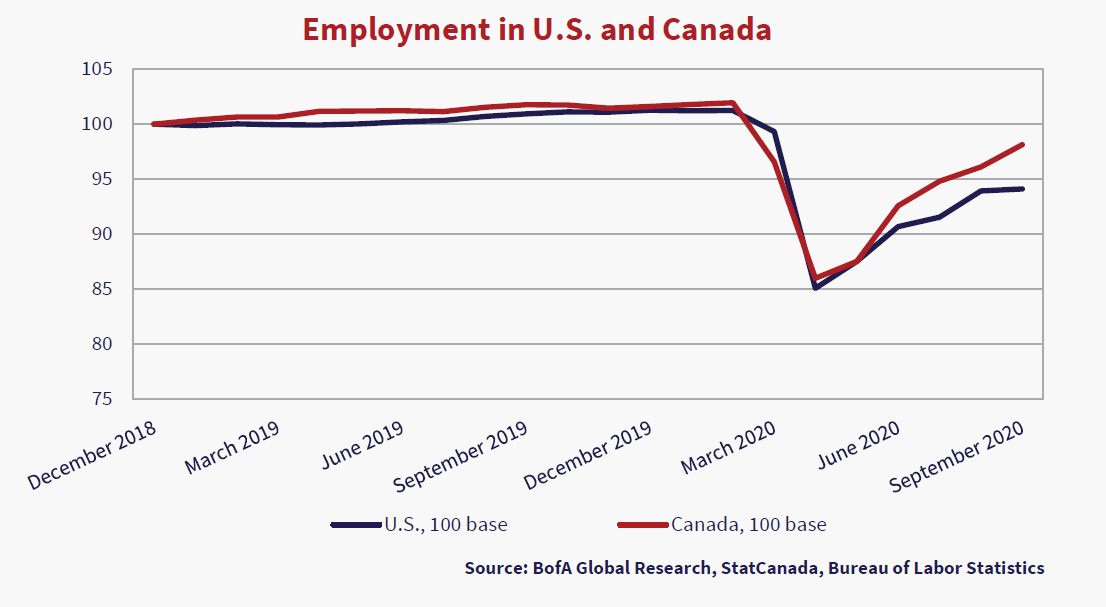
What worries us about this chart is the recent shallowing slope of the U.S. employment recovery. No matter what the politics and medical situation, the U.S. economy is still the world’s largest and most important. If the U.S. is forced into another COVID lockdown, then the rest of the world will suffer economically.
Massive Government Support Avoided Disaster
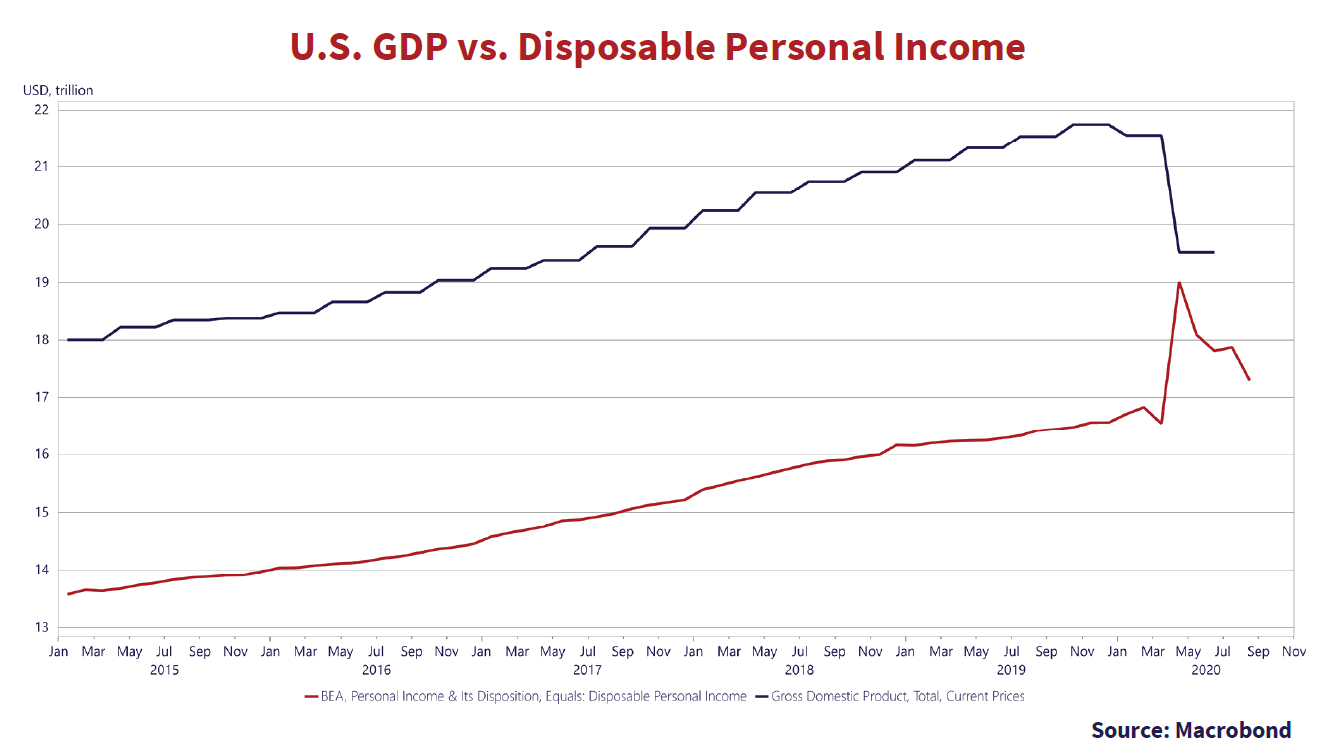
On the economic front, it was only the massive monetary and fiscal stimulation by world governments that avoided the Depression that should have accompanied an economic shut down of this scale, with its financial and social repercussions. We have created a graph below of U.S. Gross Domestic Product (GDP) and Personal Disposable Income that shows that government support has been key to lessening the impact of the COVID shutdown.
We predicted in our Canso Client Letters in March and our April Market Observer, the vast COVID shut down would deprive large swaths of the U.S. economy of revenues. Our “back of envelope” calculation was for at least a 30% drop in revenues for 30% of businesses that would be 9% of GDP. We were actually pretty close. The graph shows a $2 trillion drop in annualized GDP, down 9.7%. This is a huge and unprecedented change in economic activity in a very short period of time. This is almost 3 times larger than the 3.3% drop during the Great Recession following the Credit Crisis in 2008.
Incomes Are Actually Up!
The chart also shows that Disposable Personal Income (red line) has actually increased by $2.4 trillion. This is fascinating to us. Incomes to individuals have actually risen from direct government transfers despite the precipitous drop in economic activity as business revenues dropped with the COVID lock-down. This is because of direct income support from the U.S. Federal government funded by government borrowing.
These pandemic support programs were pushed through Congress and the Senate at record speed, in contrast to the Republican push back to both the Bush and Obama spending proposals following the Credit Crisis. Trump’s complete domination of the Republican Party was a good thing in this case. It allowed a quick response and certainly avoided a much more severe outcome, given the depth of the drop in economic activity.
Helicopter “Trump Bucks”
Trump and the Republican senators have probably never read the works of economist John Maynard Keynes. If any of them have, they probably viscerally object to his recommendations on government policy and interference in the free markets. The irony is that Keynes would be quite pleased with this raw and powerful “Keynesian” fiscal policy stimulation. Former Fed Chair Ben Bernanke spoke publicly about “dropping money from helicopters” if lowering interest rates proved impotent. He was mocked by conservative commentators and Republican politicians and received the moniker “Helicopter Ben” for his musings.
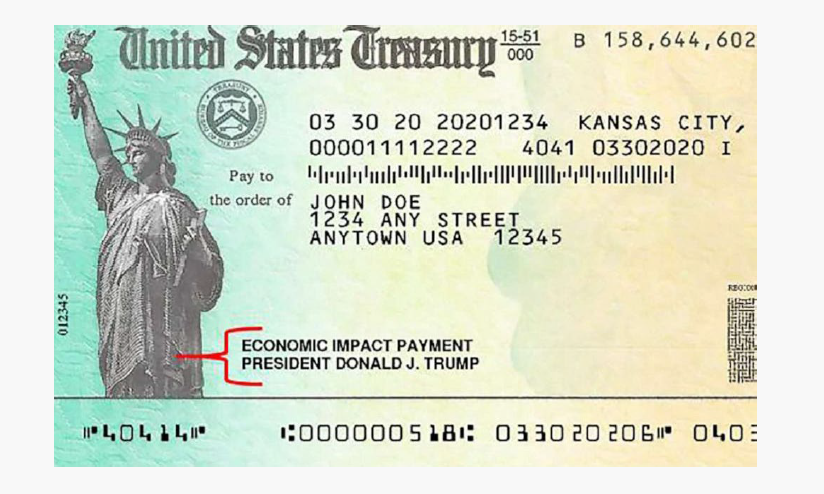
Well, President Donald J. Trump went one better. He sent $1,200 Economic Impact Payment cheques to all Americans. Although it was illegal for him to sign the cheques, he held things up to make sure his name was on the cheques, with a “President Donald J. Trump” right below the “Economic Impact Payment” and beside the Statue of Liberty.
Trump Bucks: An Economic Impact Payment Cheque
Fast and Direct Relief
This was a lot of spending power. We quote from the U.S. Treasury Department website:
The CARES Act Provides Assistance to Workers and their Families
“Through Economic Impact Payments and other means, the Treasury Department is ensuring that Americans receive fast and direct relief in the wake of the coronavirus pandemic… The CARES Act provides for Economic Impact Payments to American households of up to $1,200 per adult for individuals whose income was less than $99,000 (or $198,000 for joint filers) and $500 per child under 17 years old – or up to $3,400 for a family of four.”
“Fast and direct relief” sounds a bit like a heartburn remedy, but it was a pandemic payment of $1,200 per person and $3,400 per family. This went to people reporting incomes up to $99,000 per individual and $198,000 for couples. Maybe taxpayer Donald J. Trump, with his reported $750 income tax paid for 2016 and 2017, got one too! This is Bernanke’s “helicopter money”, except you got your cheque by mail. You didn’t have to work. It didn’t matter if you filed an IRS tax return, cheques were sent to anyone who was receiving Social Security payments as well.
Not a Recession in Recreational Goods
It cost the U.S. government $250 billion to send out the 150 million payments to eligible people. This direct support and other fiscal stimulus have benefitted the “income insecure” at the lower end of the wage scale and increased incomes for those still working. The aggressive monetary policy by the Federal Reserve has also lowered interest rates and the cost of credit for those still able to work, making credit easily available. This explains the rather strange consumer behaviour during this “COVID Recession”. This is not a normal recession where consumers curb their discretionary spending. We have seen a pick-up in the residential real estate market and used car prices have soared. There has been a huge increase in demand for consumer recreational items like hot tubs, swimming pools, wake surfing boats and ATVs.
Time is Running Out on Further Stimulus Funding
The chart also shows that this income support is bleeding off in the U.S. now that the initial $3 trillion in Federal government funding is running out. This means that COVID support programs are running out of funding for important industries like commercial aviation and airlines. For example, the original round of CARES Act payroll support to the airline industry ran out on October 1st.
Since the promised post-COVID economic reopening did not come as quickly as expected, American Airlines proceeded with 19,000 employee layoffs and United Airlines furloughed 13,000 in September as funding was delayed for new programs. This was because the support for the airline industry was part of the legislation being negotiated. The Democratic majority in Congress has been arguing with the Republican majority in the Senate and the Trump Administration about further support. The Pelosi Democrats wanted an over $3.3 trillion package and the McConnell Republicans wanted a $1.3 trillion package.
Big or Small, Trump Cratered It All
The politicians still haven’t been able to agree. The latest negotiations centred around a $2.3 trillion package but unfortunately, President Trump cratered the negotiations soon after his exit from the hospital. To the consternation of his Republican colleagues, Trump ordered a suspension of negotiations until “after the election” in a tweet. This quickly sent the stock market down as fears grew that vital income support programs would not be continued. Trump soon reversed course, demanding various programs be authorized in a tweet storm that was prodigious, even for Trump.
He then went on Rush Limbaugh’s radio show to say “I would like to see a bigger stimulus package, frankly, than either the Democrats or the Republicans are offering” admitting this was the “exact opposite” to his previous position. Then the White House added even more confusion by saying they wanted a deal “below $2 trillion”, which is lower than the $2.3 trillion the Democrats were talking about! Both Republicans and Democrats rejected Trump’s entreaties so it looks like the stimulus will have to wait until after the election in November.
HUGE Numbers
No matter who wins this budget tussle or whether a deal waits until after the election, these are, as Trump might say, HUGE numbers and have to be funded by selling a lot of U.S. Treasury bonds. As we have pointed out in prior editions, the Trump Administration was already running the highest peacetime deficits in history even before the COVID pandemic. The deficit for 2019 was just under $1 trillion so even the “financially conservative” Republican senators are looking at a massive number which will add to the already $3 trillion of COVID spending not counting the stimulus from the Federal Reserve programs.
Is it right or wrong to run up these huge deficits? As we pointed out in our last few newsletters – not if you are paying 1.5% in interest on long term bonds and inflation is 1-2% higher than this. Even a little bit of inflation goes a long way to reduce the debt burden in real terms. The real question is, what is “inflation”? What we call inflation is really the price changes in a basket of goods constructed by the statisticians at government statistical agencies like the Bureau of Labour Statistics (BLS) in the United States and StatCan in Canada. This is part of the system of national accounting that documents aggregate economic data to inform public policy.
Depressing National Accounting
National accounting really started in earnest in the 1940s, after the Great Depression. Before that, the cycles in the economy were evident and a natural part of the boom and bust of economies. Nobody actually tracked any economic statistics before national accounting was introduced. It was clear when the economy was good and the stock market was booming, but it was not clear what led to the inevitable busts that followed. The depths and severity of the Great Depression of the 1930s promoted the idea of national accounting to provide a quantitative basis for policy markets to use for their decision-making.
The economists and statisticians added up all the value of goods and services in the economy by legally requiring reports from businesses, consumers and the government sector. They called this Gross National Product and started to track its cyclicality. They also did the same thing for Gross National Income, the sum total of all wages, dividends, interest, capital gains and other income in an economy. They also made up a National Accounts balance sheet to show the value of the assets and the liabilities in an economy. A survey of the prices of consumer goods became the Consumer Price Index (CPI) and the survey of the cost of goods at the wholesale level became Producer Price Index (PPI).
Unreal Growth
The actual dollar amounts of GDP were called “nominal”. Subtracting the CPI from nominal growth was called “Real Growth”. Once this system of economic statistics and accounting was put into place, a growing economy with “growth” became politically desirable and the avoidance of a drop in GNP or a “Recession” became the policy goal of governments and central banks. It also became the obvious goal of politicians in power to have the highest “real growth” possible.
Most of the investment world tends to believe “real growth” is actually real. What investors and politicians consider “real” is actually an artificial construct, taking actual nominal growth and subtracting out the reported Consumer Price Index, an artificial statistical construct. Given bond investors live in a “nominal world”, we think that nominal or “Current Prices” GDP is a more accurate reflection of what is going on.
A look at U.S. nominal GDP is informative. The chart below shows the compound annual growth rate of nominal GDP for a particular period. The recent average nominal GDP growth has tended towards 4%. In the 19 years since the Dot.com bust and subsequent recession in early 2000 until just before the COVID pandemic in early 2020, the compound annualized growth rate is 3.9%.
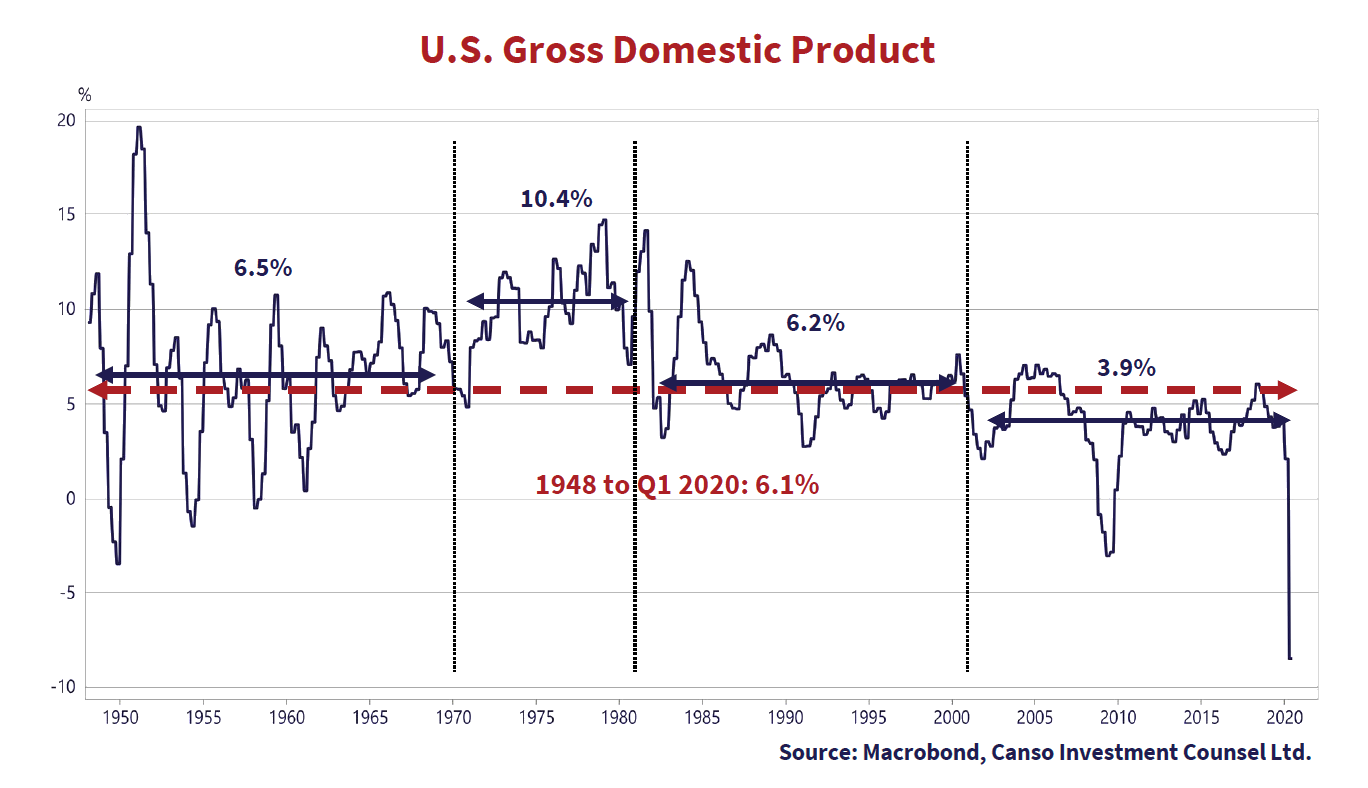
Things weren’t always as stable. In the postwar period from 1948 to 1968, growth swung from up 20% to down 5% until the early 1950’s but ended in a stable period with nominal GDP moving between 5-10% and averaging 6.5%. This was followed by the inflationary period of the 1970’s, after the 1973 oil shock, when nominal growth, aided by higher inflation, moved up to an average of 10.4%. Nominal growth was high because of extraordinarily high inflation but real growth was not, which was described at the time as “stagflation”. Nominal economic activity was rising but not much more and actually at times less than inflation.
The trend downwards in nominal GDP in the 1980’s reflects the Volcker Federal Reserve crushing inflation with very tight monetary policy that also caused a severe Recession. The period of the early 1990’s until now reflects monetary policy targeting of CPI. Except for the severe Great Recession after the Credit Crisis and the current COVID Recession, nominal growth has ranged between 0% and 7%, averaging pretty close to 5%.
The Bond Game is “Fixed”
Why all this discussion of national accounting and GDP growth? Well, a “Fixed Income” investment like a U.S. Treasury Bond has a fixed coupon payment. At the current yield of 1.5% on a 30-year U.S. Treasury Bond, the holder gives $100 to the U.S. government for the promise to pay $1.50 a year and his $100 principal amount back at maturity in 30 years. Is this a good investment? Renowned pension expert Keith Ambachtsheer disagrees and thinks that conventional government bonds at these ultra-low yields are totally unsuitable for pension funds:
“It is high time for retirees and pension funds to dial back their exposure to “dead-weight” bonds, according to one of Canada’s leading pension experts… Keith Ambachtsheer, the president of KPA Advisory Services in Toronto and director emeritus of the International Centre for Pension Management at the University of Toronto, argues that bonds at their current, dismal yields can no longer deliver the returns needed to fund retirements – not unless you assume savings rates well above what most of us would regard as practicable… “Twenty years ago, inflation-indexed bonds offered a real yield of 4 per cent,” Mr. Ambachtsheer wrote in a report. “Today their yield is not just zero, but actually negative.”
The upshot is that bonds are “dead-weight investments” that “currently have no role” to play in the investment policies of continuing pension plans, he said.” Source: McGugan, Ian. “Why one of Canada’s leading pension experts says it’s time for retirees to get out of bonds”; Globe and Mail, September 11, 2020.
The Negatives of Negative Yields
The other side of the spectrum are the central bankers and policy makers actively musing about nominal “negative yields” as a way to kick start economic growth. These are bonds issued to the investor at higher prices than they will get repaid at maturity, meaning less money than they invested. What this means is that these investors, as is actually the case now in high quality German government bonds, are paying the borrower for the privilege of lending them money.
What is an investor to make of all this?
A Scarcity of Common Sense
As our clients and newsletter readers know from our previous musings on this subject, we are in Mr. Ambachtsheer’s camp on this subject. Any Economics 101 student learns at her first class that an economy exists to “allocate scarce resources”. A corollary of this is that an economy’s financial system exists to allocate scarce resources. How can an effective system have lenders pay borrowers to take their capital and spend it?
It does point out that there is no scarcity of capital at the moment. In their enthusiasm to apply monetary policy to solve the world’s economic problems, the world’s central bankers are desperate to be seen as effective. Since the Greenspan Fed rescued the stock market from the October 1987 “Black Monday” Crash, the vogue of “Super Hero” central bankers has been to act first and think about the consequences later.
Slipping the Surly Bound of Zero
If low interest rates don’t bring instant economic salvation, then why not “slip the surly bonds” of the “zero interest rate bound” and soar the economy on negative interest rates? Free markets, strict monetarist inflation targeting and price stability have been discarded. Interventionists policies are thrown willy nilly into the financial fray in the desperate hope that something, anything works!
Things like the current serious discussion of negative interest rates make it seem to us that there is no scarcity of legalized marijuana in academic and central banking economic circles. Perhaps what is needed is for legislators to force all central bankers to do professional development by sitting through the “allocation of scarce resources” Economics 101 lecture with first year university undergraduates.
A Credit to Social Credit
To show how far out of the box that central bankers and other economists are currently thinking, we turn to the Social Credit movement in the 1920’s and 1930’s. Based on the theories of C.H. Douglas, a self-taught British mechanical engineer and WW1 Royal Flying Corps officer, the movement believed that the capitalist economic system at the time was organized to maximize profits and exploit labour through artificial scarcity. The solution was to provide “Social Credit” to all citizens through extending credit with no obligation to pay it back, in other words, “free money”.
Given the grim economic backdrop of the Great Depression of the 1930’s, the Social Credit movement grew throughout the British Empire, especially in Canada. Canadian Social Credit political parties were created and were even elected to power in Alberta and British Columbia and lasted into the 1980’s, albeit much more “mainstream conservative” in their thinking. Financial bureaucrats, central bankers and mainstream politicians discounted Social Credit theories as radical socialism and “pie in the sky”.
A “GIFT” Better than “Free Money”?
You might ask why we have given you an economic history lesson in Social Credit. Think about “free money”. There is only one thing better than allowing borrowers to access financial capital as a free good without paying anything. That would be negative interest rates, forcing lenders to pay borrowers interest along the way! The fact that North American central bankers are actually seriously considering negative interest rates astounds us. Clearly, they have not thought this through. Even President Trump is now on the negative interest rate bandwagon, tweeting: “As long as other countries are receiving the benefits of Negative Rates, the USA should also accept the “GIFT”. Big numbers!”. So much for the financial orthodoxy of the Republican Party. If anyone knows how to borrow and not pay it back, it is Mr. Trump, a serial corporate bankrupt.
Even if borrowers don’t get Trump’s “GIFT” of negative interest rates, current interest rates and bond yields are extraordinarily low on a historical basis. The Fed is now adopting a new policy of allowing inflation to stay “above trend” for a “protracted period” to make up for prior below target inflation. What this means is because of this period of low inflation that we’re just going through, the Fed is aiming to leave inflation “Higher for Longer”. That sounds more than a little “1970’s-ish” to us.
A Spoonful of Inflation Medicine
To paraphrase the Mary Poppins song: “Just a Spoonful of Inflation Will Make the Debt Go Down”. If incomes and spending are rising, then there will be a lot more future money available to repay debt. If the U.S. government issues 30-year long term fixed rate debt at the current yield of 1.5%, they will be paying $1.50 annually in coupon and don’t have to pay back the $100 principal value for 30 years. This amount will not change, it is “fixed”. This is Mr. Ambachtsheer’s problem with bonds. Locking in a very low or even negative return on fixed income instruments literally condemns the holder to having much less money in the future than other investors who have participated in the increasing cash flows in the economy.
Targeting Inflation on the “Debt Trap”
Projections of the National Debt going forward depend highly on the estimates for economic growth and future interest rates going forward. We have made the chart below to explain why the Fed has decided to do away with its “inflation targeting” that was only formally introduced in 2010. This shows the current U.S. GDP as the grey line. It peaked at $22 trillion at the end of February and now has dropped to $19.5 trillion with the pandemic recession.
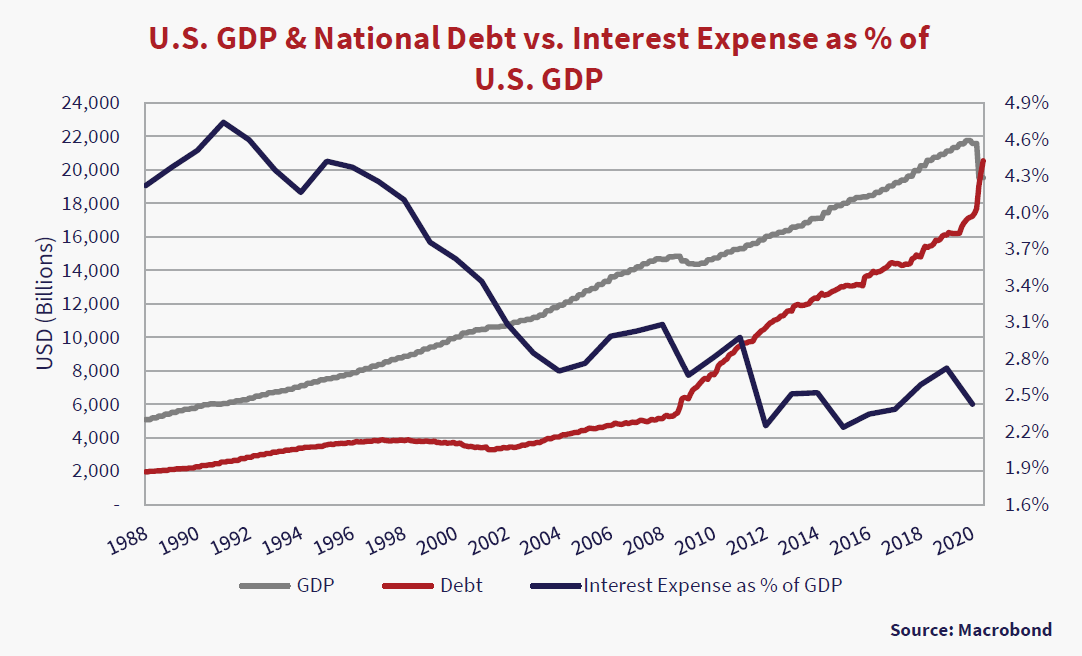
We also show the current U.S. National Debt as the red line, which is $21 trillion, now more than current GDP, after increased government borrowings and the drop in GDP during the pandemic. The blue line is the current interest cost on the U.S. National Debt as a percent of GDP. It is dropping with ultra-low interest rate policy.
You can see the mathematical basis for the Fed’s move. Substantially growing GDP is the only way to escape the dreaded “debt trap”. Will GDP always outgrow the National Debt? Modern Monetary Theory adherents certainly believe that the U.S. government, with the U.S. dollar as the reserve currency, can issue unlimited amounts of debt to fund economic growth so there’s a chance the Debt will grow substantially.
Compounding Debt Problems
A look at another chart is helpful. We show the actual amounts of U.S. GDP versus the National Debt since 1970. We have also included the Compound Annual Growth Rates (CAGR) for both. Over the entire period, GDP grew at a CAGR of 5.9% and the Debt grew at a higher 9%. This is not necessarily bad, as the interest cost of the debt plunged during the period. During the highly inflationary period from 1972 to 1982, GDP actually grew at a higher 10.9% than the Debt at 9.8%. This is instructive to bond investors. Whether the official CPI numbers are reliable or not, high nominal GDP growth is the way to deal with a debt problem.
The inflation of the 1970’s was followed from 1982 to 2002 by a period of disinflation where GDP slowed in nominal terms at 6.1% and the Debt grew at 7.5%. It is interesting to note that, as we have pointed out before, the Debt actually dropped in nominal terms from 1998 to 2001 as the U.S. government ran budget surpluses and paid down the debt. The good thing about this period was the sharply dropping interest rates on new debt.
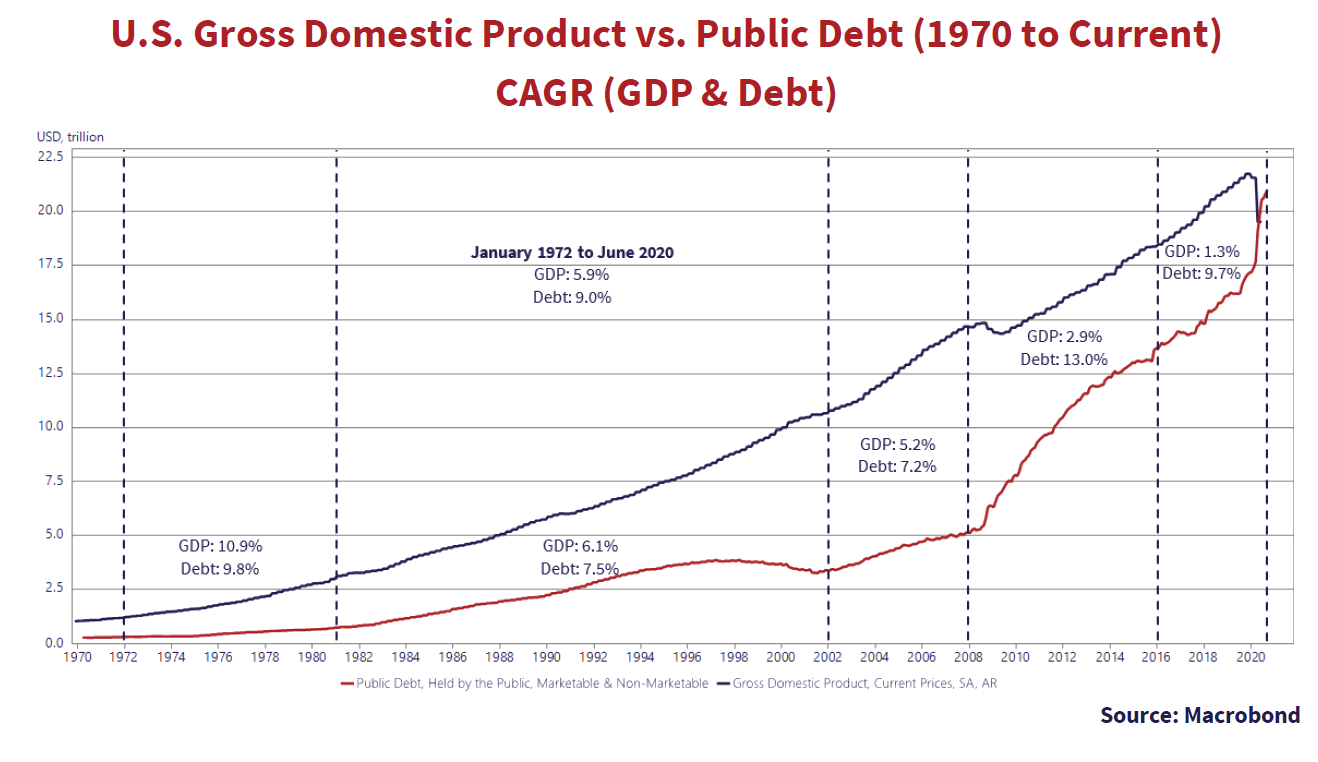
The period from 2002 was nothing special, as GDP grew 5.2% and Debt grew a little faster at 7.2%. Then things changed considerably after the Credit Crisis and Great Recession with subsequent fiscal stimulus. During the period from 2008 to the election of Donald Trump in 2016, GDP only grew 2.9% versus the Debt growing at a much faster 13%! The Trump years from 2016 to now have not been great, as GDP has only grown at 1.3% compared to a boom in Debt at 9.7%.
The thing that made this debt growth possible was the willingness for investors to buy debt with ultra-low yields, courtesy the very loose monetary policy of the U.S. Federal Reserve. We have already shown you a chart above that shows the interest cost of the National Debt as a percent of GDP is dropping, despite the large increase in debt. In the chart below, we have taken the interest payments on the National Debt and show the average interest or “coupon” on the debt outstanding.
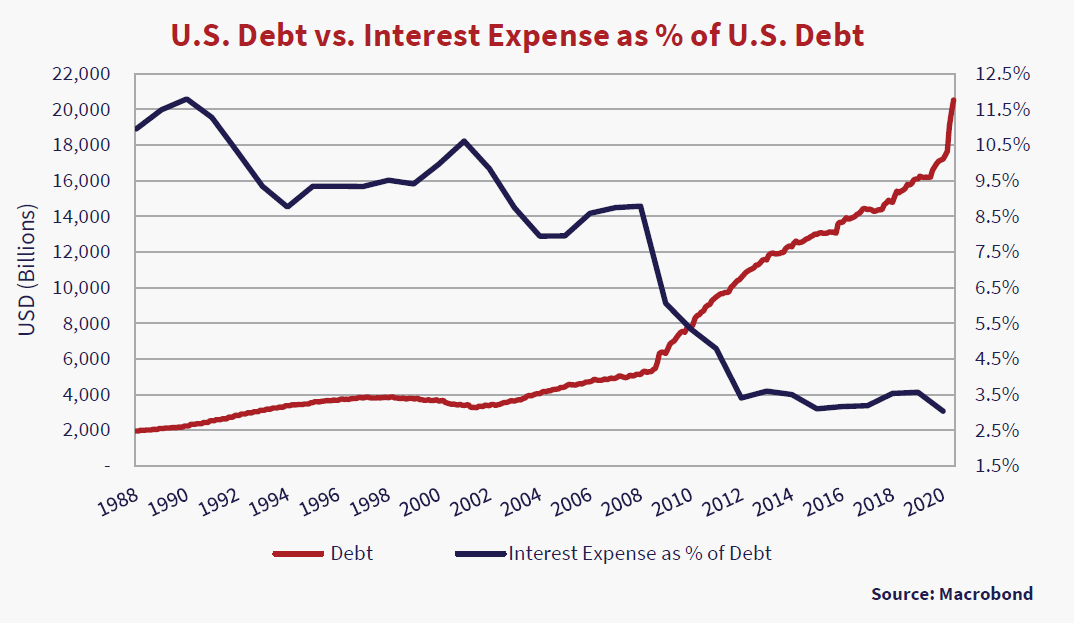
The red line is the National Debt versus the left axis scale in billions, which has increased more than ten times from $2 trillion in 1988 to the current $20.5 trillion. The right axis is the interest expense, which has dropped from 10.7% in 1988 to the current 2.8%. Clearly, if you’re issuing your new debt and rolling over your existing debt at very low interest rates like the U.S. government, it’s a great thing.
The Magic of Compounding Math
We have also done the opposite in the chart below. Instead of looking into the cash flow future, we look at today’s value, or the Present Value (PV), of the $100 due at maturity of a T-Bond in 5, 10, 20, 30 and 50 years at growth rates from 1% to 6%.
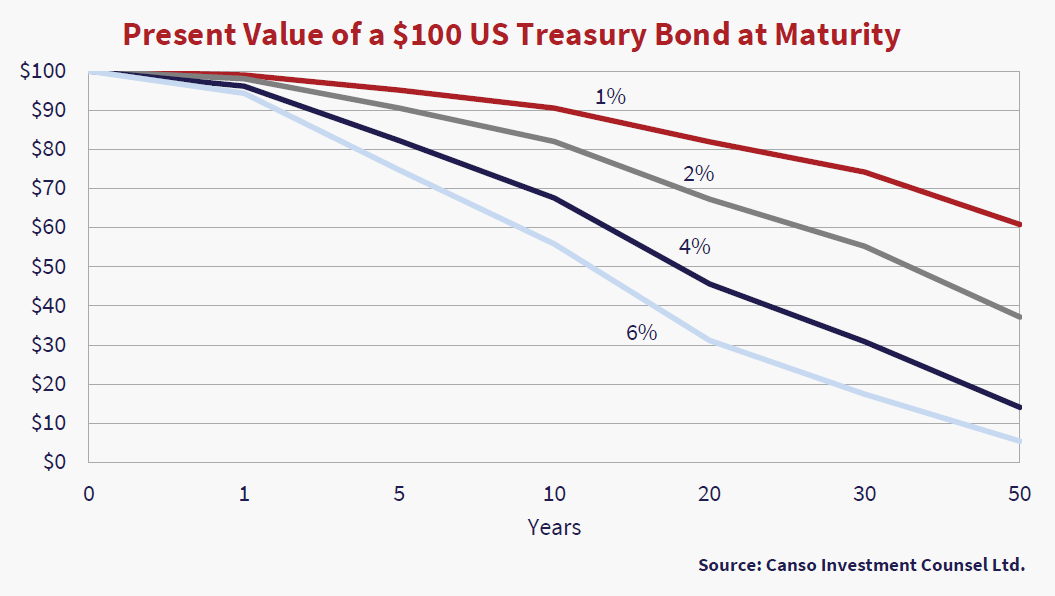
We really don’t have to run economic models to figure this out. Essentially, if your debt is nominally fixed at current interest rates, then it’s easy to grow your way out of it. At even 1% nominal growth, the present value of $100 is $90 in 10 years and $60 in 50 years. At 4%, the PV of the $100 drops to $65 in 10 years and $15 in 50 years. At 6%, the $100 is only $5 due to the magic of compound mathematics.
Choose your numbers. If nominal GDP grows at 4% with CPI at 2%, the “real growth” is 2% but the nominal cash flows still grow at 4%. That’s the game of the Fed here. If everyone is convinced there is no inflation and are willing to live with the current 1.5% yield on their 30-year T-Bonds, then these investors will effectively get repaid $30 of current dollars. If nominal growth is 6% and CPI averages 4%, then the “real growth” is still 2% but the investor in a T-Bond is only demanding $14 in today’s dollar for their repayment.
Markets Repeat
As we write this newsletter, the markets seem more than a little repetitive. As we said in an earlier Market Observer, the movie “Groundhog Day” comes to mind. Like Phil the TV newsman, we seem stuck in a time “Do Loop”, endlessly covering the same things. After nearly 23 years of writing about the markets for our clients and readers, the human propensity for investment stupidity and market cyclicality loom large. Investors seek risky investments for little potential return in soaring markets. They then shun great investments at the bottom, psychologically bloodied and battered and hiding out from their “irrational exuberance” at market tops. This seems to be our resounding theme.
A wise investor ignores market sentiment at his or her peril. Markets are a human construct. It takes people buying and selling to create a market. Yes, they might program their computers with an algorithm, but its instructions or “artificial intelligence” enrich or impoverish human beings on each side of their trades. Despite the academic fantasy of dispassionate and coldly efficient “perfect markets”, human foibles are very much on display in market movements. Hopes and dreams of riches disappear into despair and the nightmares of a market rout.
The Ghosts of Market Past
We usually start our “idea generation” by revisiting past Market Observers. Like Ebenezer Scrooge in “A Christmas Story”, the ghosts of markets past appear to us out of the fog of our memories, surfaced in our writings of those times. From our start in 1997, we have emphasized the credit cycle and market liquidity or lack thereof.
Boom, bust and repeat.
What strikes about this time around is that things went from the depths of investor despair and illiquidity in March to almost euphoria by the end of June. This was despite the seriousness of the COVID-19 pandemic, what economists call an “exogenous shock”. And this was some shock as many businesses, large and small, saw their revenues literally evaporate in the medical social lockdown. From car factories to restaurants, the workers were sent home and “furloughed” with or without pay.
As we tell our young colleagues, there aren’t many businesses that can stand 3 months or 25% of missing revenues. Looking at overall business operating statistics, the net profit margin after taxes of the average company runs at about 5-10% of revenues. For each dollar in revenues a business receives, the owners or shareholders get to keep a nickel to a dime after their expenses are paid. They just lost 33 cents of revenues, so things aren’t great for many businesses. It will take them 3 to 5 years just to make up the revenues they lost in profits.
No Economic Equality
This isn’t equally impacting all businesses. Digital businesses like Amazon, grocery stores and delivery companies are thriving. The hospitality industry saw hotels and restaurants almost completely shut down from social distancing and they are now struggling to get their clientele back. Even if they’re open, it is not likely that people will pack restaurants with COVID cases spiking. Airlines dropped to only 10% of their year ago revenues and now are only seeing 40% as the second wave of COVID infections threatens travel anew. The political and medical situation is fraught with risk to the unwary investor at this juncture. We think things could be more than a little bumpy from here to March.
Turbulence Ahead
We look forward to our January Market Observer newsletter when we might have more visibility into the U.S. political and economic situation. Whether President Trump wins the election or not, he is not likely to go “quietly into the night” so the U.S. political situation could be unsettled well into 2021.
Until then, the storms loom ahead on the Canso radar and we have not much choice but to tighten our portfolio seatbelts and prepare for some possibly heavy weather ahead with significant market turbulence. Once we get through it and into clear skies, we expect that many of the positions we have in the portfolio will do very well. So a few bumps along the way will be well worth it!
Stay healthy and you’ll hear from us in January!
Summary
- As our clients know from our Canso Client Letters in March and our April Market Observer, we believed that central banks and governments globally would have to react to the dire economic and financial effects of the pandemic, which they have. All the cash flowing into the financial markets stopped the downdraft of March and the liquidity of cash they created unleashed a huge updraft in the financial markets that started in late March and continues currently. This was a good thing because a financial market crisis during an unprecedented global pandemic and economic shut down would have ended very, very badly.
- The good news is that, in our view, no matter who wins the election, the COVID situation in the U.S. will improve early in 2021 because of better public health implementation and possible vaccines. Clearly COVID is not “going away” and whoever wins the election is likely to understand the seriousness of the medical situation. The direct support and other fiscal stimulus have benefitted the “income insecure” at the lower end of the wage scale and increased incomes for those still working.
- The Trump Administration was already running the highest peacetime deficits in history even before the COVID pandemic. The deficit for 2019 was just under $1 trillion so even the “financially conservative” Republican senators are looking at a massive number which will add to the already $3 trillion of COVID spending not counting the stimulus from the Federal Reserve programs. The aggressive monetary policy by the Federal Reserve has also lowered interest rates and the cost of credit for those still able to work, making credit easily available.
- What strikes about this market crisis is that things went from the depths of investor despair and illiquidity in March to almost euphoria by the end of June. This was despite the seriousness of the COVID-19 pandemic, what economists call an “exogenous shock”. And this was some shock as many businesses, large and small, saw their revenues literally evaporate in the medical social lockdown.
- COVID isn’t equally impacting all businesses. Digital businesses like Amazon, grocery stores and delivery companies are thriving. The hospitality industry saw hotels and restaurants almost completely shut down from social distancing and they are now struggling to get their clientele back. The political and medical situation is fraught with risk to the unwary investor at this juncture. We think things could be more than a little bumpy from here to March.
- We look forward to our January Market Observer newsletter when we might have more visibility into the U.S. political and economic situation. Until then, the storms loom ahead on the Canso radar and we have not much choice but to tighten our portfolio seatbelts and prepare for some possibly heavy weather ahead with significant market turbulence. Once we get through it and into clear skies, we expect that many of the positions we have in our portfolios will do very well. So a few bumps along the way will be well worth it!
Learn More About Canso Investment Counsel
Learn More About Lysander-Canso Investment Solutions
Originally posted on Canso Investment Counsel
![]()
![]()