

Sprint to the Finish
Corporate bond markets raced higher in the fourth quarter as inflation continued to decline, labour market strength showed signs of moderating and Federal Reserve policymakers signaled their rate hiking efforts may be coming to an end. Yields plummeted across government curves, sending the 10-year Government of Canada bond down 91 basis points (bps) and its U.S. counterpart down 69 bps. The shift in tone sparked an expansive rally, propelling equities, investment grade and high yield bonds higher.
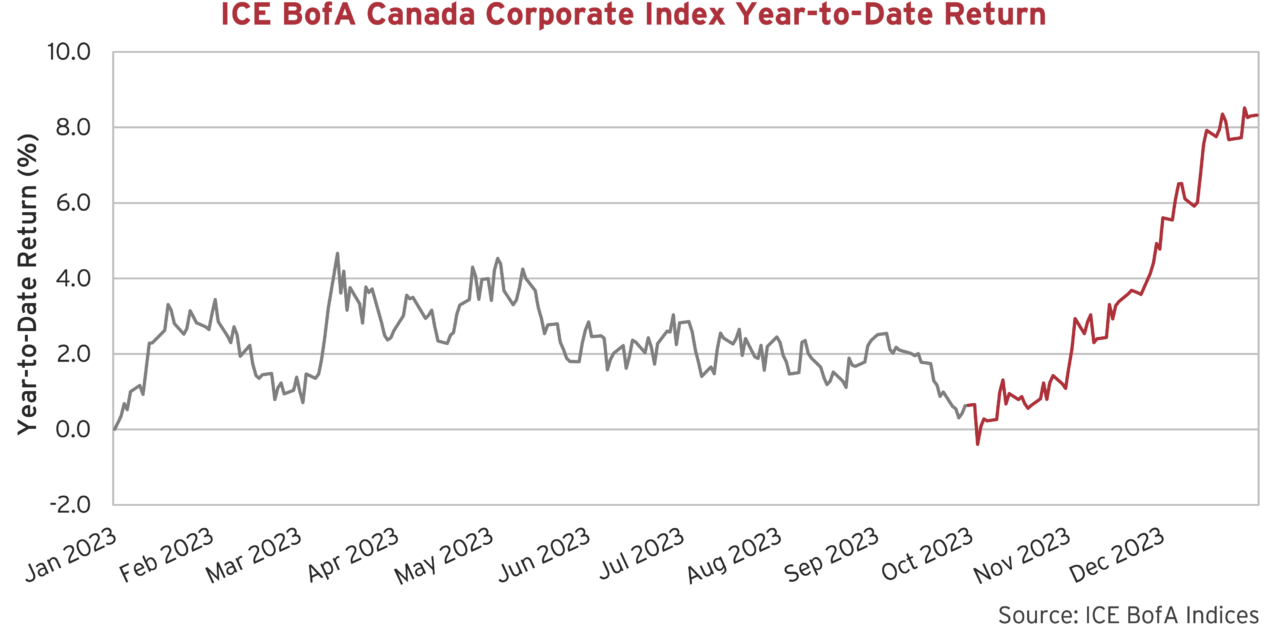
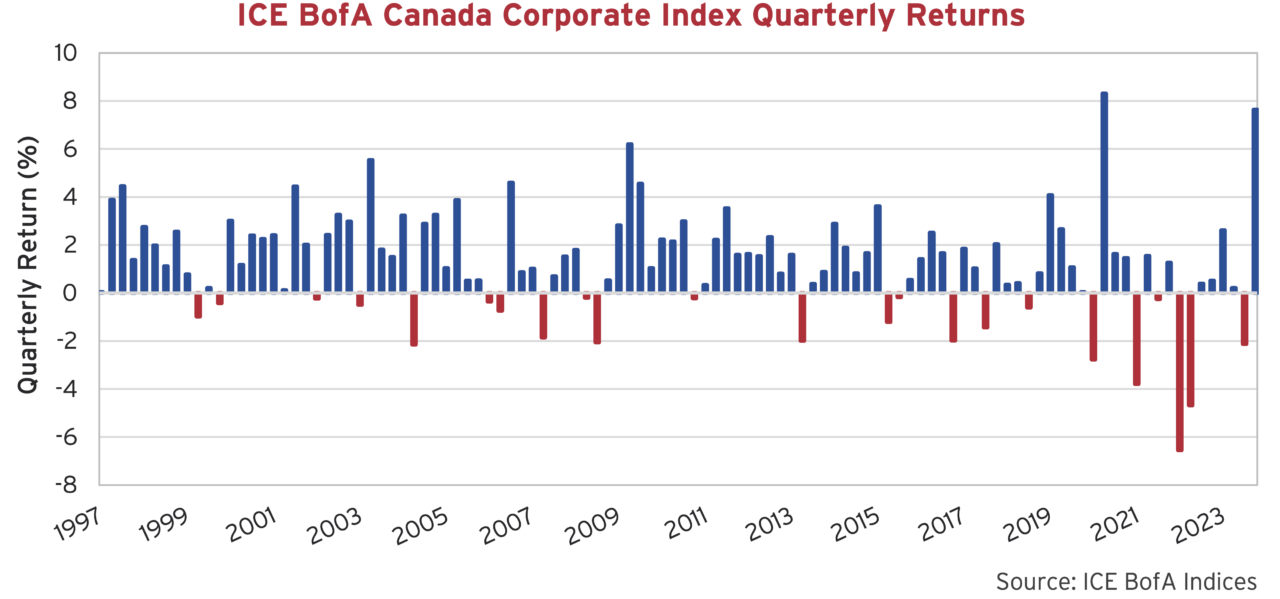
When we last wrote to you in October, the ICE BofA Canada Corporate Index was at risk of posting its third consecutive year of annual declines. The index was up only 0.6% through the first nine months of the year and had just dipped its toe into negative territory. Little did we know what November and December would bring. Sharp declines in government bond yields and shrinking risk premiums pushed Canadian investment grade across the line with a 7.6% quarterly return – the second strongest quarterly performance of this century.
The Bottom Line
A strong fourth quarter capped off a comeback year in 2023. Risk assets bounced back from disappointing 2022 results, with the Nasdaq Composite rising 45% in 2023 after falling 33% the previous year. Strong performance of risk assets extended to the below investment grade universe as well. The U.S. High Yield Index and U.S. Leveraged Loan Index were both higher by 13% on the year as credit spreads tightened and corporate defaults remained low.
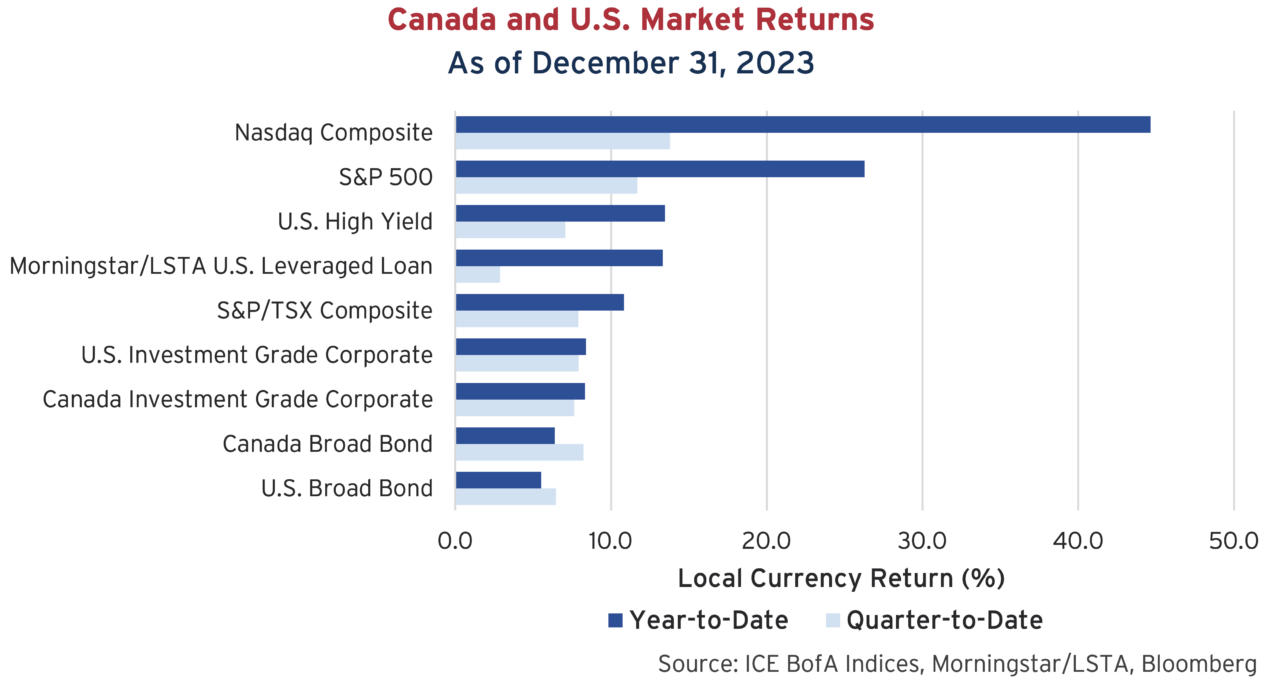
Investment Grade indices also rose as higher starting yields, falling government rates and tightening credit spreads pushed returns higher in the end. The Canadian Investment Grade Index was up 8.3% on the year, boosted by the 7.6% return in the final quarter. The U.S. Investment Grade Index rose a comparable 8.4% over the year. As a reminder, these two markets were down 10.1% and 15.4%, respectively, in 2022. The Broad markets, which include government bonds issued by federal and provincial entities, finished the year in positive territory after declining over the first 9 months of the year.
A Random Walk Down Bond Street
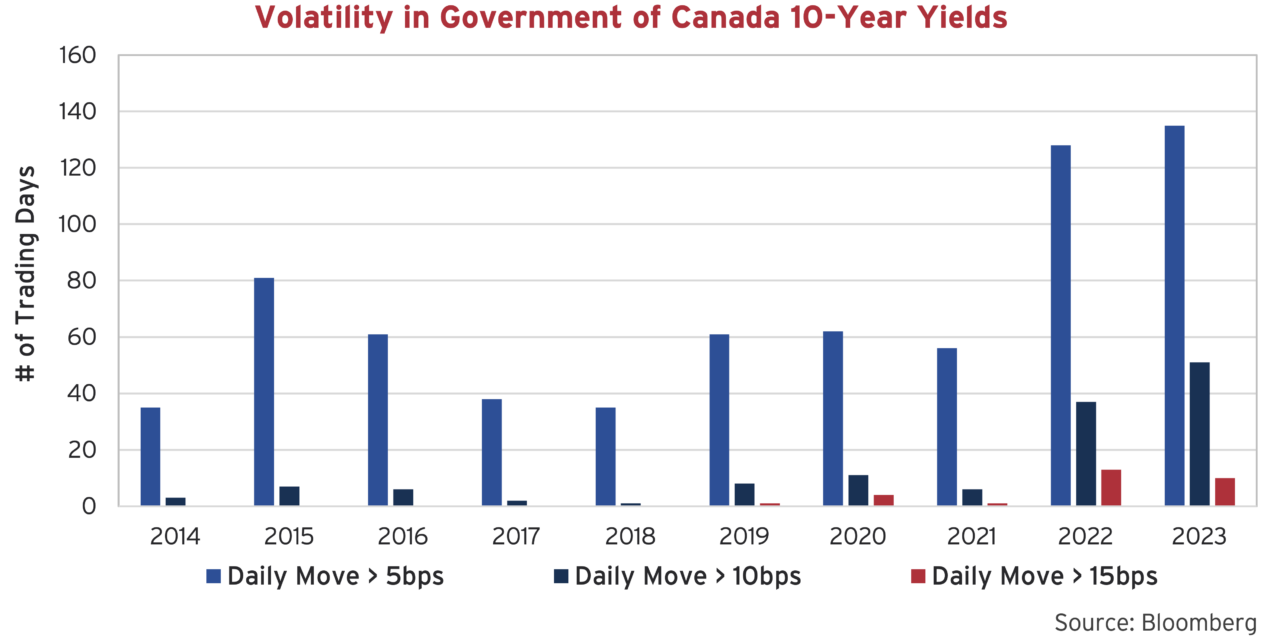
A year ago, we produced the study below to assess the uncharacteristic volatility we were experiencing in the bond market. We noted, “in the boring bond markets, a move of more than 5bps in a day is noteworthy.” As we extend the study into 2023, it is clear that bond investors remain confused.
When we look at the 10-year Government of Canada bond, yield moves greater than 5bps occurred on more than half the trading days in 2023 (135 of 259). In addition, the bond’s yield moved in excess of 15 bps on 10 separate days, more days in 1 year than the full decade preceding 2022. The end of the 40-year bond bull market in 2022 and the move into whatever comes next continues to confound investors.
Corporate Action
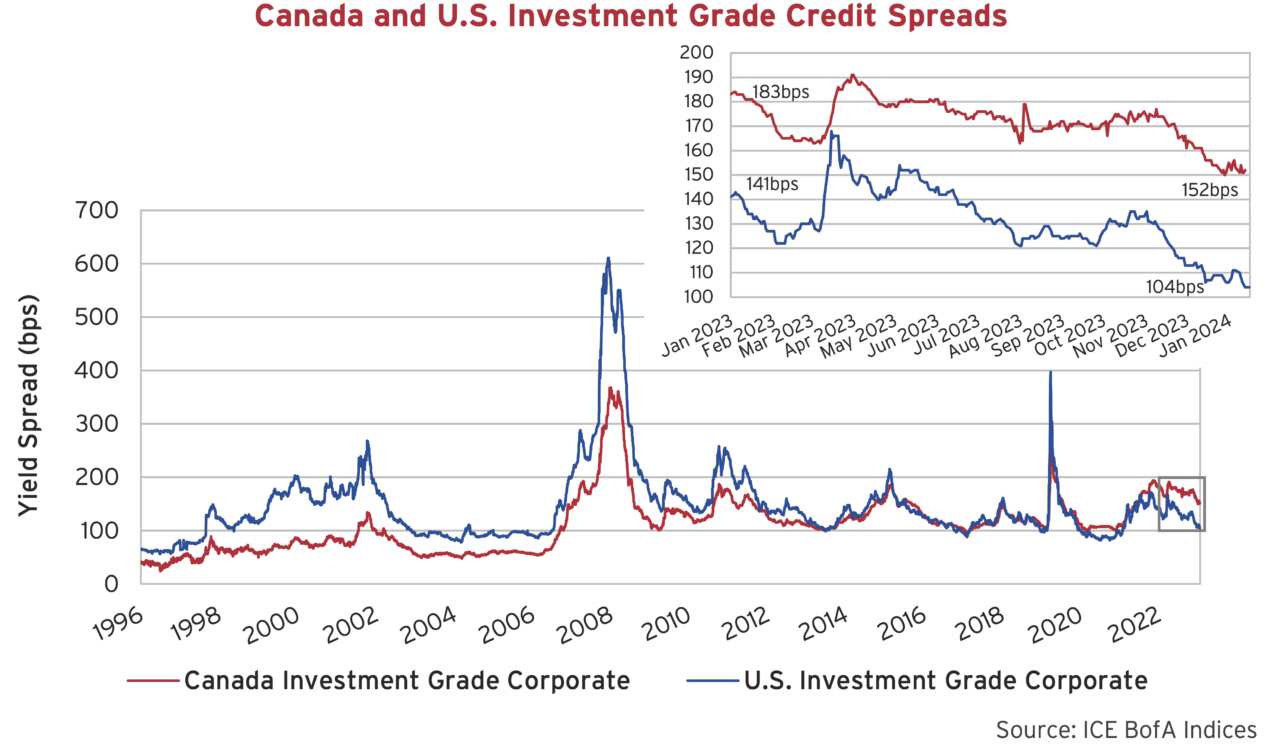
In contrast to the volatility in government rates, investment grade credit spreads continued to be well behaved. Spreads in both Canada and the U.S. pushed tighter in the quarter, adding to falling government bond yields, to the benefit of investors. Investment grade risk premiums in Canada and the U.S. followed very similar paths on their way to new tight levels for the year. The graph below highlights the experience through 2023. With the two markets tracking closely this year, investment grade spreads in Canada continue to look like better relative value, as they persist notably higher.
Financially Dependant
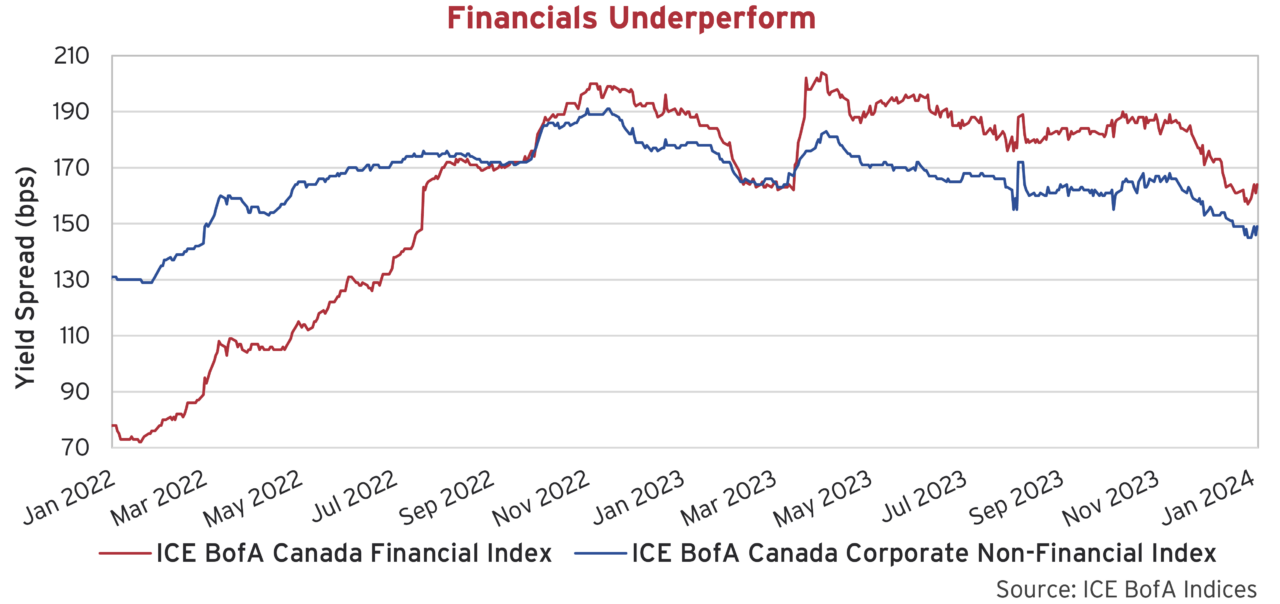
The difference can be traced back to the relative underperformance of financials in Canada last year, which continue to bias index spreads higher. As we have previously noted, the Big Six Canadian banks flooded the domestic market with $61.7 billion in new corporate bond issuance in 2022, which more than doubled their volume of the prior 2 years. The result was steadily wider spreads, which dragged the overall investment grade index wider than its U.S. counterpart. The steady widening of the Corporate Financial Index in Canada through 2022 illustrates this point.
The situation leveled off last year as the amount of new issuance normalized. The Big Six issued just $33.5 billion in 2023, while pure corporate issuance perked back up to just under $70 billion, which was a year over year increase of around 33%.
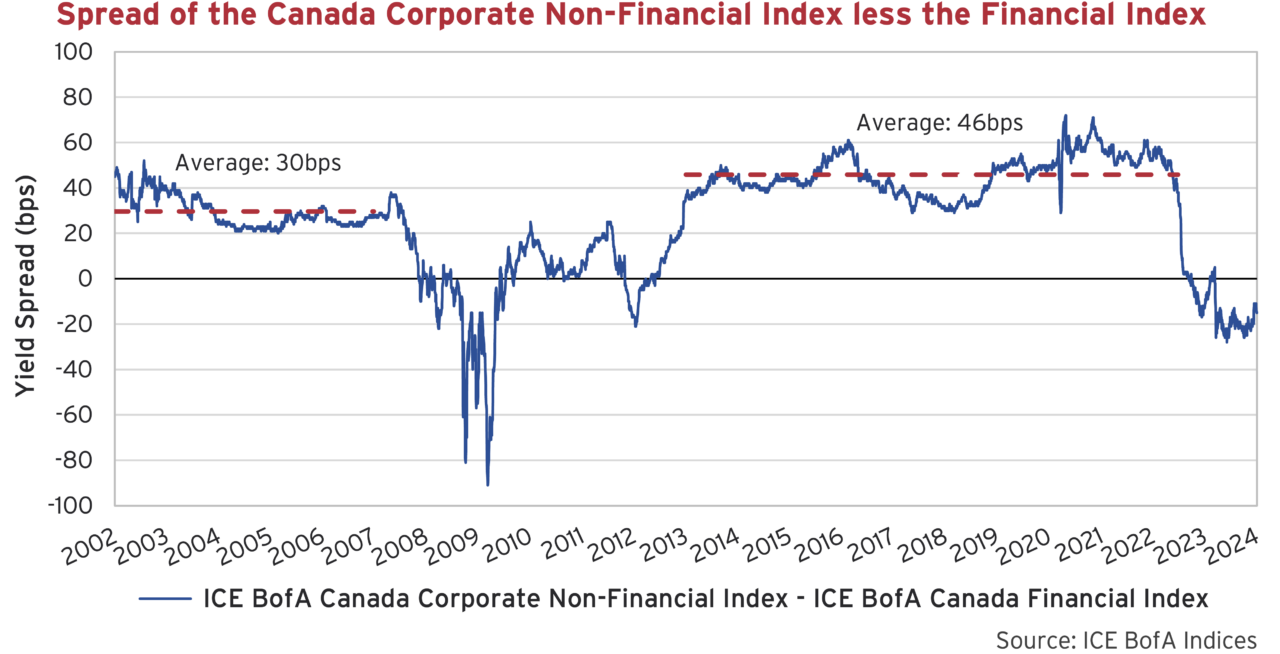
The relative spread of the financial sector to the rest of the corporate index in Canada currently sits at past financial crisis levels. Below we have plotted the difference in credit spread between the Non-Financial and Financial Index. In more normalized conditions, Non-Financials are valued at credit spreads 30-40 bps higher than Financials. Since inception of the index, this relationship was only inverse during the Credit Crisis, the Euro Debt crisis and then again beginning in 2022.
We must note that this is not a perfect comparison. Financials have a higher quality bias with only 20% in BBB rated bonds, whereas Non-Financials have almost 62% in BBBs. Financials are also much shorter with its index having a weighted average term of 3.8 years, relative to 11.4 years in the Non-Financial. These differences should support tighter relative spreads for Financials and historically this has been the case.
Longing for Yield
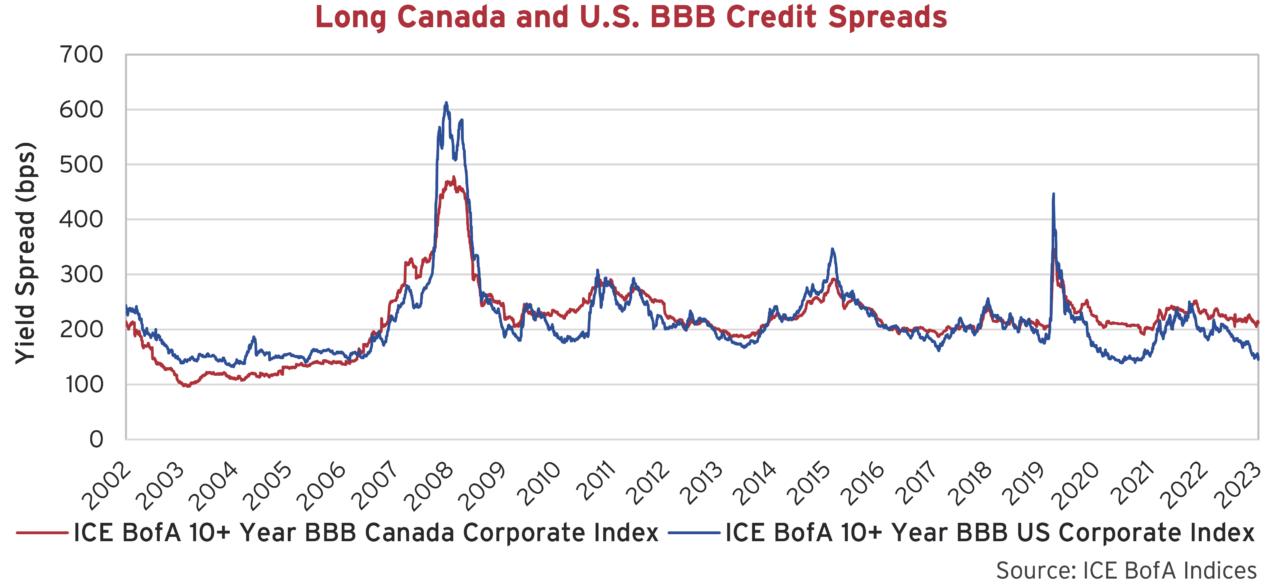
In our attribution of the credit spread differential, we also point to relative spreads in long term corporate bonds. The overall impact is not as significant as with financials but is still noteworthy. Long corporates in the U.S. benefit from a much deeper pool of capable (and willing) long duration buyers that can drive spreads much tighter. The graph below compares long term BBB-rated corporates in each market. Long BBB bonds in Canada have seldomly tightened much inside 200 bps, whereas things have gotten much more expensive down south. This was the case over the last year, as long BBB bonds in the U.S. tightened a spread of 145 bps, relative to the Canadian market at 212 bps.
All That Glitters
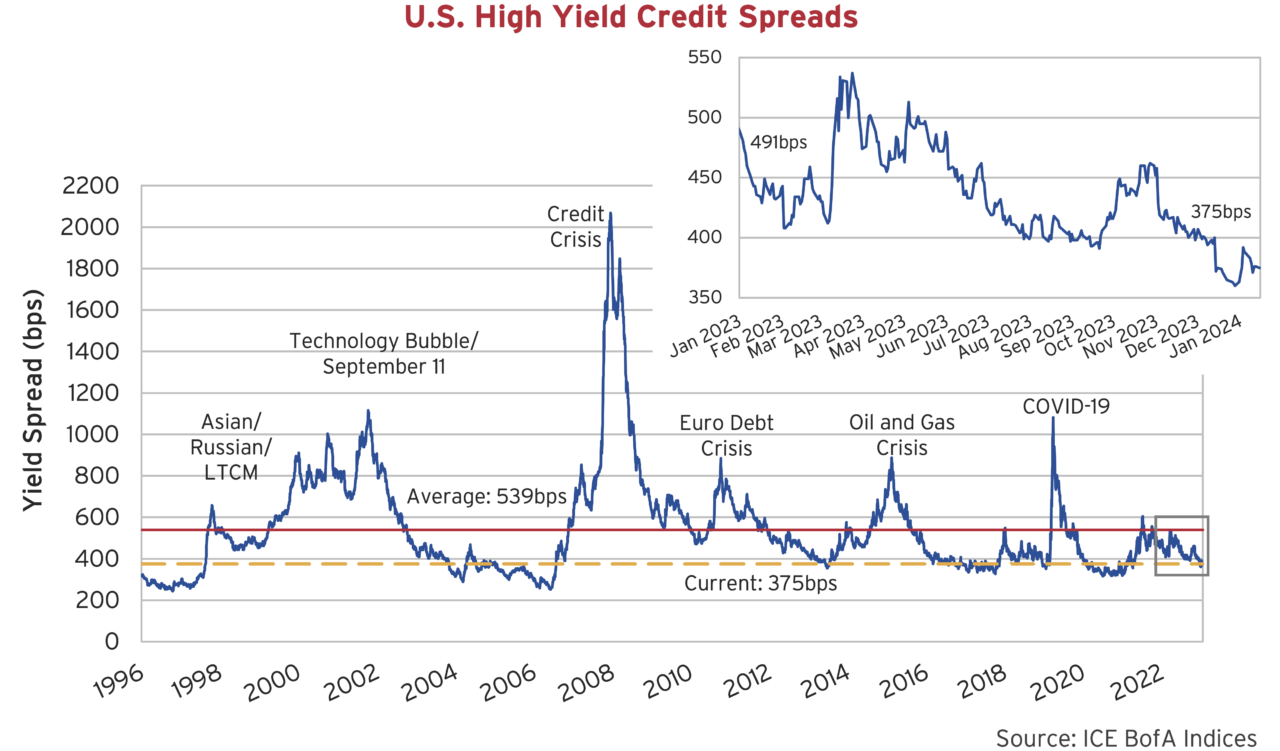
High yield credit spreads also significantly benefitted from the Fed fuelled rally over the final two months of 2023. Spreads tightened sharply in the early days of November and then again in December as markets forged ahead with expectations of more aggressive easing next year. By the time investors punched the clock for the holidays, spreads had moved in 53 bps for the quarter and levelled comfortably inside of the 400 bps tights for the year. Even after settling higher in the new year, spreads continue to be well inside of the series average, and based on historical precedent, offer little spread upside relative to the risk.
Open Season
Renewed optimism reopened the new issue window, as primary market conditions improved alongside the surging demand for existing high yield bonds. According to Pitchbook LCD, yields on new issue U.S. high yield bonds fell to 8.9% during the quarter and issuers have been opportunistically upsizing deals to take advantage of strong demand. The market also saw issuers come off the sidelines with unsecured deals which, as we have previously written about, comes in a year that has been dominated by secured issuance at unprecedented levels. And while CCC-rated issuance has been almost non-existent this year, insurance company USI Inc successfully raised US$620 million on December 14th in the first CCC deal to come to the market since April. This rejuvenation gives us the sense that capital is not exactly scarce in the most speculative ends of the credit market.
Welcome Back
UBS came back to the Additional Tier 1 (“AT1” or “Coco”) market in November for the first time since completing their acquisition of Credit Suisse. As a reminder, Swiss regulators wrote down to zero CHF16 billion of Credit Suisse AT1 debt only 8 months prior. Despite this, UBS successfully raised US$3.5 billion of new AT1 debt at coupon rates of 9.75% in a deal that was reportedly 10 times oversubscribed.
I’m Still Standing
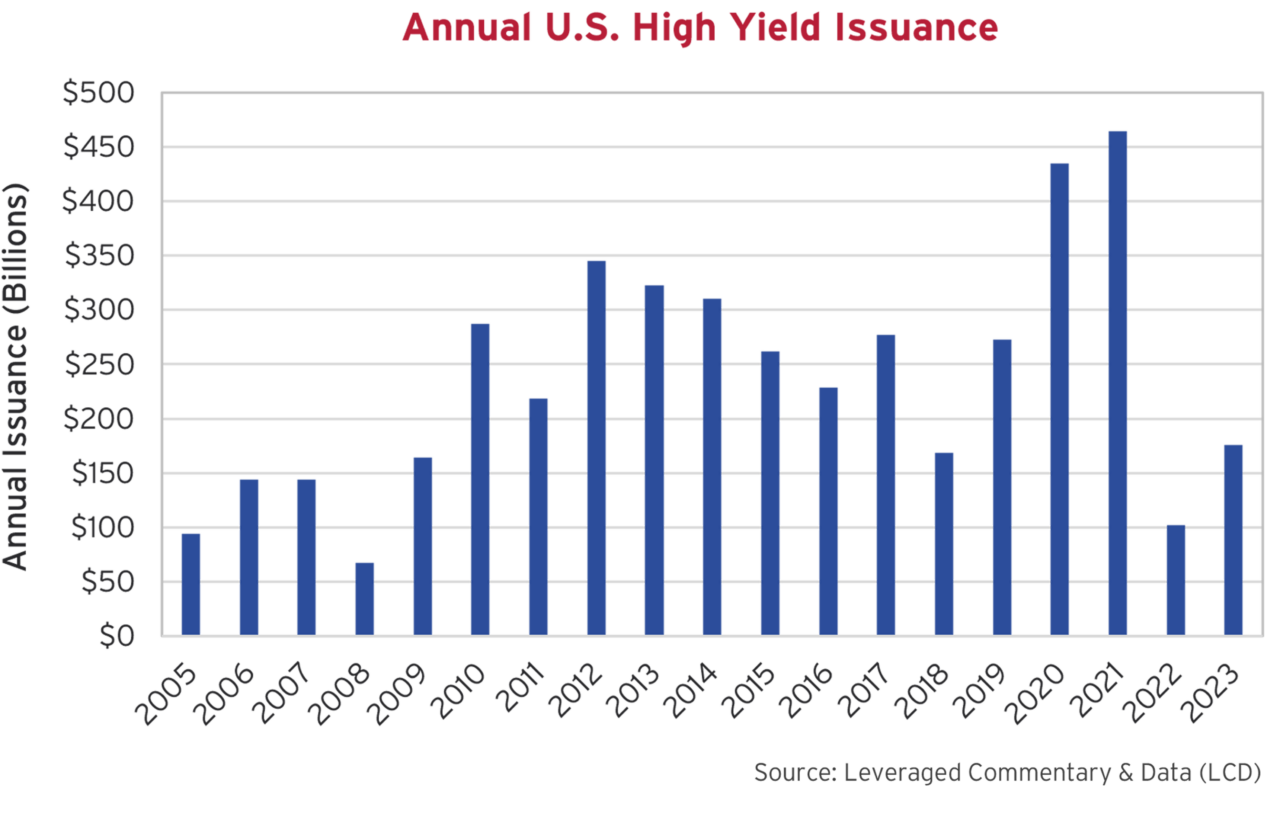
Opportunistic issuance in November and December pushed the total annual issuance levels for U.S. high yield bonds to a large year over year increase. The chart below shows this increase but also provides some perspective to the magnitude of issuance activity in 2020 and 2021. Issuance totaled $176.1bn in 2023, 72% above the 2022 total but still 35% below the trailing 10-year average.
Among the issuance in this past year, refinancing activity returned to more normal levels. Pitchbook LCD has calculated refinancing driven issuance accounted for 63% of total new issue volume this past year, which is up from 48% in 2022. Throughout 2022, sharply rising yields and tighter market conditions kept many issuers on the sidelines, many of whom had that luxury after terming out debt in very favourable conditions through 2020 and 2021. This last year more issuers were forced into the market to address maturities and funding needs. Among these issuers were lower quality B-rated issuers as well as others who opted to refinance institutional loans with bonds to lower their funding costs.
Here I Go Again
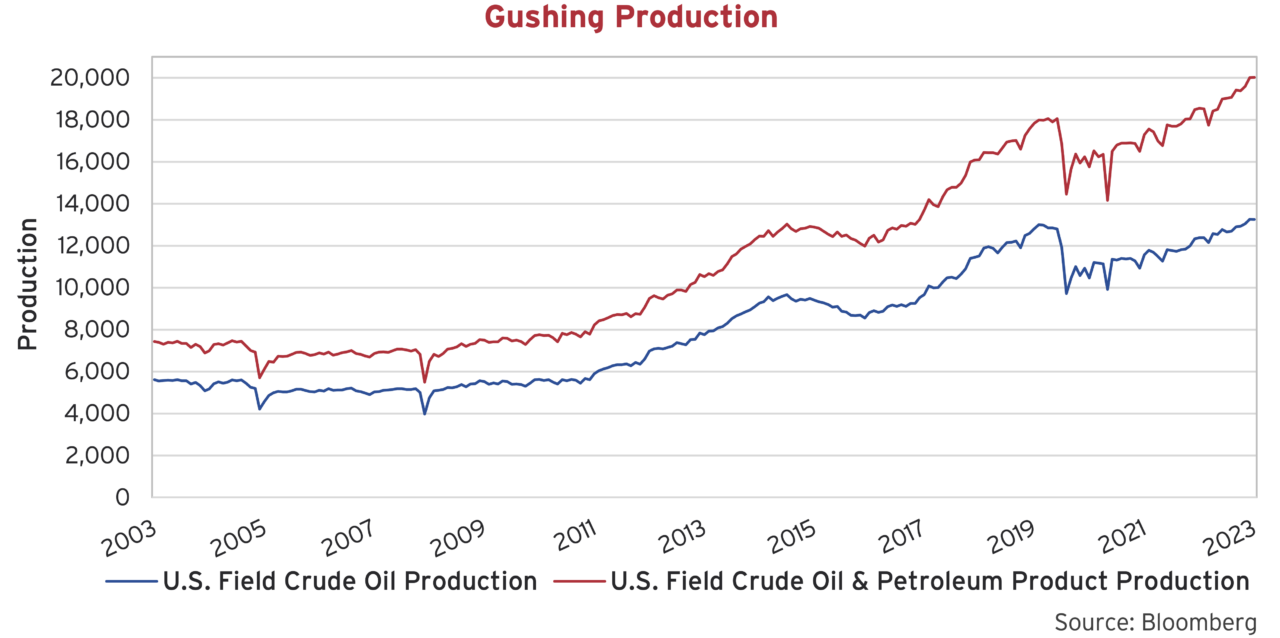
Oil & gas issuers are once again going down the only road they’ve ever known: expansion. M&A activity has spiked with a flurry of blockbuster deals. Kicked off by “the majors” in October, AA- rated ExxonMobil announced a US$65 billion takeover of Pioneer Natural Resources while AA- rated Chevron announced a US$60 billion takeover of Hess Corporation. In December, BBB- rated Occidental Petroleum continued the action, announcing a US$12 billion acquisition of CrownRock LP and most recently BB rated Chesapeake Energy and BB+ rated Southwestern Energy announced a US$7 billion merger. The growth of production within the United States over the past 15 years has been truly phenomenal as technological advancements have led to a more than doubling of output.
The capital cycle is fierce within the oil & gas sector. In 2014, oil prices halved in the back half of the year before eventually dropping over 70% from above US$100/barrel to below US$30/barrel. For the next few years, producers slashed capital expenditures and operating expenditures to temper the declines. By 2019, oil had risen back above US$60/barrel and expansion returned in full force: highlighted by Occidental and Chevron’s bidding war over Anadarko Petroleum. Occidental ultimately won with a US$57 billion bid, a sum largely financed through debt.
Within a year, expansion and prices had peaked again, and the cycle continued. Covid lockdowns crushed demand, sending prices down 70% (even before temporarily going negative). Producers cut capex and opex in 2020 and borrowed heavily in the corporate bond market. When prices stabilized in 2021 and then accelerated in 2022, producers acted as though they had finally learned their lesson. Excess cash was dedicated towards debt repayments, as expansion was shunned. As time passed, priorities transitioned from debt repayments to share buybacks, then share buybacks to dividend increases. It now appears that “expansion” has shifted back into focus.
Occidental is the only acquirer listed above that is planning to issue debt to finance their acquisition. Occidental was investment grade rated when it made the Anadarko acquisition in 2019 before spending 3 years in the credit rating agencies’ penalty box (sub-investment grade) from 2020 to 2023. The company will look to ride its recent upgrade back to investment grade and issue US$9 billion in the first quarter of 2024 to finance the deal. Will investors be wary of where we are in the cycle?
The Long and Winding Road
BBB- rated Rogers Communications completed a transaction that will help it reduce debt faster than it had previously forecast. The company has been closely monitored by rating agencies as it takes steps to reduce leverage following its large acquisition of Shaw Communications. Rogers sold its entire stake in Cogeco Inc and its subsidiary, Cogeco Communications, to the Caisse de depot et placement du Quebec. Subsequently, the Caisse sold part of those shares to the public and some back to Cogeco Inc. For BBB- rated Cogeco Communications, the share buyback will result in a modest increase in leverage which prompted rating agency S&P to put Cogeco’s credit rating on negative outlook. Cogeco’s Canadian dollar denominated secured bonds moved slightly wider on this news.
All Star
Outside of the bond markets, Shohei Ohtani inked a smash-mouth 10-year, US$700 million deal with the Los Angeles Dodgers in December. The new deal smashes past his former teammate Mike Trout’s record 12-year, US$426.5 million deal signed in 2019. From our calculations, even with generationally high inflation over the past 4 years, Shohei comes out ahead.
For finance wonks, the interesting part of Ohtani’s deal is how it was structured. The 29-year-old will receive only US$2 million per year from 2024-2033 while playing for the team. He will then receive US$68 million per year in deferred payments from 2034-2043. This structure becomes attractive to the Dodgers in large part thanks to Jerome Powell. Those future payments are discounted into current dollars at the federal mid-term rate, which was 4.43% in October 2023. This brings the payroll hit to US$46 million per year versus US$70 million with no discounting. Back when Trout’s deal was inked in 2019, the federal mid-term rate was 1.51%. At that rate, the same deferred payments in Ohtani’s deal would have cost the Dodgers US$61 million per year.
Hello 2024
Well, the years start coming and they don’t stop coming. We turn to the new year with perspective, anticipation, and cautious optimism. The U.S. economy remains in expansion while Canada is coming off a -1.1% GDP reading for Q3 2023 and may be on the cusp of a technical recession. The frenzy to get invested late last year has dissipated in the first few weeks of January as investors collect themselves. All the while, we continue to have conviction that better credit opportunities are ahead and will remain liquidity driven until we are compensated to assume more risk.
Farewell to a Legend
The investing world lost an icon in November as Charlie Munger passed away at 99 years old. Charlie’s wisdom, market insight and witty quotes will be missed as he truly was an exceptional investor and commentor. It takes an expert to be able to explain complex ideas simply.
Same As Ever
Consistent with years past, we are not in the business of macro-forecasting. Financial writer Morgan Housel released a new book, Same as Ever, where he states, “We tend to be good at predicting the future, except for surprises – which tend to be all that matter.” At Canso, we do not make predictions on where interest rates might go, what inflation might be or what the other investors might do. Instead, we focus on individual companies, the quality of their cash flows, the terms of their bond offerings and the compensation we expect to receive by lending our scarce capital.
We understand markets are cyclical, that credit flows in cycles and that it tends to overshoot to the upside before overcorrecting on the downside. It is true that markets disconnect from fundamentals and can stretch towards extreme values, for extended periods of time. They always have, and they always will. When we don’t believe we are being compensated for risk, we won’t take it. We prefer to protect our capital versus reaching for yield, even if that means missing out on some late-cycle fun.
“It takes character to sit with all that cash and to do nothing. I didn’t get to be where I am by going after mediocre opportunities.” – Charlie Munger