

Dead Wrong Reckoning
Generations of finance students have been taught Efficient Markets theory, but we have always begged to differ. What happened in 2023 to the financial markets and the economy should give anyone pause about how efficient the financial markets really are.
At Canso, we tell our younger staff that markets are aggregates of frail human behaviour and not the impartial arbiters of economic truth and the value of securities as they have been led to believe. Investor psychology and even human physiology, as researched by John Coates, means that there’s no wisdom in investment crowd behaviour. Despite what we think, prices and yields will be set by the most optimistic buyer at a market peak and the most negative seller at the bottom. We also tell our young colleagues that no matter what we think or conclude, the market will do what it wants.
The Recession that Never Comes
2023 is proof positive of the wisdom of our teachings. If the markets had impounded all available information at the start of 2023, the consensus was for recession and dismal financial markets, as it had believed since central banks started raising interest rates in 2022. This is not surprising to us. As the Canadian economist John Galbraith said: “The only function of economic forecasting is to make astrology look respectable.” Defying the collective logic of the professional sages, there was no recession and confoundingly, instead there was a massive rally in stocks and risky bonds. Go figure. As Bloomberg recounted in a year end article, the experts were massively wrong:
“Last year at this time, 85% of economists in one poll predicted a recession this year — and that was an optimistic take compared to the 100% probability of a recession forecast two months earlier… Economists have yet to figure out why things went so well, but it is already clear that a reckoning is due.” 1
Investors Love It, Actually
Long U.S. bond yields peaked in October at over 5% before submitting to a massive 1% rally that took them to just over 4% by year end. This was “aided and abetted” by a Federal Reserve that clearly broadcasted in their dot plots that they expected to lower Fed Funds in 2024. This 1% drop in yields led to a 20% increase in the price of a long Treasury bond. Meanwhile in Canada, long bonds marched to a similar tune, peaking at 4% in early October and tumbling to under 3% to finish off the year. Markets soared and investors roared with delight at the outsized gains of the rally in practically everything.
A Wall Street Journal article headline excoriated those (everybody) who were wrong: “What Did Wall Street Get Right About Markets This Year? Not Much.” The article went on to describe the love that Wall Street had for their unforeseen and bullish reality. As Professor Coates’ research observes, when there’s a lot of money being made, traders are biologically on a testosterone fueled bender and assume massive risks. At the end of 2023, trepidation about interest rates and the economy was out and buying anything and everything with risk attached to it was in. The Wall Street Journal summed it up rather succinctly:
“Yet in the final weeks of the year, euphoria set in when the Fed indicated it would likely shift to trimming interest rates, rather than raising them… An “everything rally” pushed up prices of assets—from gold to bitcoin to risky corporate bonds and investments in far-reaching corners of the stock market. The S&P 500 is poised to end the year on a nine-week winning streak, its longest such rally in nearly 20 years. Bitcoin prices more than doubled.” 2
Taking Stock of Artificial Intelligence
Stocks identified as “AI plays” have soared in the past year. Nvidia was up 239% and Meta was up 194% for 2023. Google, Apple, Microsoft, and many other old school tech companies dominated the stock indices as they gained new life as AI winners. The tech heavy NASDAQ was up 45%, while the lower weights of the AI winners moved up the S&P 500 by only 26% and the stodgy Dow Jones by a mere 16%. The paltry 11% return of the financial and resource heavy TSX paled by comparison.
Frankly, we note that anyone commenting on the financial value of AI doesn’t actually have a clue. A summary of the so-called investment research we have read on the subject is “It is going to be so BIG, BIG, BIG that it changes everything you know about everything you know.” Perhaps, but the cash flows are unknown and indeterminant at this point.
Discounting those cash flows with (k-g) where the growth rate g is higher than the discount rate k leads to infinite prices and wealth, which is what has seized the popular investment imagination. This stock bubble will not end well, as they never do, but its end is not foreseeable nor forecastable. Those riding it will attempt to explain why it makes sense, but in reality, it is pure and utter momentum investing. Enjoy it while it lasts.
Triumphant Workers and Rising Wages
The economists didn’t just get the economy wrong for products and services, they failed to see the economic party spilling over into workers’ pockets, as labour demanded wage increases and got them to compensate them for their loss in purchasing power. While polls are showing blue collar voters supporting Donald Trump, their Republican unfriendly unions have helped them “win bigly.” The Washington Post called 2023 “triumphant” for workers and wages:
“A year that started out with bleak prospects, including a widely predicted recession, shaped up to be a boon for the average American worker — and one of the most triumphant for organized labor in a generation… More than 525,000 workers in the United States walked off the job in 2023, according to Bloomberg Law’s database of work stoppages, making it one of the three biggest strike years since 1990…And hourly wage growth began to outpace inflation this spring after years of falling behind, boosting workers’ standard of living, especially the lowest earners.” 3
Highly Paid to be Wrong
The question, as was asked by the Bloomberg article, is how could so many highly paid economists and market strategists get things so wrong? We believe the answer lies in the amount of money created by central banks during the pandemic.
We also believe that this resulted from central banker hubris. They had massively expanded money supply to remedy the serial financial crises since Alan Greenspan rescued the markets after the Black Monday equity meltdown in 1987. They, and the economic consensus believed, at least until they saw the highest inflation in 40 years, that it did not matter how much money they pumped and primed into an economy.
This is anathema to strict monetarists, who used to include most people working at a central bank. Monetarists believe that it is simply the amount of money that creates inflation. If money supply is expanded beyond what is necessary to support nominal economic growth, then inflation will result.
Commanded to Control
Since money supply had been hugely expanded many times without inflation, central bankers began to believe in their omnipotence and that they could “Command and Control” an economy at will and it didn’t matter how much money they flung at a financial problem. In a generation, central bankers went from the monetarist orthodoxy that “Only Money Matters” to believing that money supply didn’t matter anymore.
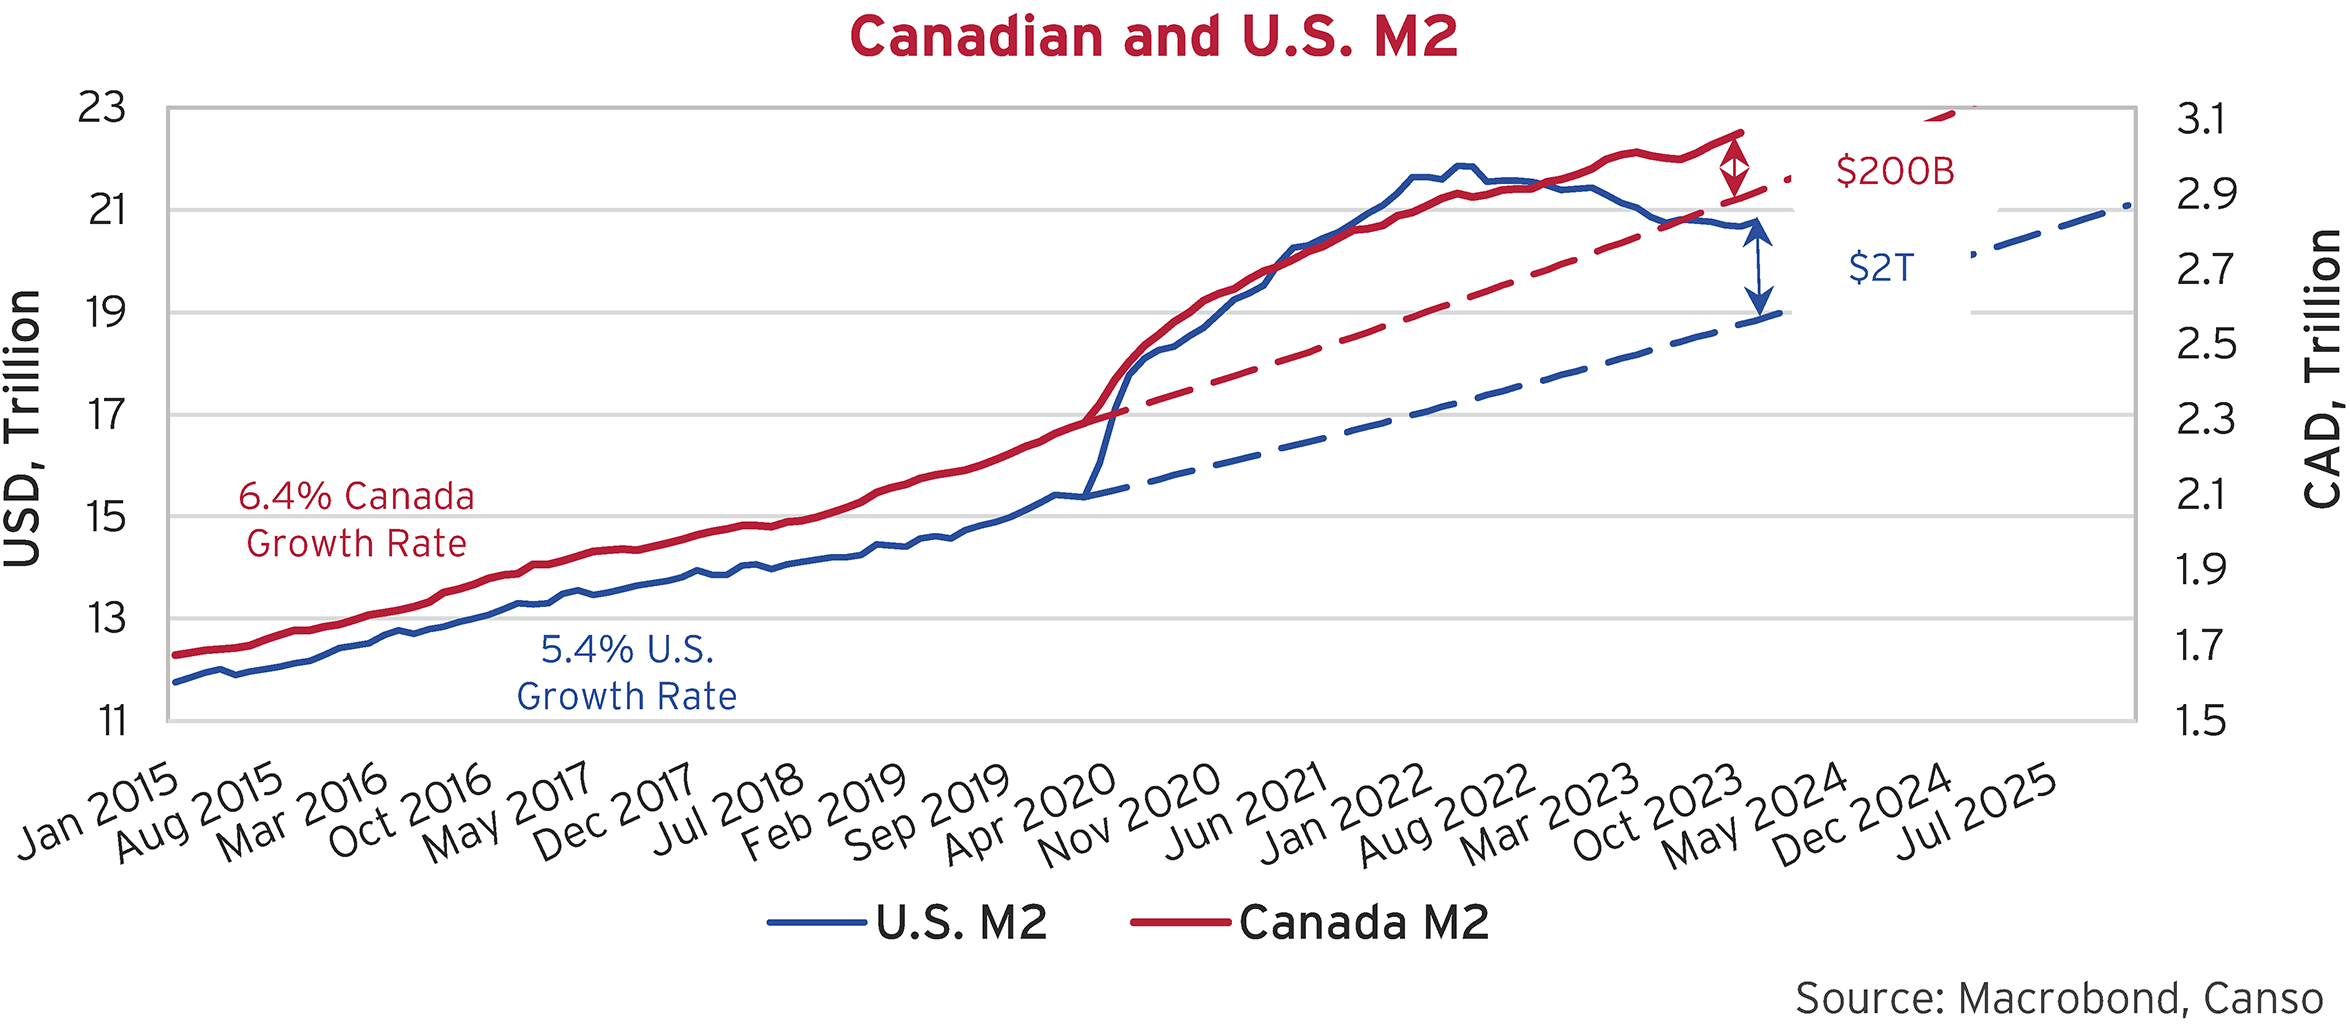
The money supply expansion of the pandemic was the ultimate expression of this belief. The chart below shows U.S. and Canadian M2 expanded hugely from March 2020. This was a combination of “liquidity injection” and “debt monetization.” Liquidity injection created cash in the economy when the central bank bought bonds in the market from private investors and also created borrowing facilities where banks could pledge bonds for cash, thus injecting cash into the financial system. This had happened before, but this time central banks bought up a wide variety of bonds, including junk bonds. This was powerful economic stimulus and was a direct intervention into the credit markets never seen before.
As the chart below shows, prior to this period U.S. M2 had been growing at 5.4% in nominal (actual dollar) terms and Canadian M2 had been growing at 6.4%. We’ve continued these growth rates with the dashed lines and you can see the prodigious growth of M2 above that during the pandemic, in both countries. We’ve also shown the excess level of M2 compared to prior growth rates, which we estimate to be $200 billion in Canada and $2 trillion in the U.S.
Artful Central Bank Dodgers
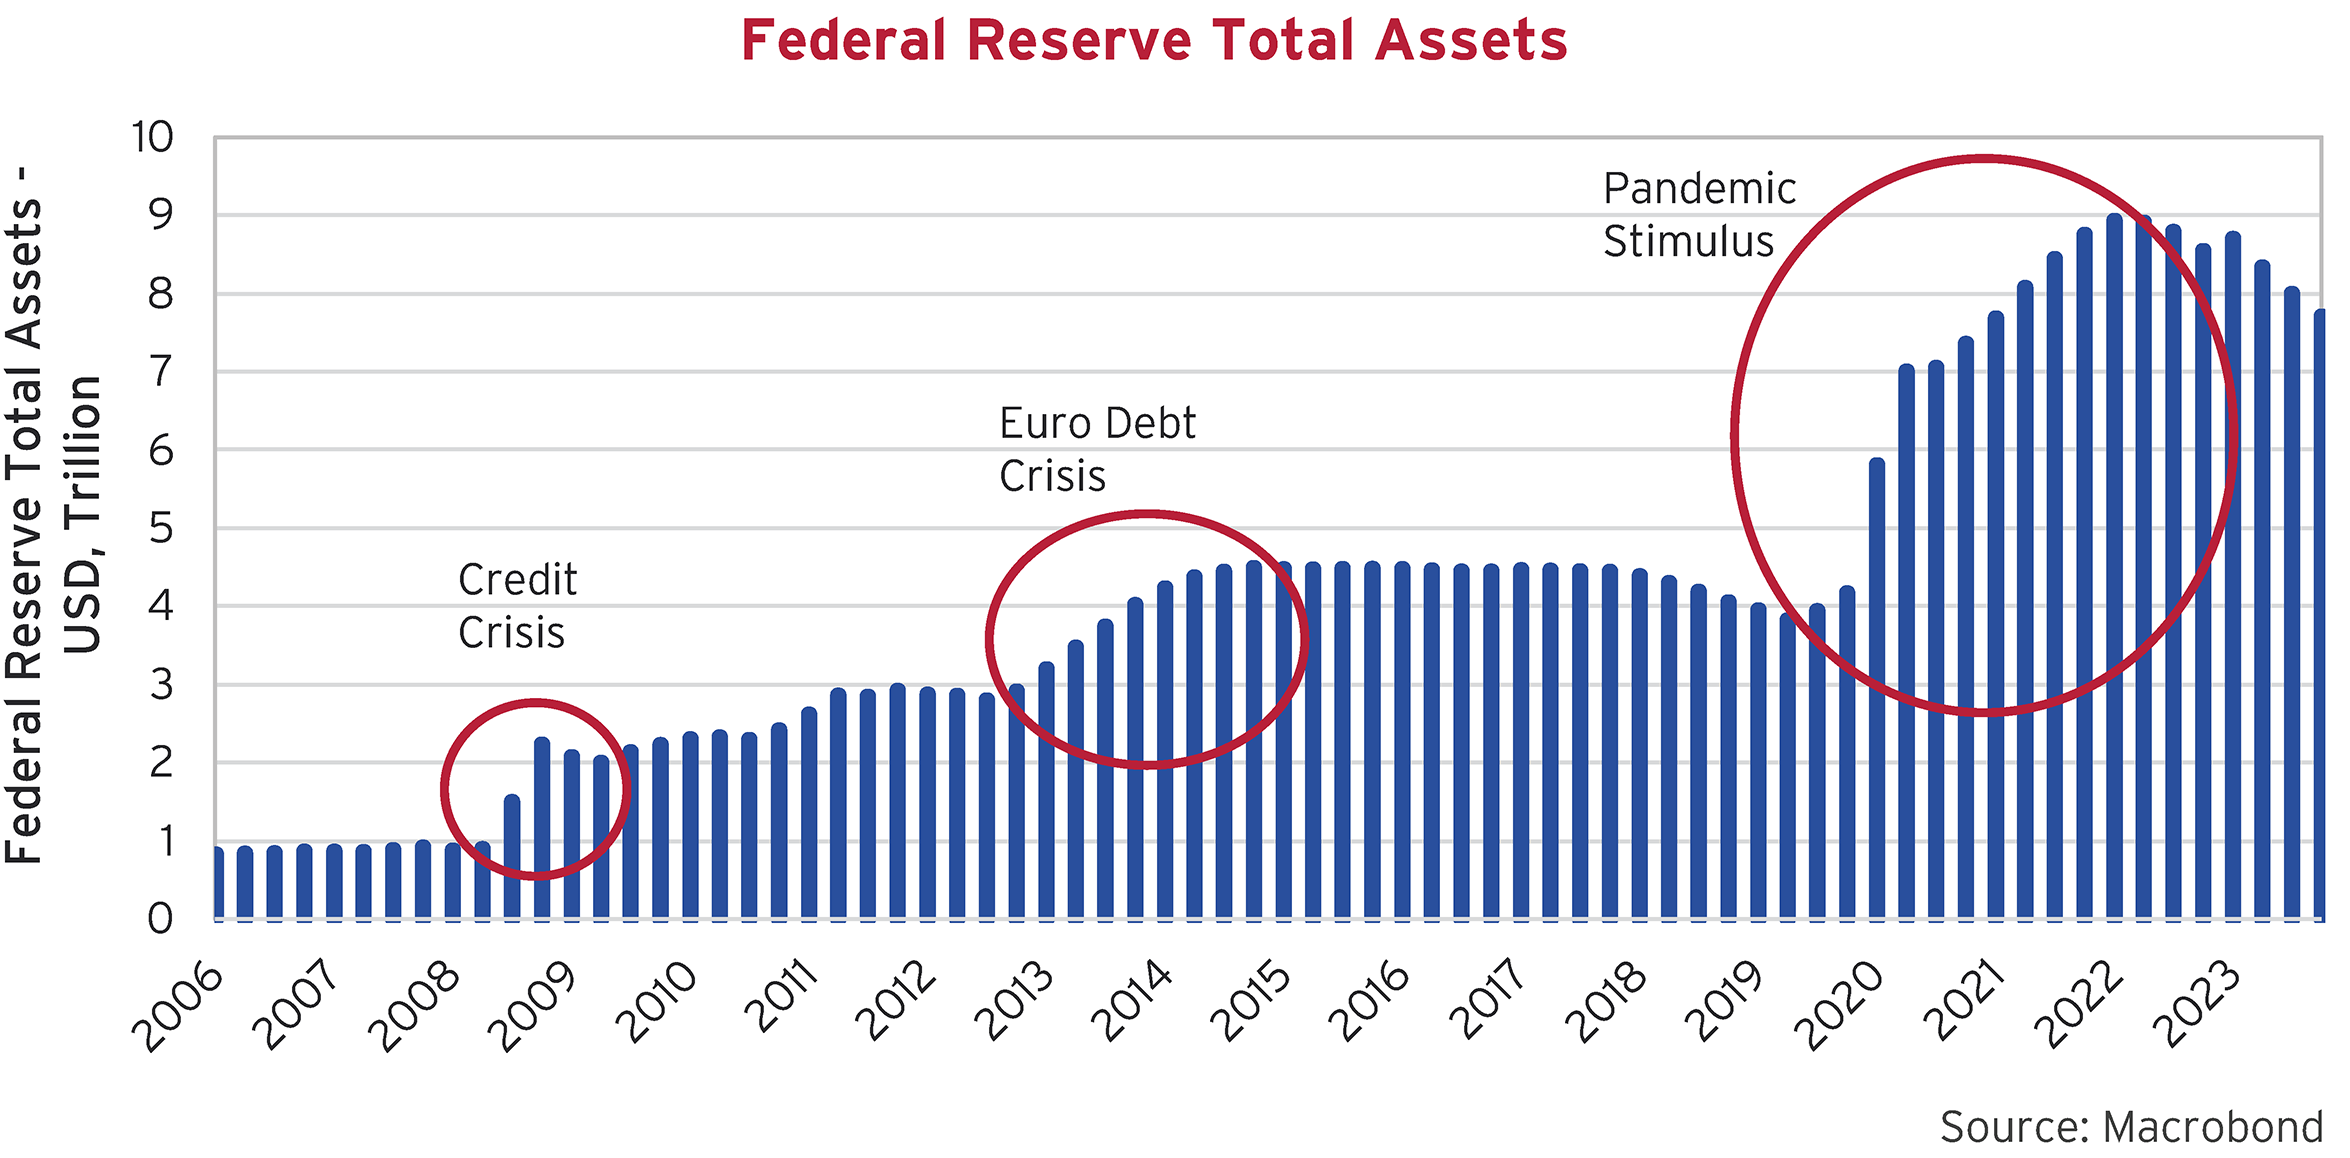
We also saw massive “debt monetization” in the developed world, where central banks bought bonds directly from their governments. This was formerly the purview of the dodgy central banks of Zimbabwe, Argentina, and Venezuela, but now has become part of the developed world central banking playbook.
These transactions directly funded government operations by giving governments cash in return for their bonds. Central bank holdings of government bonds and their balance sheets exploded, with total balance sheet assets of the Federal Reserve growing from $4 trillion prior to the pandemic and peaking at almost $9 trillion in early 2022, as the chart below shows. This was how governments quickly funded pandemic support programs without driving up interest rates. Donald Trump wanted money gifted to voters and even the conservative Republicans in Congress agreed. The debt buying by the Federal Reserve during the pandemic far exceeded what it did during the Credit and Euro Debt Crises, as can be seen in the chart.
Latent Economic Boosters
All that money supported economic activity during the dire parts of the pandemic but it also formed a latent potential boost for inflation, and that is certainly what eventually happened. Despite central bank claims of “transitory inflation” due to supply shocks, the huge boost to money supply eventually ended up as an inflationary shock.
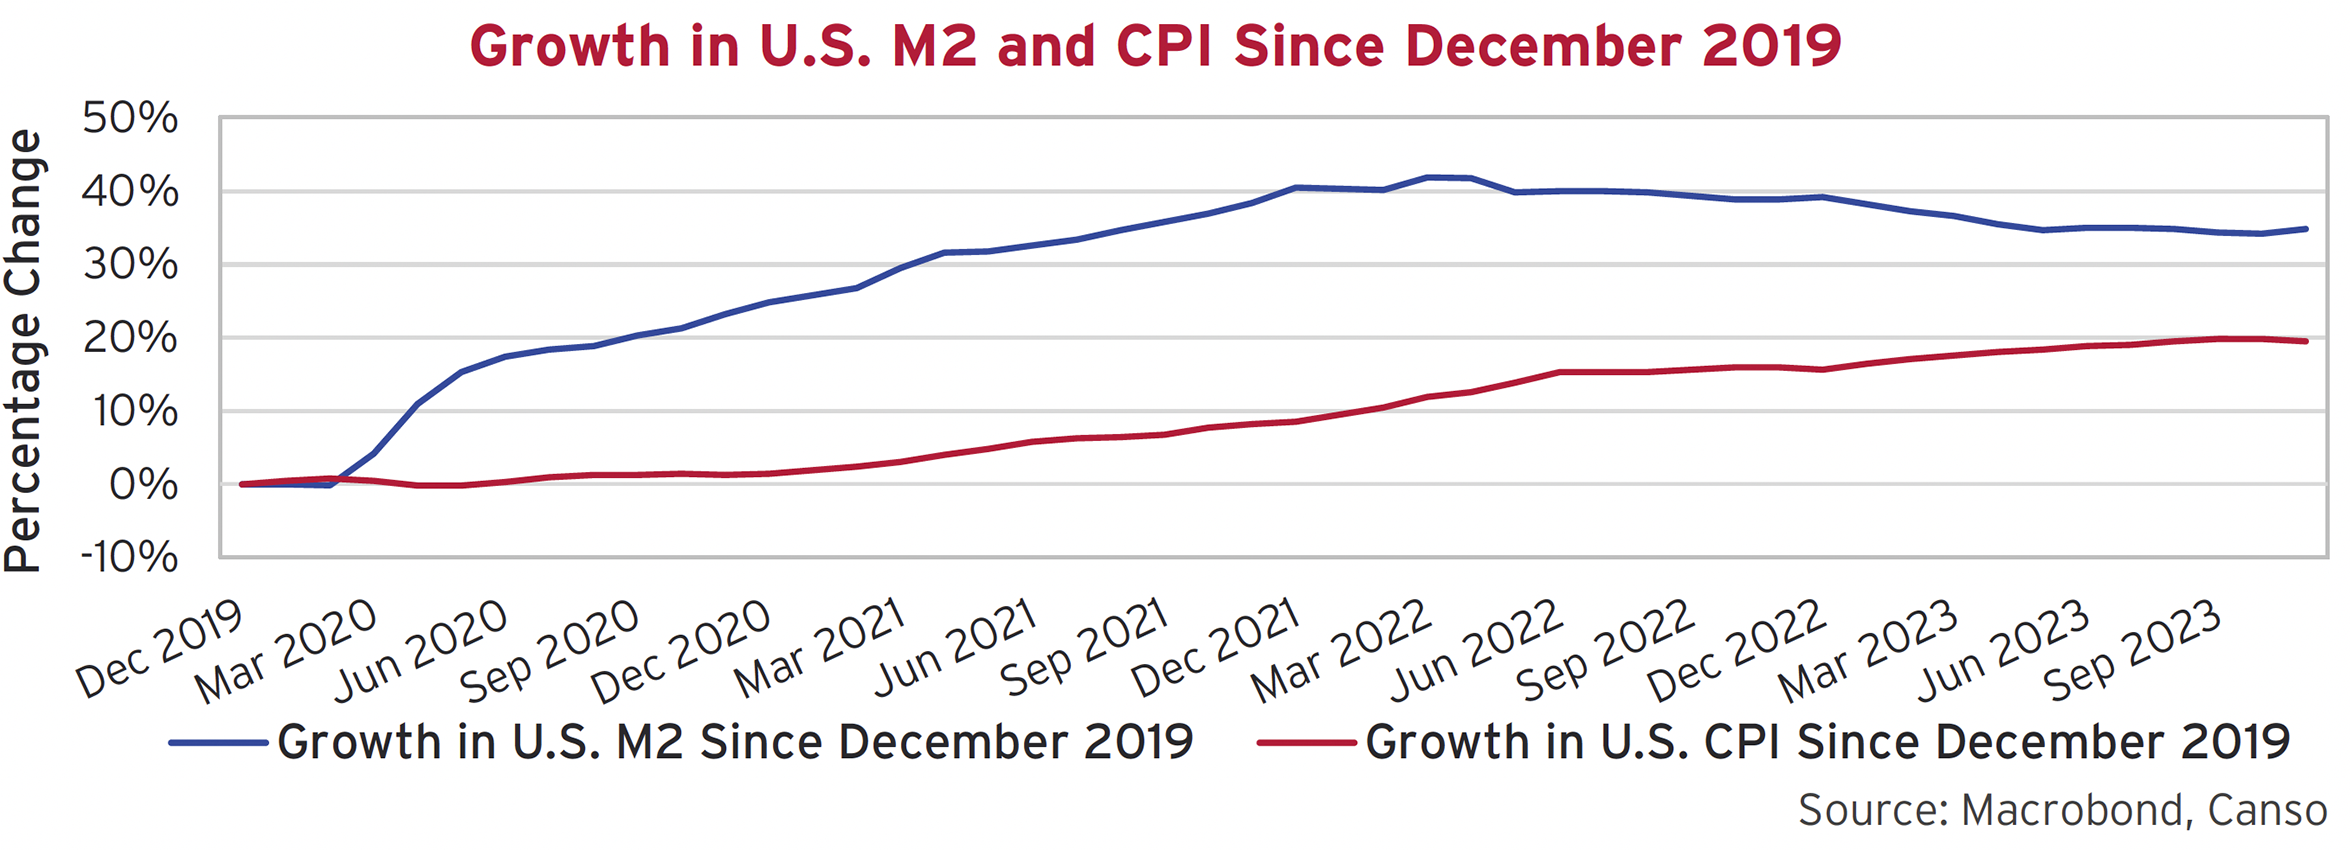
This can be seen in the charts below that compare the changes in U.S. M2 to the changes in the level of the CPI index. The first chart below shows the huge jump in M2 between March 2020 when the pandemic first took hold and March 2022. It peaked at a total increase of 42% that has since dropped to 35%, as the Federal Reserve contracted money supply beginning in early 2022 to raise its Fed Funds rate. Note that this contraction stopped in June 2023 when the Fed decided to “pause” its rate increases.
Feeding the Inflationary Frenzy
All that monetary stimulus took a while to feed through into the CPI index. The chart above shows the cumulative percentage increase in the CPI index has been 19% since December 2019, but this has been quite backend loaded. The chart below shows how little the effect of M2 was on CPI in 2020 and 2021. It took a while for CPI to increase from money supply growth. M2 soared 25% in 2020, but CPI was only up 1% that year. M2 grew 12.5% in 2021 but CPI was up only 7%.
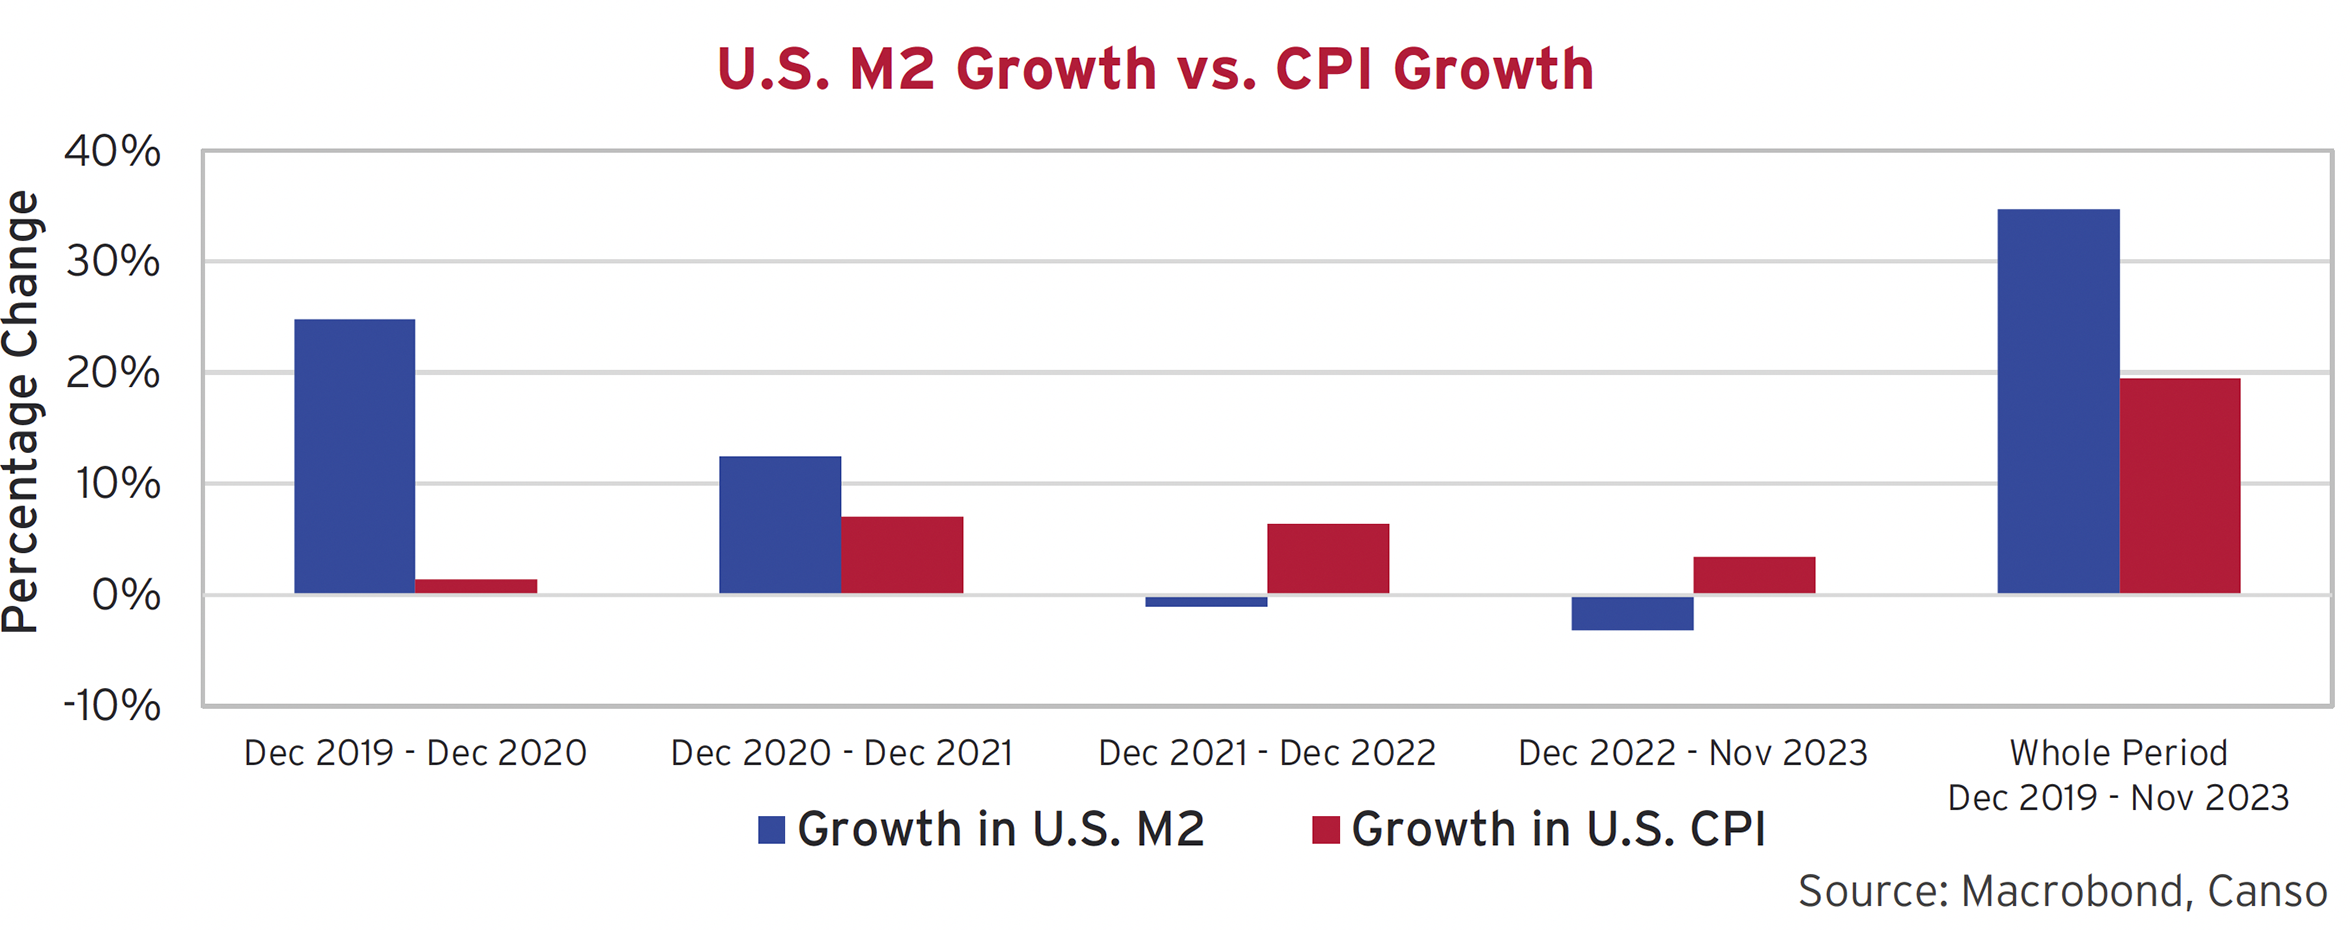
CPI growth of 6.5% in 2022 finally outstripped a decline in M2 of 1% and the year-to-date increase of 3.5% in CPI compares to the -3.1% drop in M2. These differences in the timing of monetary expansion and the lag in inflation/CPI have confounded central bankers and the market alike.
Dot Plot Possessed
Bond traders and portfolio managers are now possessed with the idea that the Fed is done with their tightening campaign. This was surreptitiously and conveniently confirmed in the Fed’s “Dot Plot” projections, which shows the Fed believes they have indeed defeated inflation and it will fall in 2024. Long U.S. Treasury yields peaked at 5.1%. in mid-October 2023 as the chart below shows. They then plunged more than -1% to their year-end level of just over 4%.
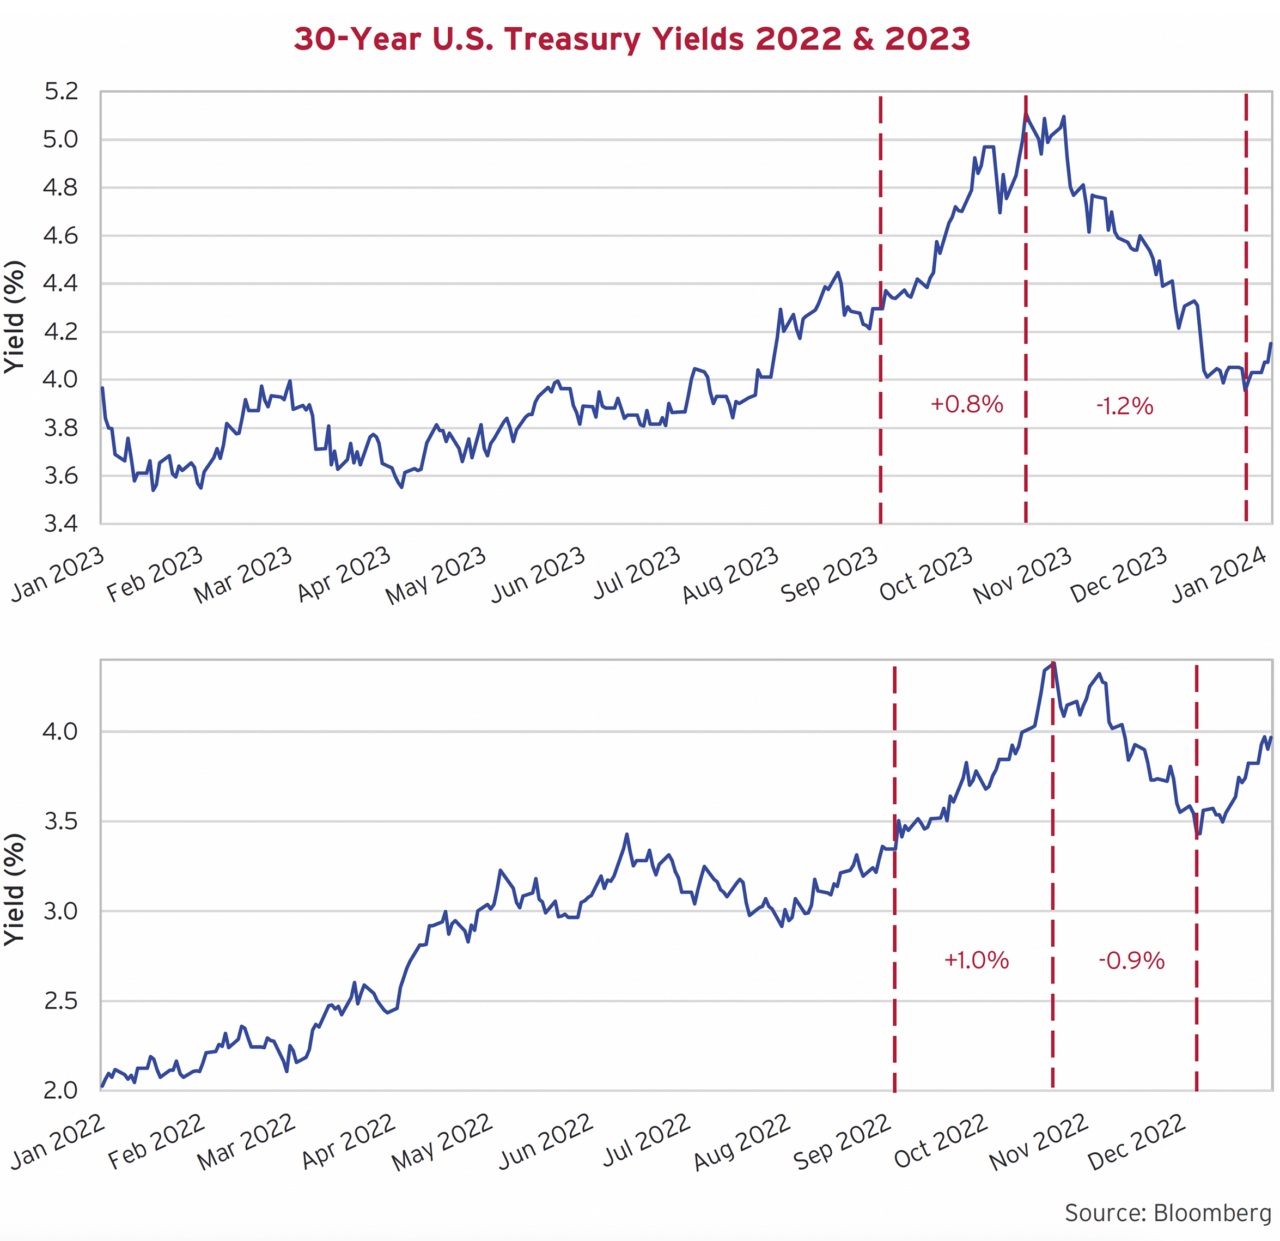
If you’re feeling a strong sense of déjà vu, much the same thing happened in the 4th quarter of 2022. Bond yields rose 1.0% into mid-October on inflation fears and then plunged -0.9% on the optimism that the Fed had finished tightening. The bond market had decided that Fed policy had tightened enough to stop inflation, hence the 100% expectation of economists that there would be a Recession in 2023. The professionals are now forecasting exactly the same thing, albeit a “Recession Light” or more moderate Soft Landing that some are now calling a “Vibecession”, i.e. it feels or “vibes” like recession but isn’t one in statistical terms.
Follow the Fed!!
The sharp drop in bond yields entirely reversed their year-to-date rise in and led to a strong rally in the bond market. There weren’t many bond managers who wanted to “Fight the Fed” and be left behind in a rally, so everyone jumped in. Bloomberg summarized the enthusiasm in the bond market well:
“The world’s debt market is on track to post its biggest two-month gain on record as traders ramp up expectations that central banks everywhere will slash interest rates next year. The Bloomberg Global Aggregate Total Return Index has risen nearly 10% over November and December, its best two-month run in data going back to 1990… jitters around recession risks are still percolating across markets. That’s underscoring the case to own debt, with traders betting policymakers may have to aggressively cut interest rates next year to bolster growth.” 4
Explosive Desire in the Bond Lair
We also tell our younger staff that on slow trading days, the financial reporters at Bloomberg have to dig very hard to find someone for a good quote on the markets. Like investment firms, it is usually the junior people at work in the slow week between Christmas and New Year’s Day. We were therefore very pleasantly surprised to find on Bloomberg the best quote we have seen on the current state of the bond market, by Senior Portfolio Manager, Mr. Hideo Shimomura of Five Star Asset Management from Tokyo. The eloquence of his quote both bemused and impressed us:
“What we are seeing now is a bond carnival,” said Hideo Shimomura, a senior portfolio manager at Fivestar Asset Management Co. in Tokyo. “Bond investors have been hibernating and now I feel that their explosive desire is to come out of their lair.” 4
Bond investors have indeed “come out of the lairs”. Their “explosive desire”, as Mr. Shimomura calls it, has driven bond yields down to the point where the news on inflation has to be spectacular to justify the current low yield levels. As we have said in past editions, it is not yet clear to us that inflation has indeed been defeated but Swap traders are very optimistic:
“Swaps traders are pricing about 150 basis points of rate cuts in the US and UK next year, and around 170 basis points in the euro zone as investor confidence builds that central banks have won their battle against inflation after embarking on the most aggressive rate-hiking cycles in decades.” 4
What is the Real Bond Reality??
As our readers are aware, we do not forecast markets. We price financial assets for a living. Normally, we look at the values of corporate credit and equities. When we value “safe” government bonds, we must look at their yields and their historical valuation compared to inflation. If we look at the yields of inflation-linked bonds, it gives us an idea of the underlying “real” interest rates since investors in these bonds are compensated for experienced inflation by increases in the underlying principal amount of these bonds.
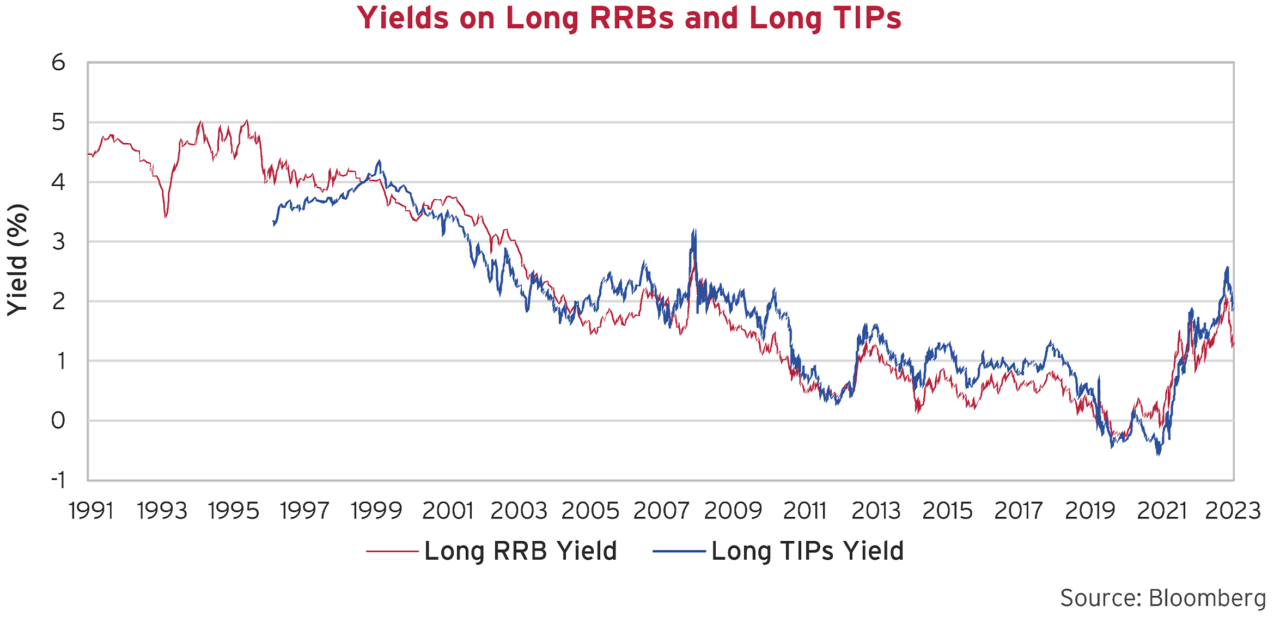
The chart above shows the real yields on the longest Canadian Real Return Bond (RRB) back to November 1991, when it was first issued. The first U.S. Treasury Inflation Protected Security was issued January 1997, and the yield on the longest outstanding issue, is shown since then. As we’ve pointed out in prior newsletters, the real yield of the RRB stayed inordinately high after issue in 1991 at a 4.25% coupon, since the real yield on nominal Canada bonds was also high, as investors worried about a return of high inflation. The same was true of the U.S. TIPs.
RRB real yields follow nominal yields. When it became apparent that the 2% inflation targeting regime of the Bank of Canada was working, yields fell for normal bonds as inflation expectations fell. Real yields dropped below 3% in the early 2000s, as yields fell on conventional Canada bonds. Real yields had dropped to just below 2% just before the 2008 Credit Crisis and then plunged to below 1% during the very loose monetary policy of the Zero Interest Rate period after the Euro Debt Crisis beginning in 2011. That reflected the very low nominal and negative real interest rates on conventional Canada bonds.
Inflation Defeatists
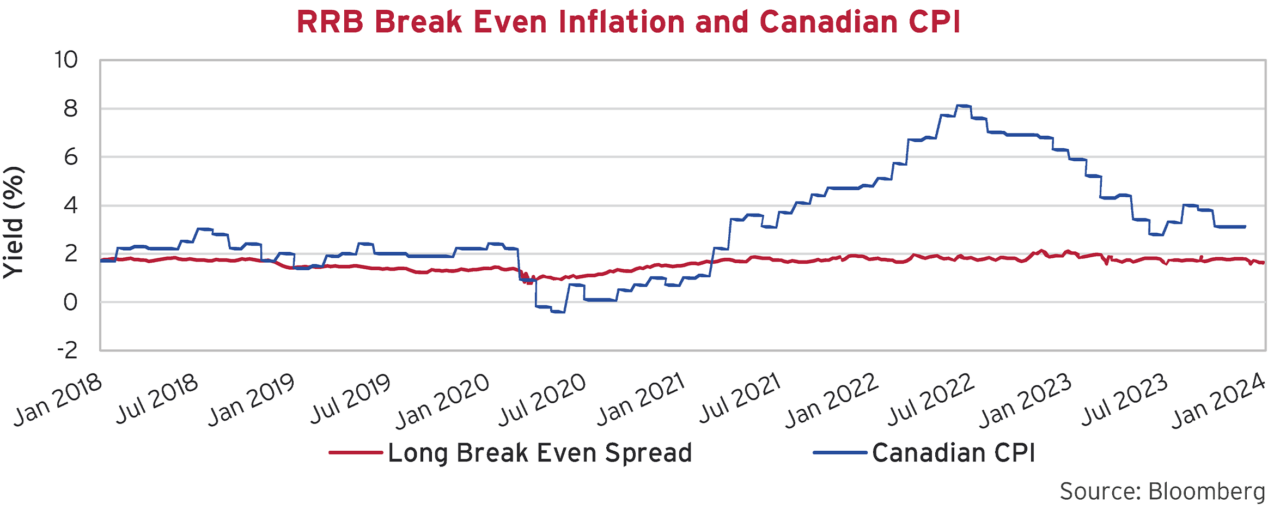
The question for bond yields is very much whether inflation has indeed been defeated. The Break Even Spread (BES) on long RRBs represents the yield difference between nominal (normal) Canada bonds and RRBs of the same term and represents the bond market’s predicted maximum inflation over that term, this is represented on the chart below. The BES is currently 1.6%, just shy of where it was prior to the pandemic in 2018 and 2019. That suggests that the current bond market consensus believes that inflation is under control and we’re back to inflation at or below the 2% target. The blue line on the chart below shows the actual Canadian CPI, which seems to be levelling out in the 3% range, a full 1% above the Bank of Canada target of 2%.
The Lessons of Inflation History
Discussions of inflation, even amongst experts, are rife with wants, prejudices and biases. Expert opinion is coloured by education and employment. Clearly, no Wall Street economist or strategist is likely to predict a coming inflationary Armageddon and recommend selling all the bonds from one’s portfolio. At the moment, there are few calling for caution in the bond market after the powerful rally we’ve just seen.
The chart of the U.S. year-over-year CPI below shows the predicament of central bankers in graphic terms. It shows what happened in the 1970s. Inflation had soared on the 1973 Arab oil embargo from 3% to 12% and then dropped 7% to 5% by 1977. Central bankers eased too early, convinced they had defeated inflation. Considering their job done, the Fed then eased monetary policy and inflation soared to over 14% in 1980 before the Volcker Fed slammed on the monetary brakes and took interest rates to exceedingly high levels, caused a severe recession, and finally defeated inflation.
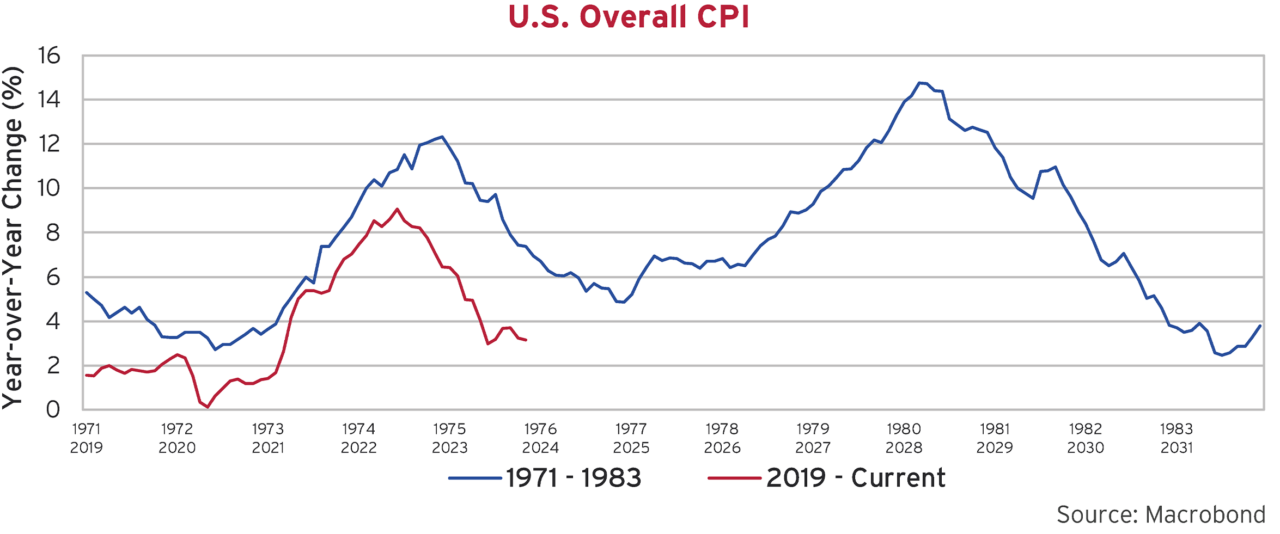
We have overlaid that chart with our current situation. Inflation soared from 0% in 2020 during the pandemic to 9% in 2022. Now that inflation seems reasonable at 3%, there are loud and powerful voices calling for the Fed to relent. Why cause undue economic hardship when you don’t have to???
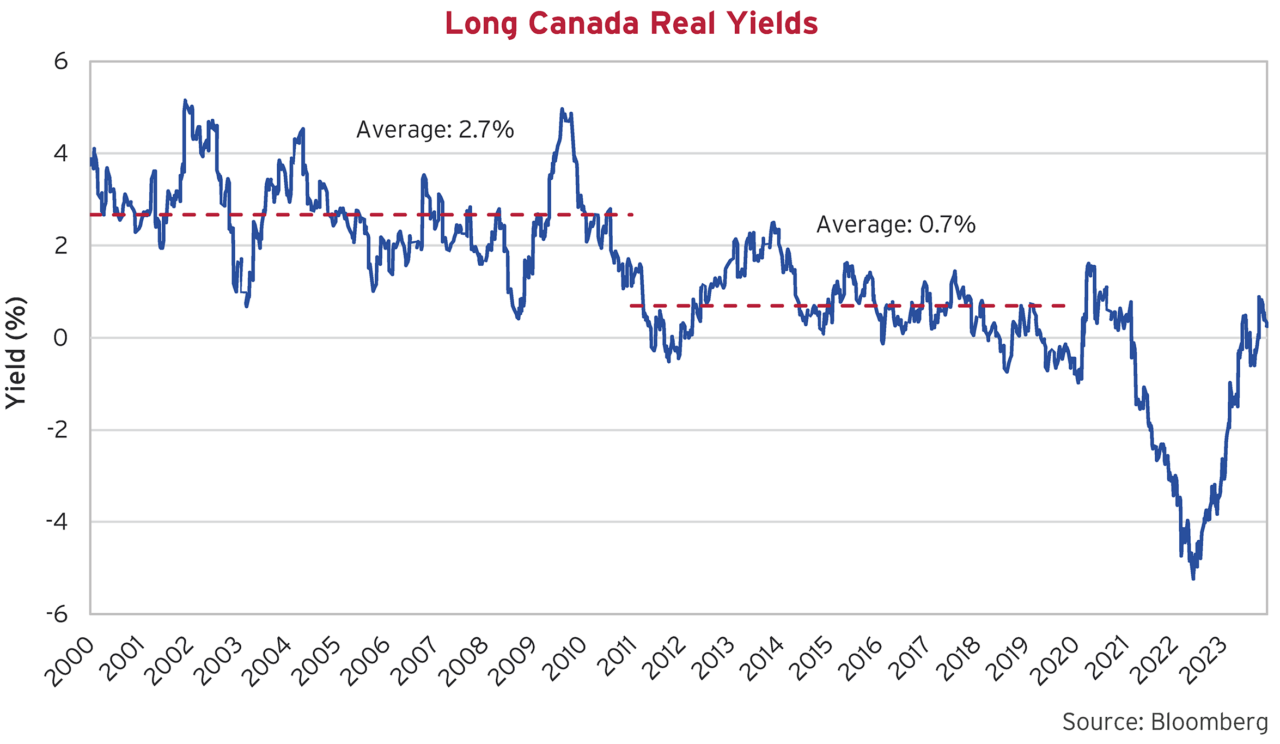
Getting Real on Yields
We now turn to our home market Canada, as we have more robust historical data for this discussion. The real yield of the long Canada bond (yield minus year-over-year CPI) has averaged 2.9% since 1955. The following chart shows a shorter period of the real yield of the long Canada bond since 2000. This shows that from 2000 to 2010, this averaged 2.7%, a bit lower than the 2.9% average over the entire period. Note that during the ZIRP period of extreme monetary ease during the Euro Debt Crisis starting in 2011, the real yield of the 30-year Canada averaged 0.7%. The current real yield on the Long Canada is about 0.3%. In our view, this result from Canadian bond investors believing the extreme monetary ease of the ZIRP period and during the pandemic was “normal” and yields will return soon to the yields during that historically aberrant period. When the 30-year Canada yield fell to 2.9% in very late December 2023, that was a 0.9% real yield level, assuming an immediate drop to 2% inflation. This is perhaps reasonable compared to the 2011 to 2019 low real yield period of ZIRP, but it was expensive for the higher real yield period of 2000 to 2010.
Throwing a Yield Curve Ball
We now turn to a comparison of the year end yield curves since 2020 and at the peak of rates in October 2023. This shows that yields rose generally from 2020 to their peak in October 2023. It also shows that yields were lower in December 2023 than in December 2022, except for terms below 1 year.
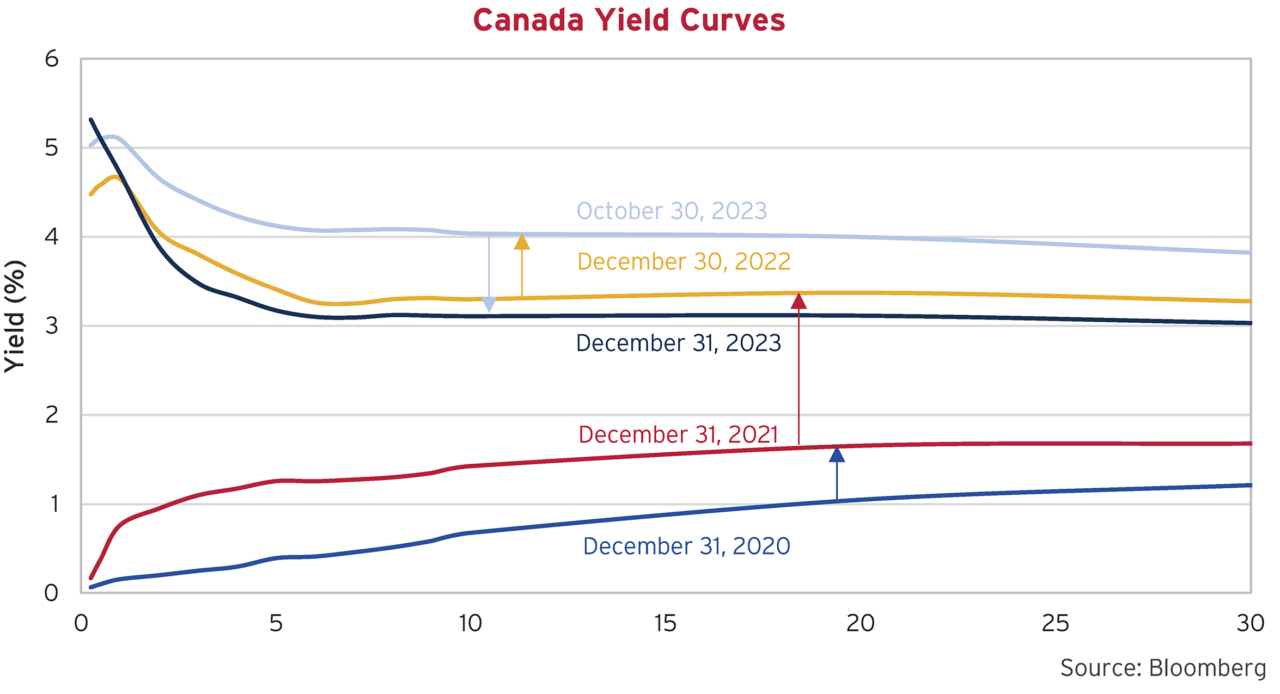
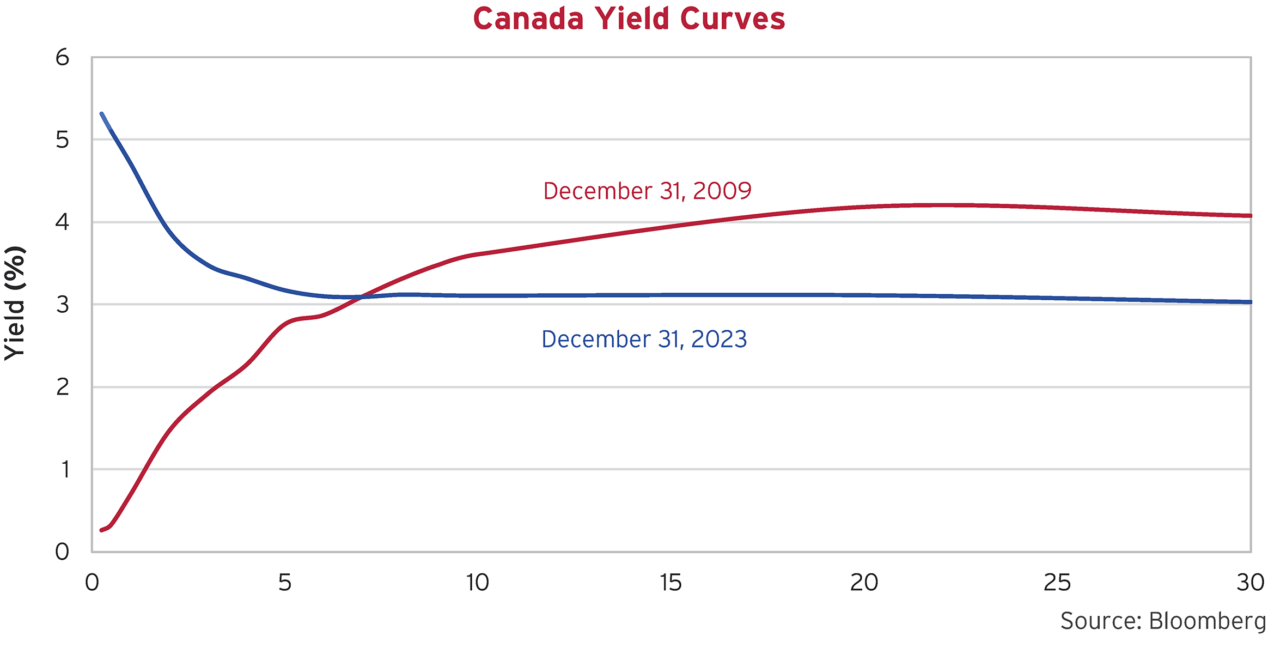
We find a comparison of the December 31st, 2009 yield curve to this past December 31st, 2023 very interesting. It shows that yields were lower in December 2009 than December 2023 in bonds shorter than 7 years and considerably higher for longer term bonds, a full 1% higher for 30-year Canada bonds.
The chart below of Canadian inflation since 2007 shows why this is relevant to our discussion. In the 5 years from before the Credit Crisis in 2007 to 2012, the CPI predominately ranged between -1% and 4%, averaging 1.9%. This included the period of almost -1% deflation in 2009, immediately preceding the December 31st yield curve we’ve shown.
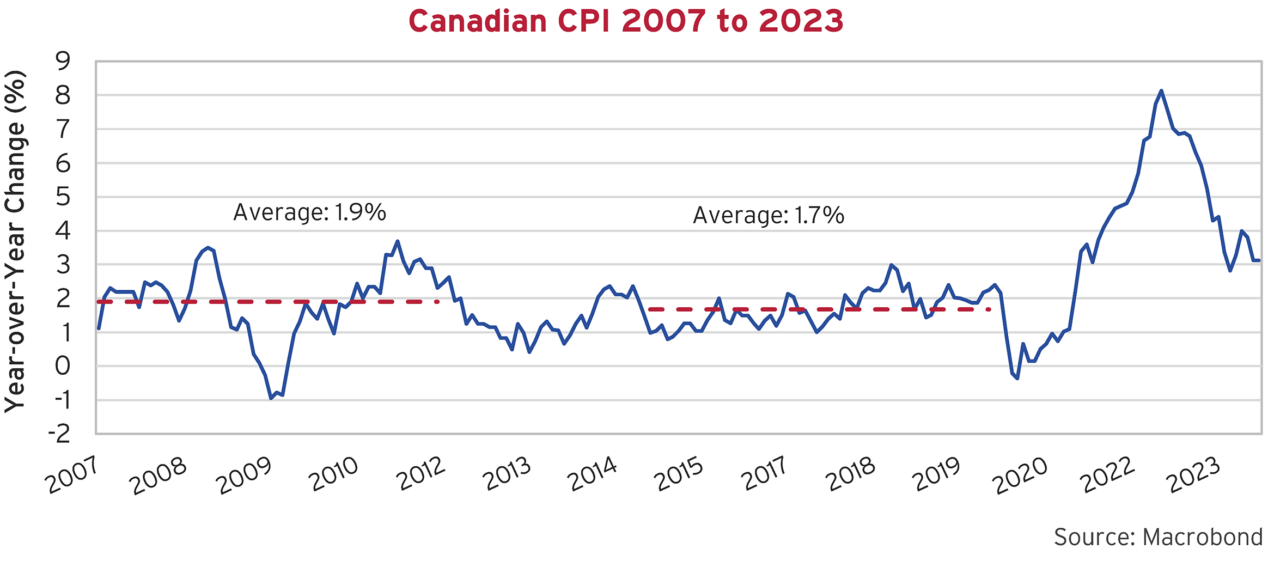
This compares to the period from 2014 to 2019 before the pandemic when inflation ranged from 0.8% to 3% and averaged 1.7%. It excludes the brief period of -0.4% deflation in 2020 but also excludes the extensive period after 2021 when the CPI was well above 3% and peaked at 8% before returning to the current 3.1%.
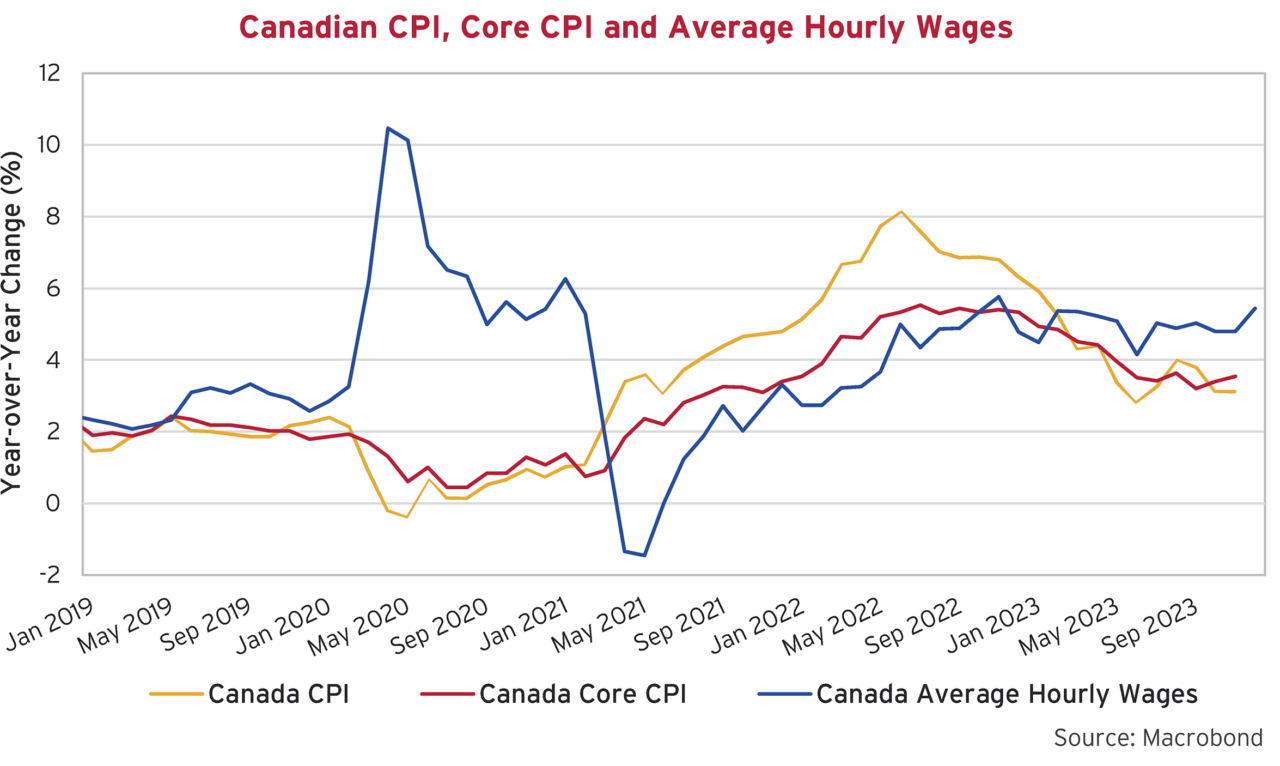
The chart below shows why the enthusiasm for low inflation should be tempered. As we’ve seen from the Break Even spreads, the bond market has already impounded a return to better than 2% inflation but the decline in overall CPI and Core CPI seems to have stalled out at the 3% level. More problematic is the increase in Average Hourly Wages, coming in at well above 4%. In the spending field of dreams, if you earn it, you can spend it.
From our point of view, the deflation in 2009 after the Credit Crisis was far more severe than any economist is now predicting for 2024. So why are long-term Canada bond yields lower now than back then? As Mr. Shimomura says, it could be that Canadian bond investors have come out of their lairs with explosive desire to not miss a bond rally.
Not Giving Credit Its Due
In terms of corporate bonds, we are very wary of the huge rally in credit spreads and we are selling into the very strong bids that we are seeing for things we acquired cheaply during and after the pandemic. We are in our portfolio phase of not assuming uncompensated risks. The chart below shows why. We believe the scramble to “get invested” has resulted in too much narrowing of credit spreads and the rewards from lower quality credit do not justify the risk assumed. The charts explain our risk aversion well.
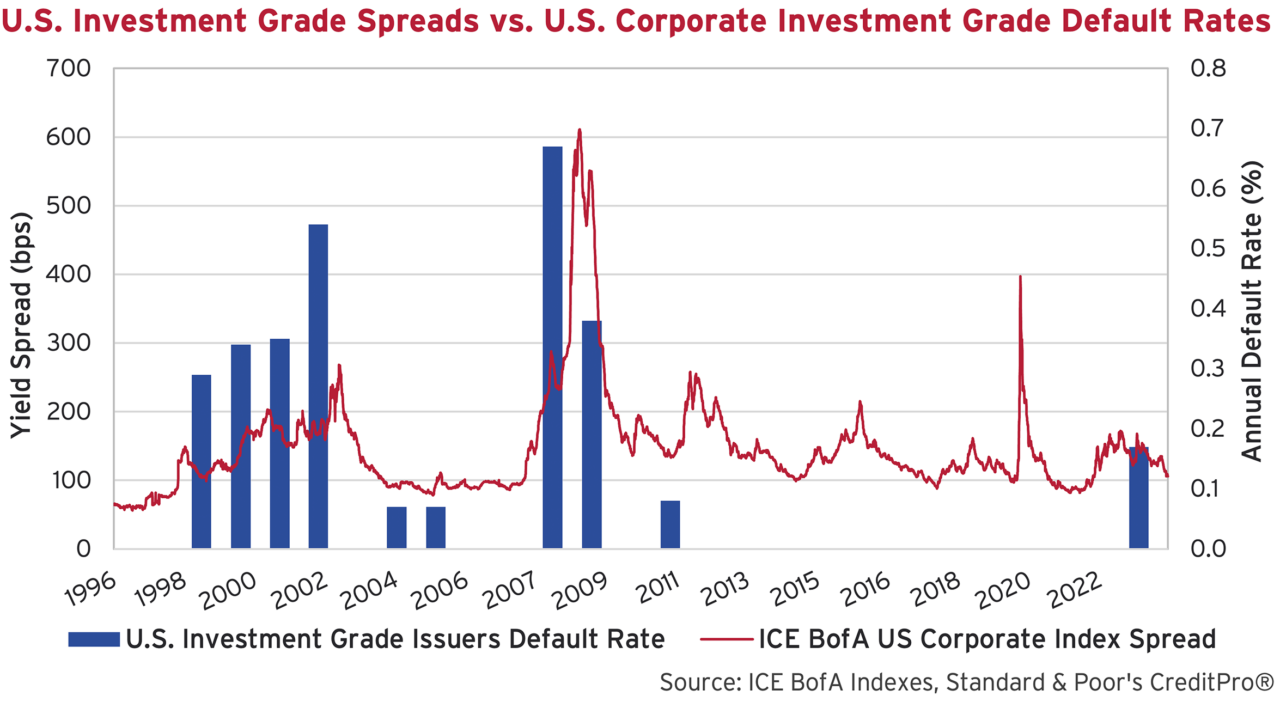
The first chart of U.S. Investment Grade spreads and defaults shows that wider spreads follow periods of higher defaults. Defaults had been historically low during the ZIRP period and have only recently started to rise. Clearly, as the graph shows, it was very hard to actually default during the easy money period from 2011 to 2019. We think easy financing terms and low yields kept a lot of dodgy companies afloat that would have otherwise defaulted.
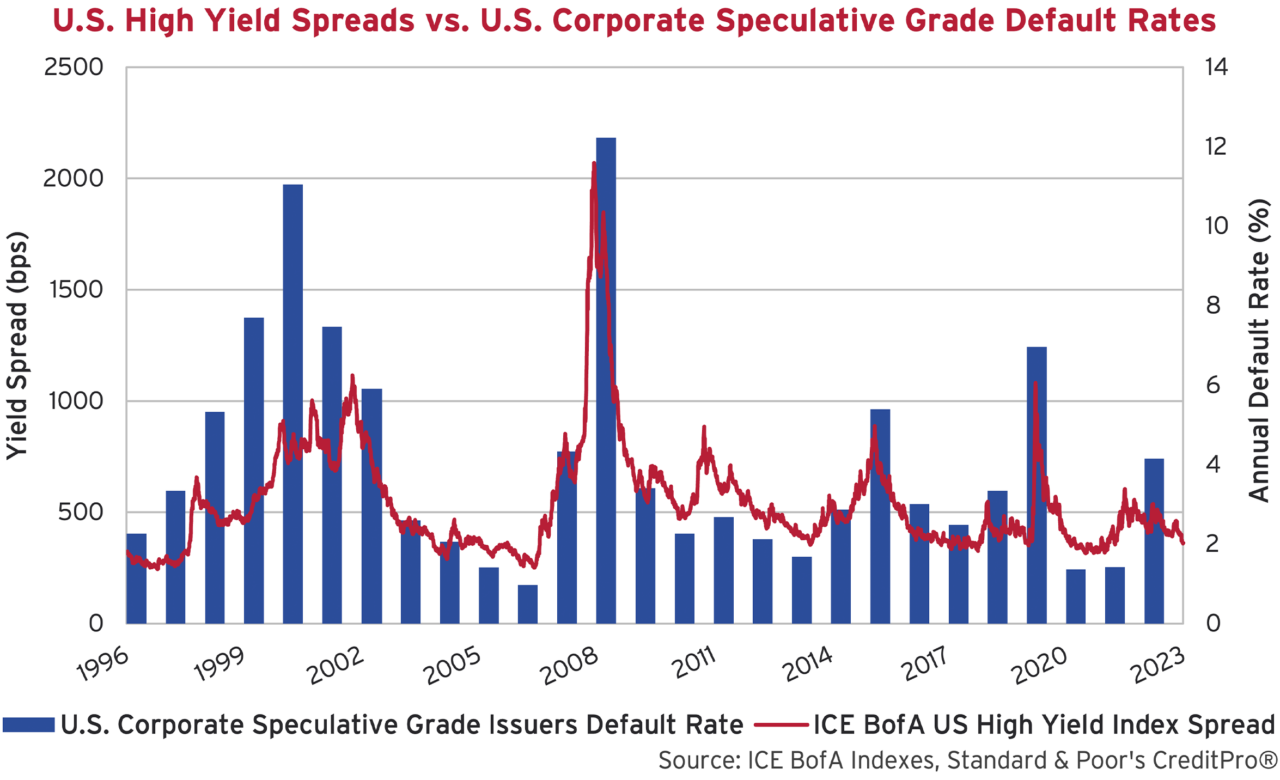
Not High on High Yield
The second chart of U.S. High Yield spreads and issuer defaults shows more clearly that defaults and wide spreads are almost coincident. Higher spreads coincide with higher defaults. From our point of view, the very procyclical relationship of wider credit spreads and defaults argues for caution at this point in the credit cycle. We think this reflects the tendency of bond portfolio managers to avoid further risk when they are experiencing defaults in their portfolios. Recently, we have seen lower credit spreads with higher defaults in speculative issuers, against the historical trends. That suggests a lack of caution from investors in these issues.
Contrarily, we prefer to wait for better opportunities in the credit markets. It won’t take much for the ebullience in the financial markets to fade in 2024 and we are willing to wait.
The Explosive Desire for Equities
The prospects for equities are interesting. The current mania over Artificial Intelligence (AI) has grasped and fascinated the popular media, as happens with all major technological advances. Humans are wired with imagination and the yearning to belong and believe. When there is money to be made in a stock boom after great technological change, these combine with the FOMO (Fear of Missing Out) and greed to create massive financial rallies.
What Mr. Shimomura calls “Explosive Desire” in the bond market has confounded the economic experts for as long as there have been organized financial markets. Economist John Maynard Keynes called it “Animal Spirits.” Federal Reserve Chair Alan Greenspan called it “Irrational Exuberance.” Finance professor Robert Shiller wrote a book on it in 2010 after the Credit Crisis called Animal Spirits: How Human Psychology Drives the Economy, and Why It Matters for Global Capitalism.
Archeologists and historians date organized financial markets to the dawn of human civilization, so that’s a very long time. The book Extraordinary Popular Delusions and the Madness of Crowds was written by Charles McKay in 1841 and featured the “economic bubbles” of the French Mississippi Company and British South Seas Company stock bubbles of the early 1700s and the Dutch Tulip Bulb mania of the early 1600s.
It is natural for massive technological leaps to power huge waves of stock speculation. Charles Mackey wrote about the technological miracle of railways and that stock boom when he was a newspaper reporter in Scotland. Speculation is chasing untold riches like young men with no mining experience going off to find their fortunes in a Gold Rush. That differs from investment, which is judiciously deploying capital to achieve investment profits and returns. We are now at the stage of the Artificial Intelligence equity boom that the promise of untold riches has come true for some stock speculators, without many of the actual companies involved making any actual profits yet. Those making the powerful processors necessary for AI have profited, but others are seeing their stock price soar on AI potential. Someone will eventually make money from AI, as was the case with the internet after the Dot.com stock boom and radio after the 1920s stock market mania, but it will take a while.
As we frequently point out on these pages, nobody knows the future. It now seems that professional economists and strategists don’t even understand what is going on, but that is normal. Economists and historians seek to explain what has happened, and a recent paper points out that they currently aren’t even sure what happened in the Great Depression of the 1930s. A good Opinion Piece by Aaron Brown in Bloomberg discusses the wide range of attributed causes for that Depression in contemporary college text books in the paper “Teaching the Causes of Great Depression to College Students: Evidence from History, Economics, and Economic History Textbooks,” (Journal of Economics and Finance Education). He also summarizes our current market situation very well:
“This matters because we are undergoing an economic transition that might be comparable in magnitude to the 1930s. The economic consensus that produced the “Great Moderation” was smashed by the financial crisis in 2008. But unlimited monetary and fiscal stimulus seemed to solve economic problems up to and including pandemic disruptions — mysteriously not bringing the inflation conventional wisdom predicted. Inflation returned in 2022 in a painful way and, although it appears to be under control now, few are confident we understand it.” 5
We are completely and utterly confident that we only understand a small part of what is going on. Despite this, we have our portfolios to manage, but our valuations to guide us.
Not Hurried but Surely Worried
As professional investors, we point out that money cannot be deemed scarce or monetary policy tight when a massive stock and credit bubble is underway. As we’ve told you, few forecasters believed the economy would escape recession in 2023 and absolutely nobody predicted the massive rally in the equity markets. There are few forecasts of recession or difficult financial markets in 2024 after the ebullience seen during year-end 2023, and that has got us worried.
For now, we continue to improve the quality of our portfolios and wait on the sidelines of the current financial mania. Call us irresponsible for not rushing into financial danger, but that is our steady and disciplined investment creed. We need to be compensated for the risks we take in our portfolios, not promised riches beyond belief by someone looking into their market crystal ball.