

“Money Printer Go Brrr”
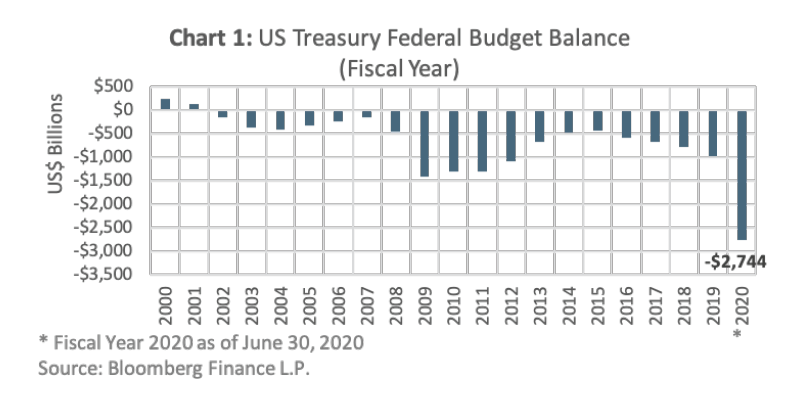
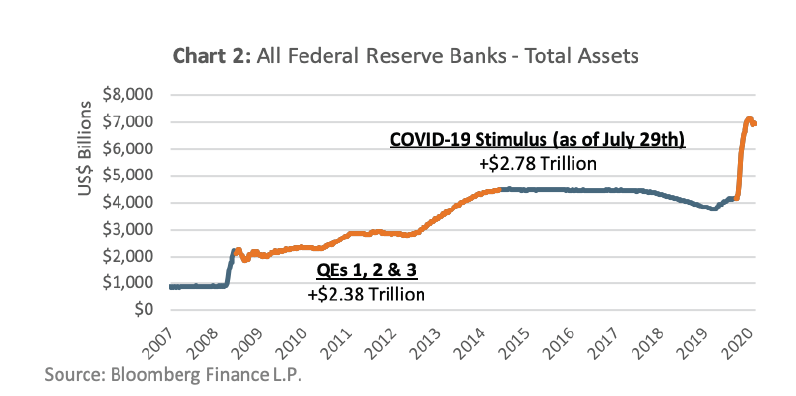
In response to the COVID-19 pandemic, governments and central banks have created record amounts of cash via fiscal and monetary policy. The amount of money created has been so extreme that a popular catch phrase about the Federal Reserve money printing has become a hit on the internet. As shown in Chart 1, the year-to-date 2020 fiscal US federal budget deficit is by far the largest it has been in the past 20 years, and almost double what it was following the 2008 financial crisis. This can largely be attributed to the US$2.2 trillion CARES Act, which was passed by the US government to provide COVID-19 related economic relief, including so-called “helicopter money”, the practice of governments giving cash directly to the population. Furthermore, as shown in Chart 2, the Federal Reserve has adopted a European Central Bank style “whatever it takes” approach to providing liquidity to the capital markets, having grown its balance sheet by US$2.78 trillion since mid-February 2020, which is more than the cumulative balance sheet expansion from the three quantitative easing programs over the years following the 2008 financial crisis.
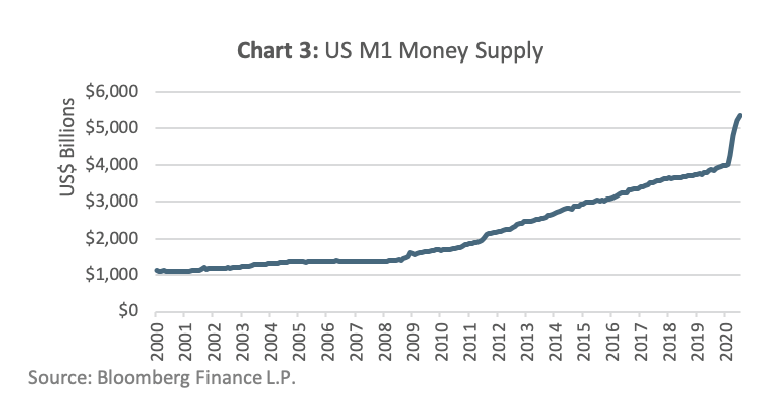
One of the intended consequences of the US fiscal and monetary stimulus was to increase the supply of money in the US economy, as measured by M1¹ (Chart 3). Now at a level of over US$5trillion, the speed at which M1 increased is truly remarkable, especially compared to recent history. Consider the number of months it took to add US$1 trillion of M1 historically:
• US$2T-to-US$3T: 43-Months
• US$3T-to-US$4T: 60-Months
• US$4T-to-US$5T: 3-Months
Preparing for Inflation
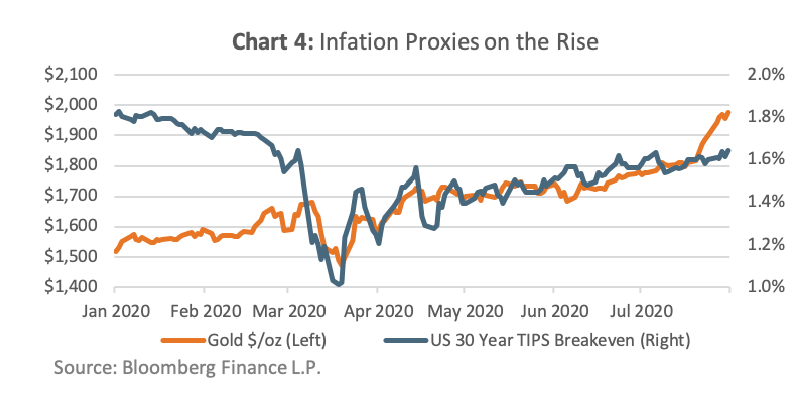
As the money supply increases, so should inflation – which is a general assertation of some economic inflation models. It also seems to be the expectation of the gold market and 30-year Treasury Inflation Protected Securities (TIPS). Gold, a widely recognized hedge against inflation, has seen its price increase 34% as of July 31st, 2020, from its mid-March low. TIPS are US treasury securities that adjust to the level of inflation, and their “breakeven spread”² is the annual inflation expectation that is priced into the security. As of July 31st, 2020, the 30-year TIPS breakeven spread has increased by 0.63% from its mid-March low. Despite the stimulus catalysts and market expectations for greater levels of inflation, the COVID-19 pandemic has left a wake of deflationary pressure across the US economy and a corresponding disinflationary trend for US CPI inflation. Year-over-year, US CPI inflation as of June 2020 came in at readings of 0.6% and 1.2% for headline and core³, respectively, and are down from readings of 2.3% and 1.3%, respectively, at the end of 2019. With that in mind, investors could rightly be asking: when will higher inflation levels be reflected in the CPI numbers?
Demanding Inflation
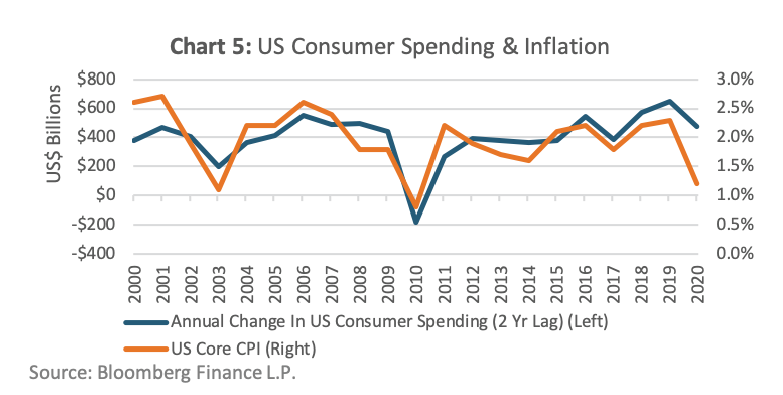
At a high level, inflation is a result of higher prices due to changes in supply and demand factors across an economy. Forecasting inflation can be a complex process, however, to identify a key driver of inflation, a logical starting point could be to look at the largest component of demand in the US economy – the US consumer. Chart 5 shows the relationship between two-year lagged changes in US consumer spending and US core CPI inflation. An interesting observation is that over the past 20 years, the calendar year change in US consumer spending (lagged two-years) and the calendar year change in US core CPI inflation has shown a correlation factor of 0.80. Simply put, it means there has been a strong historical relationship between changes in US consumer spending and future core CPI inflation.
Conclusion
With the massive amounts of cash in the US economy, certain assets are repricing with the expectation of greater future inflation. While there are many factors that can impact inflation, the level of US consumer spending has shown to be a strong driver of inflation over time. With the recent dramatic declines in US consumer spending in March and April 2020 (-US$999 billion and -US$1,790 billion, respectively), it is no wonder there is deflationary pressure in the US economy. However, US consumer spending rebounded in May and June 2020 (+US$1,025 billion and +US$738 billion, respectively), and should we see a continued return of consumer confidence, that, combined with the massive amounts of cash in the US economy, could be the perfect recipe to realize higher levels of CPI inflation in the future.
The implication for investors is that they should have a clear picture of the inflation sensitive components in their investment portfolios and ensure they would not be unduly impacted by higher inflation down the road. One inflation-sensitive asset class of note is fixed income, where higher inflation generally leads to higher interest rates. In that case, investors should understand their exposure to interest rate risk (i.e. duration), and what impact rising interest rates would have on the value of their investment portfolios.
¹According to the Federal Reserve Bank of St. Louis, M1 money supply consists of currency outside the U.S. Treasury, Federal Reserve Banks, and the vaults of depository institutions; traveler’s checks of nonbank issuers; demand deposits; and other checkable deposits.
² TIPS breakeven spread is calculated by subtracting the TIPS yield from a nominal US treasury yield of similar term.
³ Core inflation excludes the energy and food components of inflation.