

The Great Divergence
The current relationship between the S&P 500 and US economy can be characterized as bipolar. In the second quarter of 2020, the S&P 500 rallied by 20.5% and its forward P/E ratio (“P/E ratio”) expanded by 7.8x to a level of 24.9x, a level not seen since the tech bubble of the early 2000s. Meanwhile, GDP in the second quarter of 2020 is forecast by Bloomberg to contract by a whopping 34.5%, a quarterly contraction if realized, not seen since the Great Depression, and that on the back of a 5.0% contraction in GDP in the first quarter of 2020.
Chart 1 illustrates the relationship between quarterly US GDP changes and quarterly expansions in the P/E ratio of the S&P 500 over the past 20-years as of Q2 2020. To give better context to how much the S&P 500 has disconnected from economic fundamentals, consider that over the past 20-years prior to Q2 2020, the S&P 500 P/E ratio expanded in only two of the twelve quarters that US GDP contracted; the last highest P/E expansion during a GDP contraction was 2.0x.

Upside Capture Versus Downside Avoidance
A justification for such a lofty S&P 500 valuation given the dire economic circumstances is that the stock market is forward-looking, and the contraction in economic output and corporate earnings is temporary and should soon normalize, the key unknown variable being the speed, or shape of the recovery, often referred to by “the letters” (i.e. V-shaped, U-shaped, L-shaped, W-shaped, etc.). A V-shaped, or quick recovery would likely push the equity market higher, as larger earnings would leave room for equity prices to rise higher while maintaining the prevailing P/E ratio. However, an L-shaped, or more protracted recovery could cause a contraction in the P/E ratio, and consequently lower equity prices.
As no one can say for certain what shape an economic recovery might take, a challenge facing investors today is the tradeoff between positioning portfolios to capture the potential upside of a quick recovery versus positioning that avoids the potential downside of a more protracted recovery. High yield bonds is an asset class where investors could get the best of both worlds.
High Yield Bonds: A Less Volatile Equity Proxy
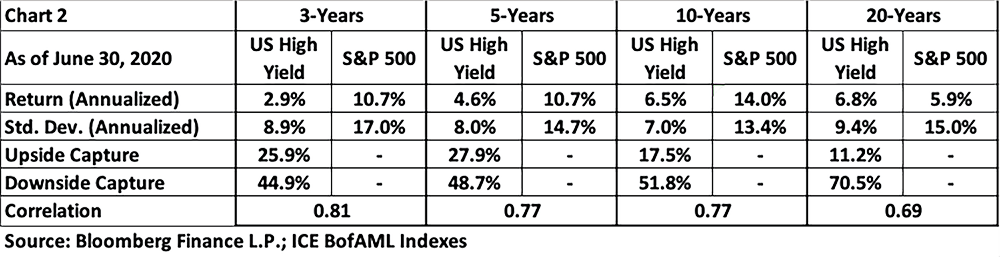
Over time, high yield bonds have consistently shown to be a less volatile proxy to the S&P 500, as illustrated in Chart 2. In all periods, high yield bonds displayed moderate-to-high correlation to the S&P 500, with considerably less volatility (standard deviation) and less downside capture. While the benefits of “upside” volatility are evident from the S&P 500 outperformance over 3, 5 and 10-year periods, the avoidance or mitigation of drawdown periods is the secret to earning long term alpha in an investment portfolio, and it is a key factor behind the high yield bond outperformance of the S&P 500 over the 20-year period.
Tracking Relative Value
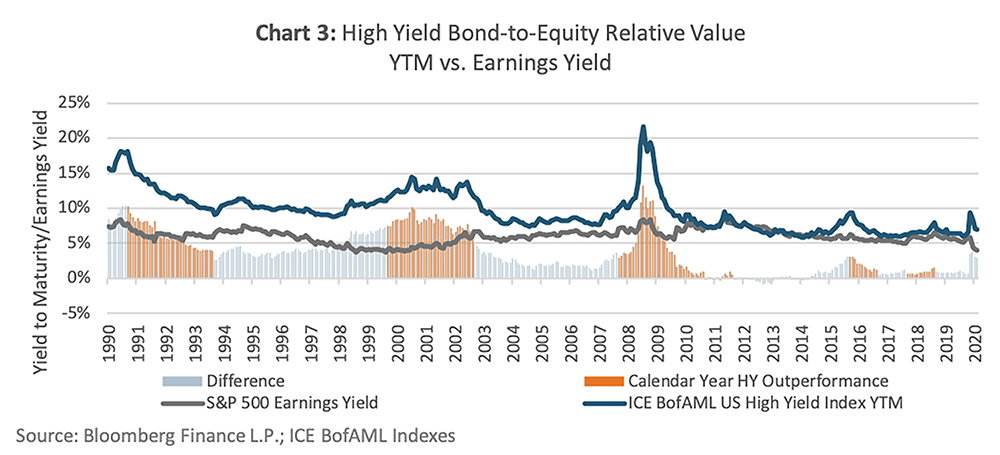
To get a sense of the relative attractiveness of high yield bonds to the S&P 500, Chart 3 illustrates the historic yield of both over the past 30 years – yield-to-maturity for high yield bonds and earnings yield for the S&P 500. A key observation is that high yield bonds have tended to outperform the S&P 500 in periods following spikes in the yield-to-maturity premium over the earnings yield. These periods of high yield bond outperformance also tended to be in periods following recessions (early 90s, early 00s, 2008) and periods of S&P 500 negative volatility (2015 and 2018). In the first half of 2020, the high yield bond yield-to-maturity premium over the S&P 500 earnings yield spiked by 2.0%, the most since 2008, which also marked the beginning of a 4-year high yield bond outperformance period over the S&P 500 (2008-2011).
Buy Low-Sell High
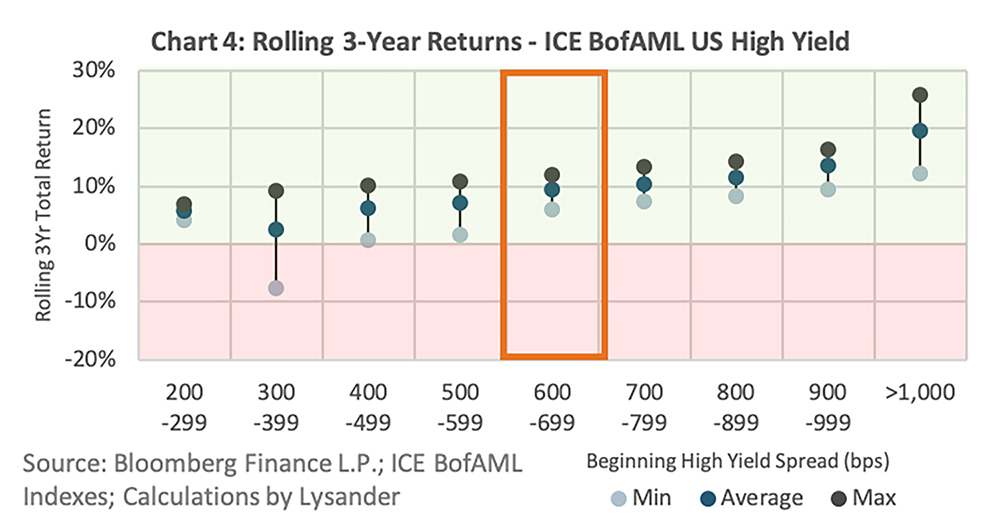
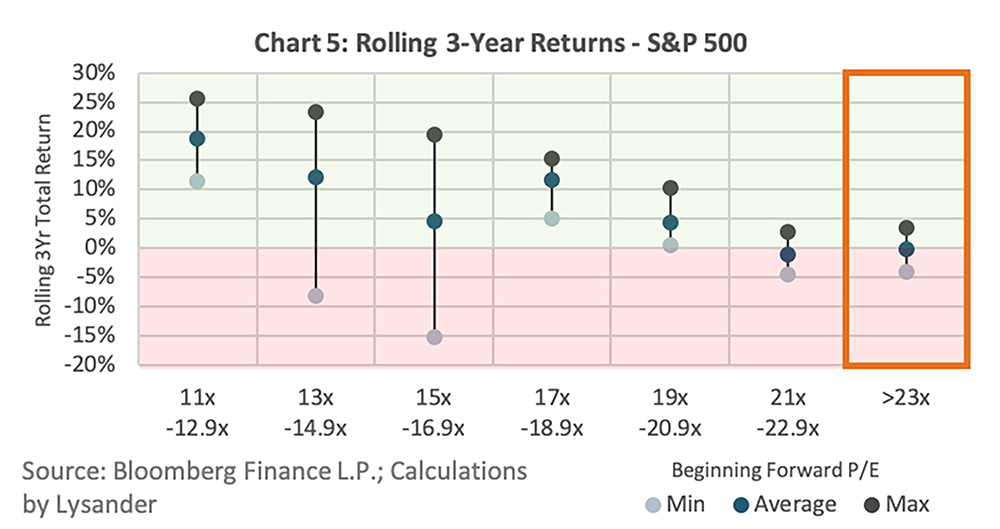
Another tool that can help judge the relative attractiveness of high yield bonds and the S&P 500 is one of the most basic concepts of investing: buy low-sell high. With an OAS spread of 644 and a P/E ratio of 24.9x as of June 30, 2020, high yield bonds have a cheaper valuation than the S&P 500 compared to their respective 20-year historical ranges. Chart 4 and Chart 5 illustrate the maximum, minimum and average rolling 3-year annualized returns over the 20-year period ending June 30, 2020, for high yield bonds and S&P 500 given their starting OAS spread and P/E ratios, respectively. The results of the analyses show that high yield bonds have produced higher average 3-year annualized returns compared to the S&P 500 given their prevailing OAS spread and P/E ratio as of June 30, 2020. Furthermore, given its prevailing P/E ratio as of June 30, 2020, the average 3-year annualized return for the S&P 500 is negative!
Conclusion
The strong gains of the S&P 500 in the face of a fragile economic backdrop can be viewed as a deck of cards – one wrong move and it can all come crashing down. For investors wanting to find a middle ground between positioning their portfolios for a quick or a protracted economic recovery, high yield bonds have shown they can be a viable solution with an attractive relative yield and a cheaper relative valuation compared to the S&P 500. Any decision on portfolio positioning however must be in the context of the time horizon, return and risk constraints of the individual, something that each investor should, if they do not know themselves, discuss with their financial advisor.