

The Holy Grail?
Any investment professional can tell you about the “holy grail” of investing – an investment with great return potential and no risk. Unfortunately, as the saying goes, there are no free lunches. With the S&P 500 Index finishing 2018 with its second worst quarterly return since 2008 and the subsequent rebound to start 2019, investors may be searching for an investment substitute for stocks that reduces downside volatility and maintains upside potential.
Risk Adjustment with High Yield
In today’s low-yield environment, the term high-yield-bond can seem like an oxymoron and can be equally confusing for investors trying to fit them into their asset allocation. In the traditional paradigm of asset allocation, stocks = growth, and bonds = safety; high yield bonds can be a challenge because they are generally not seen to have the safety characteristics of traditional bonds, nor the growth characteristics of stocks.
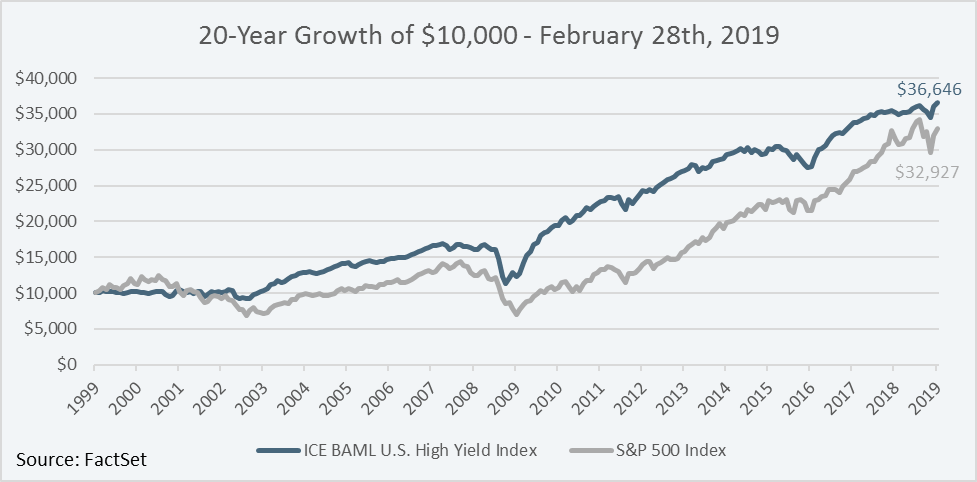
Examining data over the past 20-years, the ICE BAML U.S. High Yield Index produced better risk-adjusted returns compared to the S&P 500 Index, returning 6.7% and 6.1%, respectively, on an annualized total return basis, as of February 28th, 2019. Furthermore, the ICE BAML U.S. High Yield Index exhibited approximately 40% less volatility than the S&P 500 Index, and in the past five calendar years when the S&P 500 Index was negative, the average outperformance of the ICE BAML U.S. High Yield Index in those years was approximately 1100bps (11%)!
Spotting Idiosyncrasies
Investors looking for broad high yield exposure can find it through different investment vehicles including passive mutual funds and ETFs that seek to track the performance of indices such as the ICE BAML U.S. High Yield Index. However additional value can be achieved by identifying unique, or “idiosyncratic”, opportunities not typically captured by passive indices and have the potential to produce above average, non-correlated returns compared to the rest of the high yield market. While there isn’t an Investopedia definition for these idiosyncratic opportunities, our view is they tend to exhibit three common attributes: small issue sizes (less than $500 million), recently downgraded or no credit rating by credit rating agencies, whose prices have been impacted by a structural catalyst.
Aimia Inc.
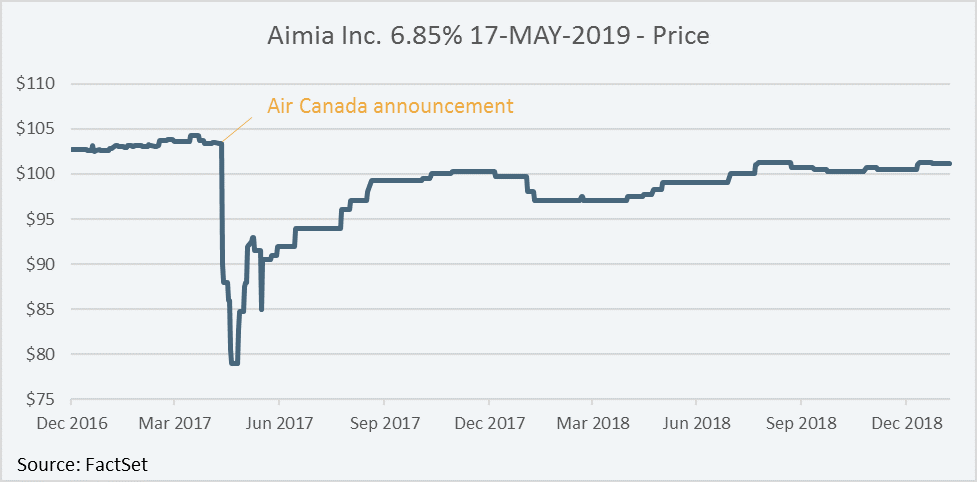
To illustrate, take the Aimia Inc. 6.85% May 17, 2019 bond; a $250 million (CAD) issue that was downgraded by S&P and DBRS in August 2017. On May 11th, 2017, Air Canada announced it was cutting ties with Aimia, the owner and operator of Air Canada’s loyalty program, Aeroplan. As shown in the chart below, the price of the Aimia bond dropped sharply after this announcement, and at the low price had a yield of 18.8% to its 2-year maturity. The attractiveness of this bond was bolstered by the fact that the contract with Air Canada was set to expire in June 2020, with the bond maturity in 2019. With adequate liquidity, the price of the Aimia bond was affected by news possibly not relevant to the company’s ability to meet this debt-obligation. The issue was called by the company in February 2019, at a price of $101.1. From the low price in May 2017, this represented a holding period return of approximately 35% in less than 2-years; not bad for fixed income!
Dorel Industries Inc.
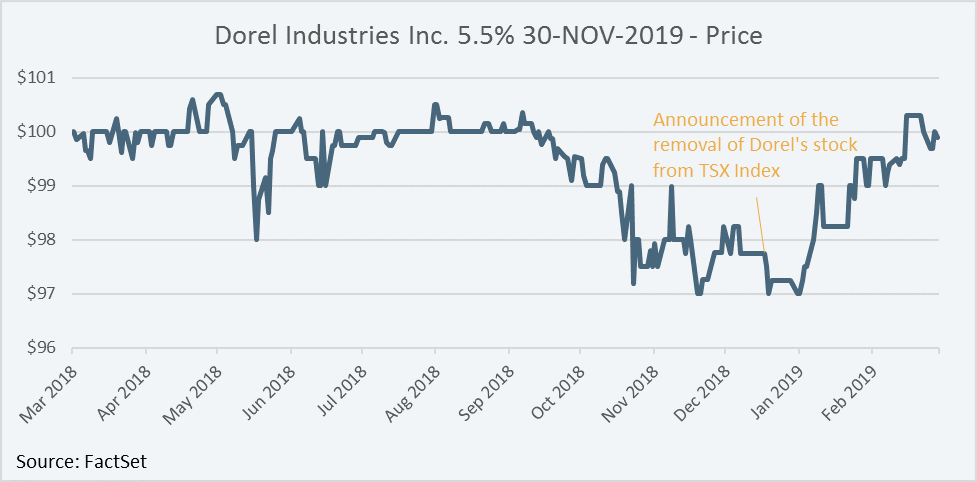
Another example using a current bond issue is Dorel Industries Inc. 5.5% November 30, 2019; a $120 million (USD) convertible bond issue, not rated by credit rating agencies. After a weak Q3/2018 earnings report and it being announced on December 14th, 2018, that Dorel’s stock would be removed from the S&P/TSX Composite Index, the bond traded down in tandem with the stock. At the low price in late December 2018, the bond had a yield to maturity of 9.0% with less than 1-year until maturity. Two months later, the price had returned to par; not bad for money market!
Lysander-Fulcra Corporate Securities Fund
An important distinction must be made in regard to idiosyncratic opportunities. It is not to say that any security that goes down in value is a good investment; good idiosyncratic opportunities must be distinguished from the bad, that is, the “value opportunities” must be distinguished from the “value traps”. This is where the savvy of the investment manager is put to the test.
Lysander-Fulcra Corporate Securities Fund (the “Fund”) is a mutual fund focused on fixed income securities including high yield bonds. Fulcra Asset Management, the Fund’s portfolio manager, has a process that centres on identifying idiosyncratic value opportunities such as the Aimia and Dorel examples. The Series F of the Fund has been ranked by Morningstar as “first quartile” in the High Yield Fixed Income category in each of the calendar years since its inception – December 30th, 2016, to December 31st, 2018. While the Fund is relatively young, Fulcra Asset Management has a robust track record running a similar strategy in-house. As of February 28th, 2019, the Fund had a yield to maturity of 8.3% with a duration of 1.5 years.
Skip the Fear of Missing Out (“FOMO”)
Over the past 20-years, high yield bonds have produced similar long-term returns with less volatility compared to stocks. Further value can be created by active managers, such as Fulcra Asset Management, by effectively identifying idiosyncratic value opportunities in downgraded, or non-rated securities of smaller issuances, whose prices have been adversely affected by structural catalysts at a given point in time. The holy grail might not exist, but in a period of increased stock market volatility, a greater exposure to high yield bonds as part of a stock risk asset allocation could be one way to protect against downside risk, maintain upside potential and keep FOMO at bay.
Important Disclaimers
This document has been prepared by Lysander Funds Limited. This document is not an invitation to invest in the Lysander Funds. This document does not constitute a public offering of sale.
Commissions, trailing commissions, management fees and expenses all may be associated with investment fund investments. Please read the prospectus before investing. The indicated rates of return are the historical net total returns for the period indicated including changes in unit value and reinvestment of all distributions and do not take into account sales, redemption, distribution or optional charges or income taxes payable by any securityholder that would have reduced returns. Investment funds are not guaranteed or insured, their values change frequently and past performance may not be repeated.
Standard performance data and Morningstar quartile rankings for Lysander-Fulcra Corporate Securities Fund (the “Fund”) are as follows:
| Lysander-Fulcra Corporate Securities Fund – Series A (As of December 31, 2018) |
1-Year | Since Inception (December 31, 2016) |
|---|---|---|
| Standard Performance | -0.6% | 3.6% |
| Morningstar Quartile Rank (High Yield Fixed Income Category) |
2nd (December 31, 2018) |
1st (December 31, 2018) |
| Lysander-Fulcra Lysander-Fulcra Corporate Securities Fund – Series F (As of December 31, 2018) |
1-Year | Since Inception (December 31, 2016) |
|---|---|---|
| Standard Performance | -0.1% | 4.2% |
| Morningstar Quartile Rank (High Yield Fixed Income Category) |
1st (December 31, 2018) |
1st (December 31, 2018) |
Morningstar quartile rankings are determined by Morningstar Research Inc., based on categories maintained by the Canadian Investment Funds Standards Committee. The “High Yield Fixed Income” category had 613 funds in the category as of December 31, 2018. Quartile rankings are comparisons of the performance of a fund to other funds in a particular category are subject to change monthly. The Morningstar quartile for the Fund referred to herein are as of December 31, 2018. The quartiles divide the data into four equal segments expressed in terms of rank (1,2,3,4). The quartile measure shows how well a fund has performed compared to all other funds in its peer group. Peer groups are defined such that mutual funds are ranked only versus other mutual funds that are in the same category and segregated funds are ranked compared to other segregated funds in the same category. The top 25% of funds (or quarter) are in the first quartile, the next 25% of funds are in the second, and the next group is in the third quartile. The 25% of funds with the poorest performance are in the fourth quartile. © 2019 Morningstar. All Rights Reserved. The information relating to Morningstar and Morningstar quartile rankings contained herein: (1) is proprietary to Morningstar and/or its content providers; (2) may not be copied or distributed; and (3) is not warranted to be accurate, complete or timely. Neither Morningstar now its content providers are responsible for any damages or losses arising from any use of this information. Past performance is no guarantee of future results.
Nothing in this document is intended to constitute legal, tax, securities or investment advice, nor an opinion regarding the appropriateness of any investment, nor a solicitation of any type. This document has been prepared solely for information purposes. It is made available on an “as is” basis. Lysander Funds Limited does not make any warranty or representation regarding the information contained herein, and this document must not be relied on in making an investment decision. Lysander Funds Limited will not be responsible for any type of loss incurred by applying any of the information presented. Nothing in this presentation should be considered a recommendation to buy, sell or short a particular security. Any specific securities discussed are intended as an illustration of the portfolio manager’s security selection process. The Fund may sell these securities at any time, or purchase securities that have previously been sold. The securities or short positions may increase or decrease in value after the date hereof, and the Fund may accordingly gain or lose money on the investment in the securities.
®Lysander Funds is a registered trademark of Lysander Funds Limited.
Copyright © 2015 FTSE TMX Global Debt Capital Markets Inc. All rights reserved. FTSE TMX Global Debt Capital Markets Inc (“FTDCM”), FTSE International Limited (“FTSE”), the London Stock Exchange Group companies (the “Exchange”) or TSX INC. (“TSX” and together with FTDCM, FTSE and the Exchange, the “Licensor Parties”). The Licensor Parties make no warranty or representation whatsoever, expressly or impliedly, either as to the results to be obtained from the use of the FTSE TMX Canada Indices (“the Indices”) and/or the figure at which the said Indices stand at any particular time on any particular day or otherwise. The Indices are compiled and calculated by FTDCM and all copyright in the Indices values and constituent lists vests in FTDCM. The Licensor Parties shall not be liable (whether in negligence or otherwise) to any person for any error in the Indices and the Licensor Parties shall not be under any obligation to advise any person of any error therein. “TMX” is a trade mark of TSX Inc. and is used under licence. “FTSE®” is a trade mark of the London Stock Exchange Group companies and is used by FTDCM under licence. “TMX” is a trade mark of TSX Inc. and is used under license. “FTSE®” is a trade mark of the FTSE International Limited and is used by FTDCM under license. Copyright © 2017 S&P Dow Jones Indices LLC, a division of S&P Global. All rights reserved. TSX © Copyright 2018 TSX Inc. All Rights Reserved.
Any unauthorized use or disclosure is prohibited. Nothing herein should in any way be deemed to alter the legal rights and obligations contained in agreements between any ICE Data Services entity (“ICE”) and their clients relating to any of the Indices or products or services described herein. The information provided by ICE and contained herein is subject to change without notice and does not constitute any form of representation or undertaking. ICE and its affiliates make no warranties whatsoever either express or implied as to merchantability fitness for a particular purpose or any other matter in connection with the information provided. Without limiting the foregoing ICE and its affiliates makes no representation or warranty that any information provided hereunder are complete or free from errors omissions or defects. All information provided by ICE is owned by or licensed to ICE. ICE retains exclusive ownership of the ICE Indices including the ICE BofAML Indexes and the analytics used to create this analysis ICE may in its absolute discretion and without prior notice revise or terminate the ICE information Indices and analytics at any time. The information in this analysis is for internal use only and redistribution of this information to third parties is expressly prohibited. Neither the analysis nor the information contained therein constitutes investment advice or an offer or an invitation to make an offer to buy or sell any securities or any options futures or other derivatives related to such securities. The information and calculations contained in this analysis have been obtained from a variety of sources including those other than ICE and ICE does not guarantee their accuracy. Prior to relying on any ICE information and/or the execution of a security trade based upon such ICE information you are advised to consult with your broker or other financial representative to verify pricing information. There is no assurance that hypothetical results will be equal to actual performance under any market conditions. THE ICE INFORMATION IS PROVIDED TO THE USERS “AS IS.” NEITHER ICE NOR ITS AFFILIATES NOR ANY THIRD PARTY DATA PROVIDE WILL BE LIABLE TO ANY USER OR ANYONE ELSE FOR ANY INTERRUPTION INACCURACY ERROR OR OMISSION REGARDLESS OF CAUSE IN THE ICE INFORMATION OR FOR ANY DAMAGES RESULTING THEREFROM. In no event shall ICE or any of its affiliates employees officers directors or agents of any such persons have any liability to any person or entity relating to or arising out of this information analysis or the indices contained herein.