

A New Paradigm for Interest Rates
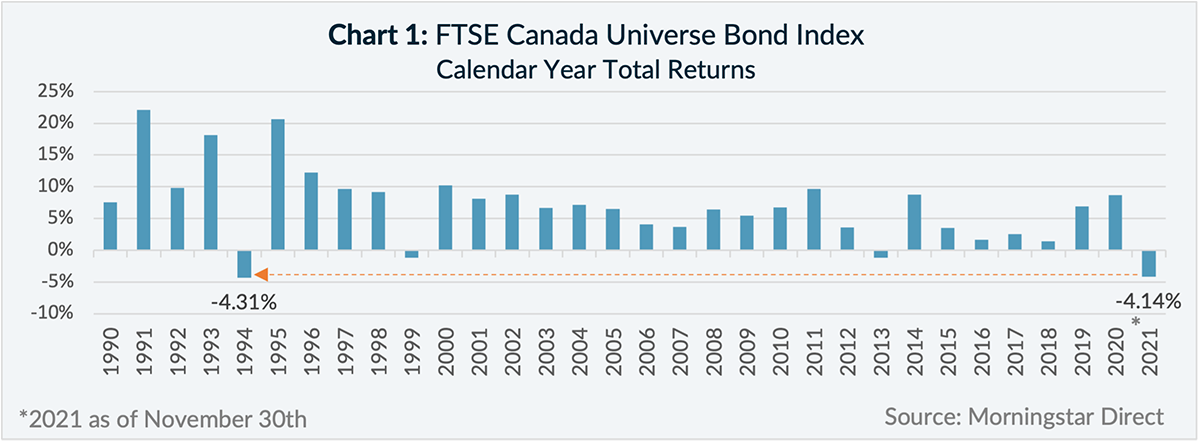
2021 has been a rough year for the Canadian bond market, and it may only be the beginning of more pain to come. The FTSE Canada Universe Bond Index, which tracks Canadian dollar corporate and government bond issuances, has returned -4.14% year-to-date as of November 30, 2021, and as illustrated in Chart 1, is on track for its worst calendar year return since 1994.
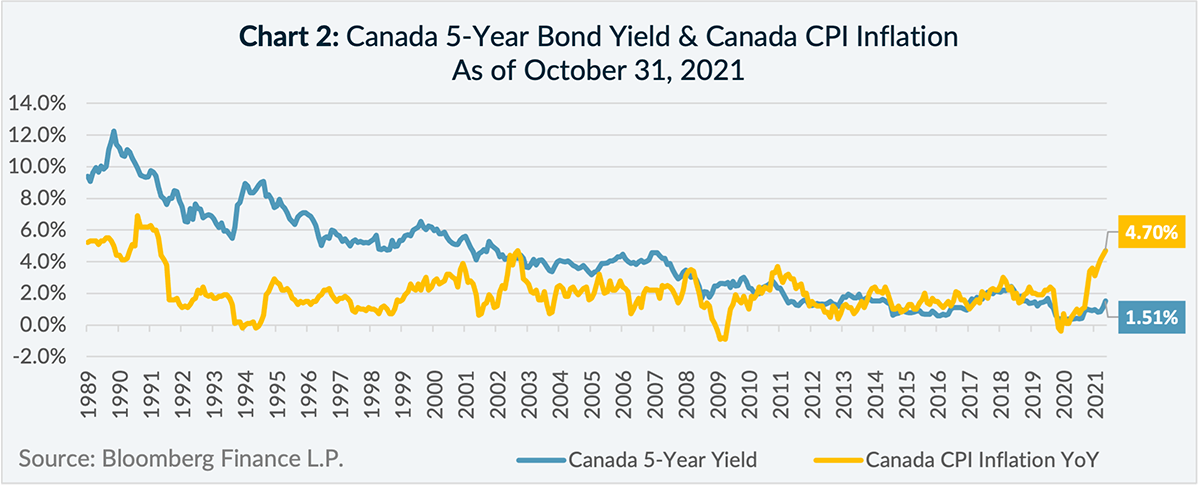
The main culprit behind the bond market weakness has been rising interest rates – interest rates and bond prices have an inverse relationship. Year-to-date as of November 30, 2021, the Canada 5-year bond yield has risen by 1.00%, and there is reason to believe that interest rates could rise further. As illustrated in Chart 2, as of October 31, 2021, year-over-year Canada inflation exceeded the Canada 5-year bond yield by an unprecedented 3.19%.
This is significant because inflation erodes the purchasing power of “fixed” coupon payments, therefore investors typically demand higher bond yields to compensate for the loss of purchasing power as inflation rises. Therefore, it has been customary for the Canada 5-year bond yield to exceed the rate inflation, and for this relationship to normalize one of two things must happen – inflation goes down or interest rates go up.
There is an Alternative
The risk of rising interest rates for bond investors has never been stronger. With absolute yield levels nearing all-time lows, and price sensitivity to interest rate changes (i.e. duration) nearing all-time highs, it only takes small increases in interest rates to offset one year’s worth of interest income and start depleting investment capital (for more on this, check out our June 2021 whitepaper: Now is Not a Bad Time to Own Bonds, Although it May Be a Bad Time to Own Conventional Bond Strategies).
Against this backdrop of uncertainty, a popular phrase has emerged: “There is No Alternative”, or TINA, which suggests the fixed income asset class should be abandoned all together in favour of asset classes with better perceived relative value characteristics (i.e. equities). It is important to remember, however, that the purpose of an asset mix is to align an expected return with a given level of risk tailored to an individual’s needs. For investors with lower risk tolerances, abandoning fixed income could be potentially catastrophic in the event of a market downturn.
For investors wanting to maintain exposure to fixed income and at the same time decrease exposure to negative price volatility from rising interest rates, one solution to consider is the floating rate note1 (“FRN”). As opposed to traditional fixed coupon bonds, where the rate of interest paid does not change, the distinguishing feature of FRNs is their coupons change with interest rates.
When interest rates rise, FRNs can benefit investors in two ways:
1) Coupon income increases
2) Price volatility is low relative to fixed coupon bonds.
Coupon Structure
To better understand how FRN coupon income increases as interest rates rise, it helps to understand the underlying parts of the FRN coupon, which is simply the sum of 1) the reference rate and 2) the spread.
Reference Rate
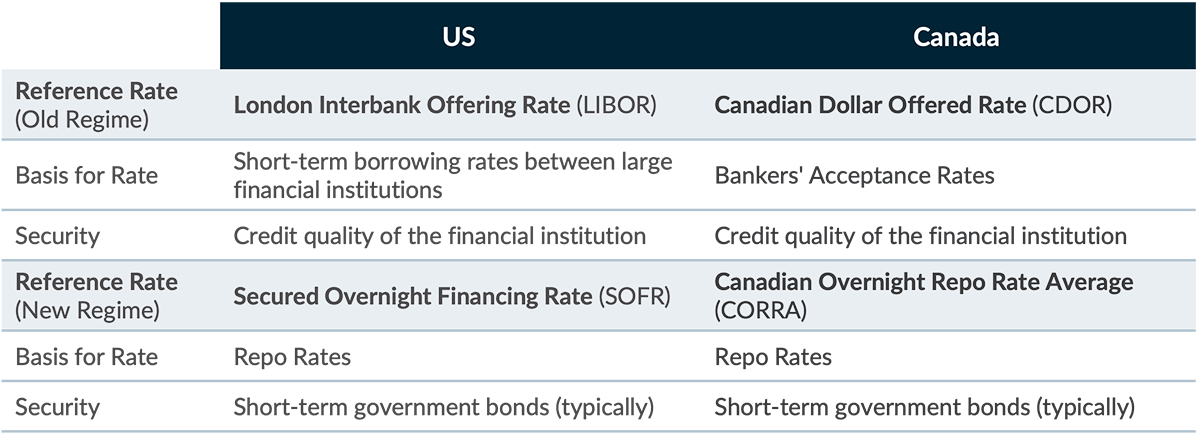
The reference rate is the key mechanism that adjusts the coupon payment of an FRN over its term. Historically the key reference rates for US and Canadian FRNs were the London Interbank Offering Rate (LIBOR) and the Canadian Dollar Offered Rate (CDOR), respectively. As a result of the LIBOR scandal, which came to light almost a decade ago, these reference rates are in the process of being phased out and replaced with the Secured Overnight Financing Rate (SOFR)2 in the U.S., and the Canadian Overnight Repo Rate Average (CORRA)3 in Canada. The main differences between the new and old regimes of reference rates are summarized in Table 1.
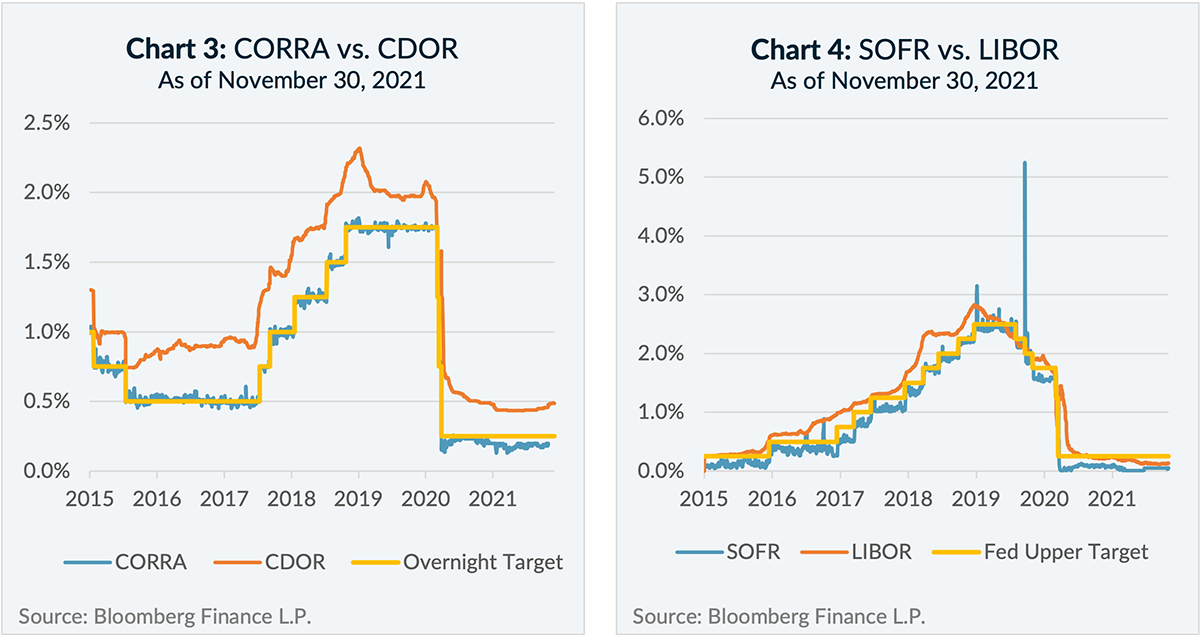
As illustrated in Chart 3 and Chart 4, major changes to SOFR and CORRA rates tend to be driven by changes to overnight target rates by central banks. SOFR and CORRA rates also tend to be lower than LIBOR and CDOR rates, respectively, as the old regime have embedded credit spreads to compensate for the credit risk of a large financial institution, where the new regime is typically collateralized by government bonds, and as a result have little to no credit risk.
Table 1: FRN Reference Rates: New Regime vs. Old Regime
Spread
The spread (or “coupon spread”) refers to the additional yield that is added to the reference rate to determine the overall coupon payment of an FRN, which remains constant throughout the FRN’s term. The spread is determined when the bond is issued based on how the market perceives the risk of the FRN issue – the greater the risk, the greater the spread, the lower the risk, the lower the spread.
FRN vs. Fixed-Coupon Price Volatility
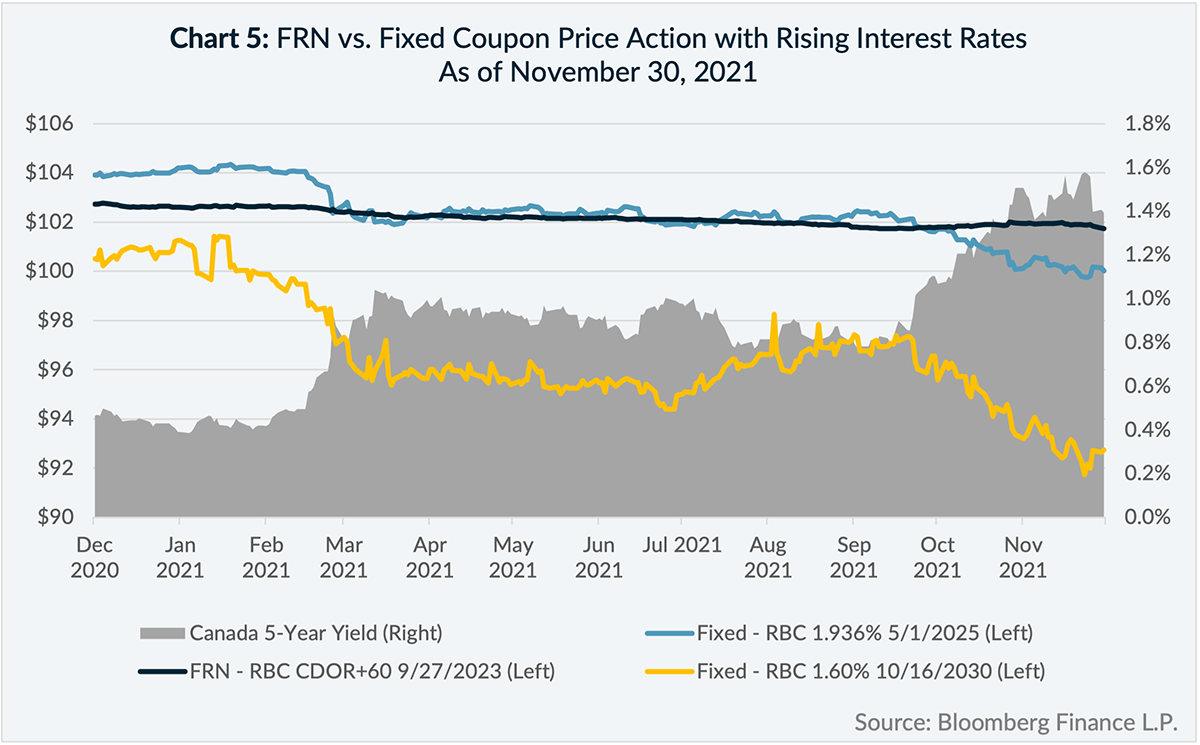
FRNs typically protect capital better than fixed-coupon bonds in rising interest rate environments because their coupons can adjust higher to align their yield-to-maturities with higher levels of interest rates. As fixed- coupon bonds cannot adjust their coupons, it is their prices that must adjust lower to increase their yield-to-maturities in-line with higher interest rates.
As illustrated in Chart 5, over the one-year period ending November 30, 2021, the price return (not including the interest income received) of an RBC FRN was -1.0%, while the price returns of RBC fixed rate bonds with terms-to-maturity of 4 years and 9 years were -3.9% and -7.9%, respectively. Over the same period, the Canada 5-year yield increased by 0.97%.
Conclusion
With historically low interest rates and the prospect of persistently high inflation looking forward, 2021 may only be the beginning of a more protracted period of rising interest rates and bond market weakness. Now more than ever, investors should be taking stock of how much duration they are exposed to in their fixed income portfolios.
The two key sources of value for FRNs relative to fixed-coupon bonds in periods of rising interest rates are:
1) Coupon payments that adjust with the prevailing level of overnight central bank rates and
2) More stable prices that better protect against short-term capital losses.
For these reasons, FRNs can be effective tools for investors who want to maintain exposure to fixed income and reduce the risk of capital loss from rising interest rates.
1 For the purpose of this paper, the discussion around FRNs will preclude those classified as “bank loans” which are also known as “leveraged loans”.
2 The absolute terminal date for LIBOR is set for June 30, 2023, however some LIBOR rates are set to cease on December 31, 2021.
3 Certain CDOR rates ceased on May 17, 2021. There has been no official terminal date established for all CDOR rates, however CORRA is the official fallback rate.