

Investment grade corporates have offered better yield, better capital protection and more efficient portfolios
The Corporate Bond Trifecta
Many would agree that two core tenets of owning bonds in an investment portfolio are to generate income (yield) and provide capital protection. When building a bond portfolio, one of the most basic choices for investors is whether to invest in government bonds or corporate bonds (“corporate bond” refers to investment-grade corporate bonds for the purpose of this paper). The distinction between the two can be subtle. Government bonds are generally perceived as having better capital protection characteristics and better suited to more-risk averse investors, and corporate bonds are generally perceived as having better yield characteristics while sacrificing capital protection qualities, and better suited for less risk-averse investors.
Analyzing the returns of Canadian corporate bonds (via the ICE BAML Canada Corporate Bond Index) and Canadian government bonds (via the ICE BAML Canada Government Bond Index) over the past 27 years, the data has shown corporate bonds have: (1) provided a better yield than government bonds; (2) shown better capital protection qualities than government bonds; and (3) been able to generate more efficient portfolios when combined with stocks.
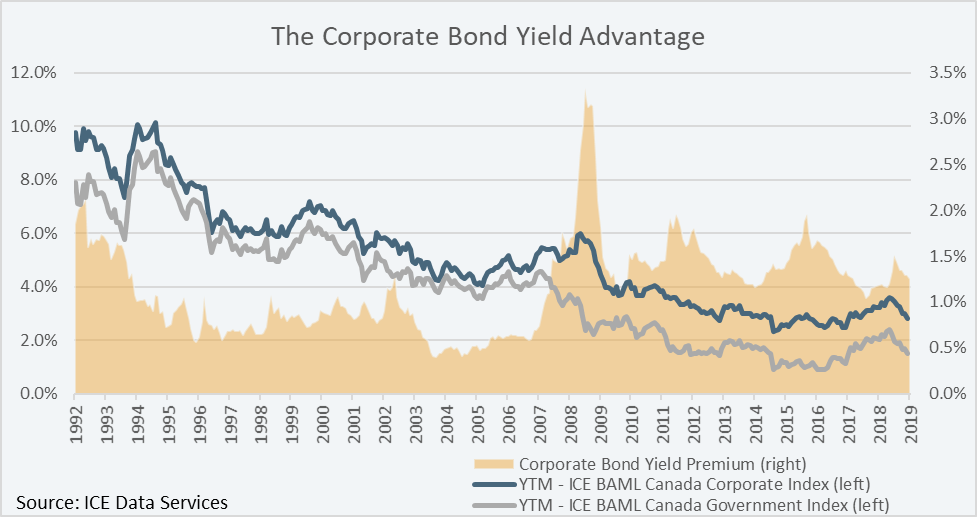
(1) Better Yield
The chart below shows the historical yield advantage of corporate bonds over government bonds from the year 1992 to the year 2019. A traditional minimum yield that investors would accept is the rate of inflation, which the Bank of Canada targets at 2%. The yield on government bonds moved below 2% in 2011, and has stayed below that level to this day (only briefly moving above 2% in 2018). The average yield premium on corporate bonds over the same period was 1.4%, which is significant because it was the difference between investors earning a positive or negative yield after-inflation.
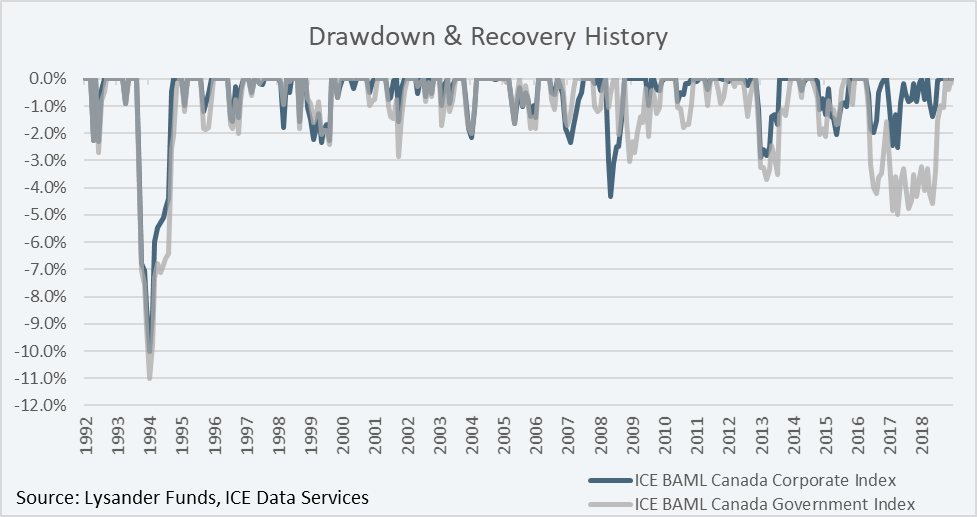
(2) Better Capital Protection
The perception that government bonds have better capital protection (drawdown) characteristics than corporate bonds can be linked to the fact that government bonds are labeled as “risk-free”. However, this label only pertains to credit risk, or default risk, and doesn’t mean that government bonds cannot lose investors’ money. There are a variety of risks that investors in government bonds and corporate bonds alike must be aware of, one of the most important risks being interest rate risk, which was discussed in a previous paper: “Beware of Falling Interest Rates: Your Bonds May Be Riskier Than You Think!”.
As the chart below illustrates, government bonds are not necessarily more resistant to drawdowns compared to corporate bonds. In fact, on average the opposite has been true. Over the past 27 years, the average maximum drawdown for government bonds and corporate bonds was 1.6% and 1.3%, respectively, and the average length of the drawdown period was 6.8 months and 5.6 months, respectively. In other words, corporate bonds on average have had smaller maximum drawdowns and shorter drawdown periods than government bonds!
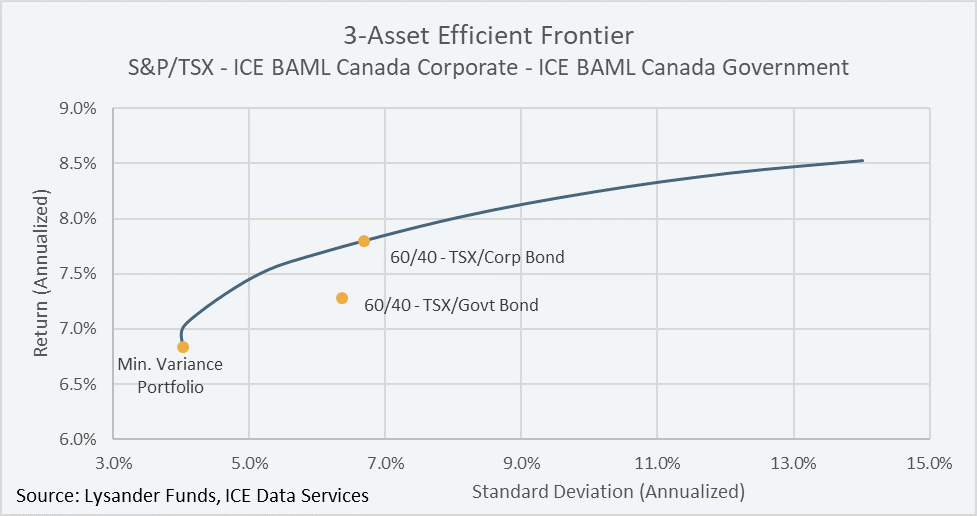
(3) More Efficient Portfolios
Modern Portfolio Theory teaches us that investors shouldn’t focus on investments that generate the highest absolute returns irrespective of risk, rather the focus should be on generating “efficient portfolios” – allocating to a fixed set of investments in a way that generate the highest returns at a given level of risk, where risk is defined as the standard deviation of returns. Plotting all of the efficient portfolios at different risk levels gives what is known as the “efficient frontier”. Any portfolio plotted below the efficient frontier is known as an inefficient portfolio because a greater return could be achieved with the same set of investments at the same level of risk.
The chart below shows the efficient frontier for the following investment set: S&P/TSX Total Return Index, ICE BAML Canada Corporate Bond Index and ICE BAML Canada Government Index. The only portfolio on the efficient frontier with even a partial allocation to government bonds is the “Minimum Variance Portfolio” – the portfolio that generates the lowest absolute level of risk. All other points on the efficient frontier were generated using some combination of the S&P/TSX Total Return Index and ICE BAML Canada Corporate Bond Index without the need for government bonds. The chart also illustrates how a portfolio comprised of 60% S&P/TSX Total Return Index and 40% ICE BAML Canada Government Bond Index is an inefficient portfolio, as it is plotted below the efficient frontier, and a higher return could be achieved at a similar level of risk by pairing the S&P/TSX Total Return Index with the ICE BAML Canada Corporate Bond Index instead of with the ICE BAML Canada Government Bond Index.
Conclusion
Government bonds, despite being categorized as “risk-free” from a default risk perspective, are not risk-free from a capital loss perspective. Based on historical data, investment grade corporate bonds have been the clear choice for investors looking to improve yield, improve capital protection and create more efficient portfolios.