

The Torsion of Interest Rate Distortion
The early 2023 “Will They, Won’t They” and “They Should” bond market consensus of lower interest rate prognostication morphed into a mid-year and more pleading “Why Won’t They??” lower interest rates. It has now grudgingly grown into a more accepting but fatalistic “They Probably Won’t” consensus.
Like all investment market consensuses and truths over financial history, this one grew into an unrealistic and unchallengeable truth that exploded in the face of a very inconvenient reality. That reality was that the recession predicted by the most publicized YIELD CURVE INVERSION!! of all time has not happened.
At least not yet.
We are going to spend most of this Market Observer on the bond market. If you consume financial media, that seems to be the only thing that now matters. Bond yields shoot up and down on the smallest change in economic statistics and utterances from anyone at the Federal Reserve. The stock market responds in kind, dependent on the prospects for lower yields to hold onto its pricey levels. It has also become apparent that normal people are questioning why their “safe bonds” are worth a lot less now.
Herds of Investment Lemmings
As Canso Market Observer readers, you know that markets have a way of confounding forecasters on stock prices and macroeconomics. Convincing arguments seep into the mainstream and become unassailable truths that a consensus forms around. That is until they evaporate in the red-hot crucible of human market behaviour. The aggregated behaviour of fickle humans is not an impartial arbiter of investment value. Human investors are herd animals at best, following the latest trend of investment fashion. At worst they are trend following Lemmings driven by evolutionary instinct and behaviour, jumping off investment cliffs to their value implosion fate.
The problem, as we see it at Canso, is the bizarre and unprecedented suspension of central banker disbelief from 2011 to 2021. This has conditioned investors into believing that “normal” is the very low nominal and real interest rate world that central bankers created by their complete and utter repudiation of monetarist economist Milton Friedman’s mantra: “Only Money Matters”. Their new central banking mantra, supported wholeheartedly by enthusiastic Command and Control financial bureaucrats, regulators, and populist politicians, became “Money Doesn’t Matter”. Central bankers finally created so much money during the pandemic that a panic developed around how to get that money out the door as fast as they could and into the hands of consumers who would spend it as quickly as possible.
The greater problem became that they actually did that. Consumers flush with their “Stimmie” cash created demand well in excess of pandemic reduced supply for many goods and services. Nobody should be surprised that this resulted in the highest inflation since the 1970s. That excess cash also ended up with basement dwelling Reddit investors “playing” the stock market like a video game or sports betting App. Zero and negative cost of capital caused investors of all sophistications to enter into a senseless and success-drunk speculative frenzy. Interest rate up became interest rate down and any thought of efficient capital allocation became a quaint historical relic.
Forgetful Central Bankers
Central bankers are extraordinarily well educated in economics. The working level of central banker requires at least a master’s degree in economics and many PhDs walk the halls of the Federal Reserve, the European Central Bank, and the Bank of Canada. The problem is that they all obviously forgot their expensive educations when they decided in 2011 to embark on their adventure into perpetually loose monetary policy. They also forgot that an economy exists to allocate scarce resources and that an economy’s financial system exists to allocate capital efficiently.
Yielding to the Curve
Those central bankers didn’t only confuse themselves with their adventures in monetary policy, they hopelessly confused bond investors as we see in the changes to the Government of Canada yield curve below. The relaxation of monetary policy in late 2019 saw a fairly flat yield curve. Yields then plunged with the monetary stimulation of the pandemic and became a “normal” yield curve with shorter yields lower than longer. That normal curve persisted until December 2021, even though yields rose over the period.
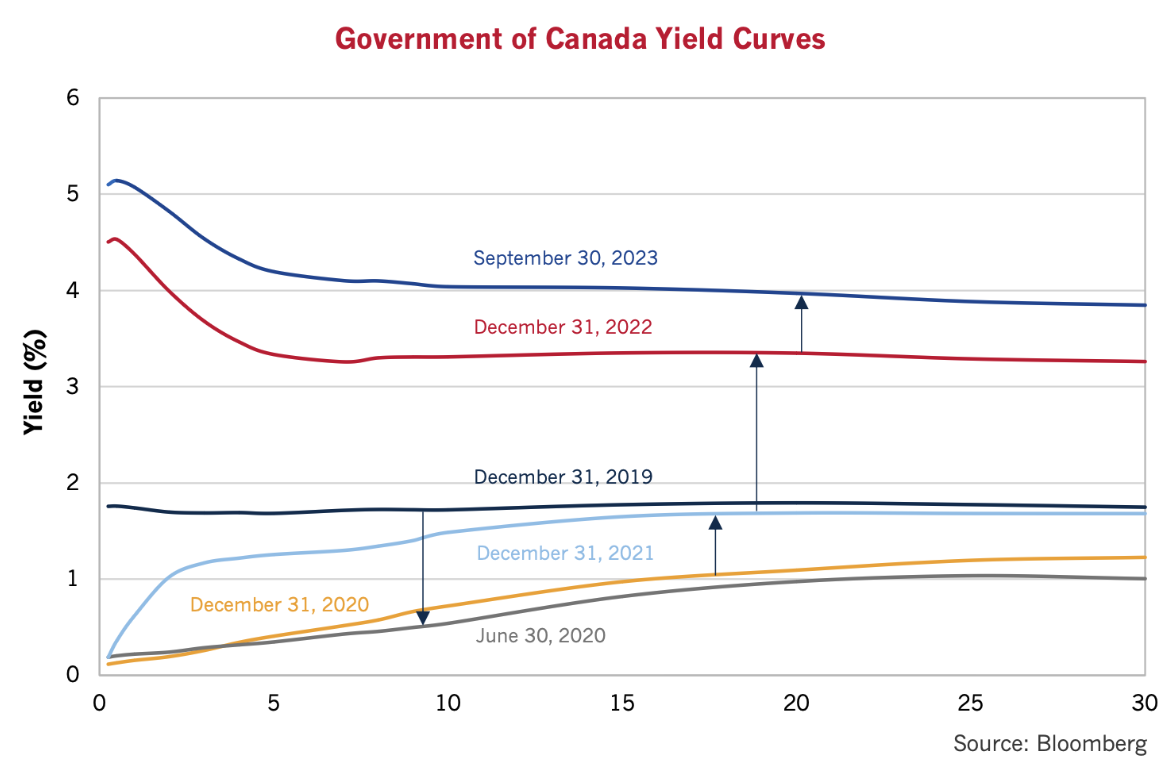
The dreaded yield curve inversion started almost immediately with monetary tightening in 2022. Clearly, investors believed any interest rates above zero would slow inflation down very quickly. They preferred long bonds at lower yields to lock in their bond upside from falling rates.
Complaintive But Insightful
If you leaf back far enough into our Canso Market Observers, you will read our consistent but very accurate complaints at the state of interest rate distortion. Our point was that, like the stock market of the 1920s, bond prices bore no relationship to value. In the middle of the senseless pandemic markets, investors strived to accept the highest possible risks, thinking that this would increase their returns. Perhaps since Reddit investors were making good money in Meme stocks from their parents’ basements, professional bond investors closed their eyes in their pandemic home offices and piled into long-term government bonds as they hugged their bond index benchmarks for all they were worth. When the inevitable rally in bonds came, they didn’t want to be left behind.
They are still waiting and nursing some serious damage to their bond portfolios. We talked about the overvaluation of long government bonds in our July 2020 Market Observer. In our closing paragraph entitled “A Steep Price for Long Bonds,” we were direct: “We simply reiterate that we think that government bonds are pushing the limits of investor tolerance. Long bonds in Canada at 1% and in the U.S. at 1.4% are vastly overvalued but no central bank will tighten up monetary policy for some time to come.” Our thoughts on long bond valuations were pretty clear at that time.
$73 Billion of Painful Bonds
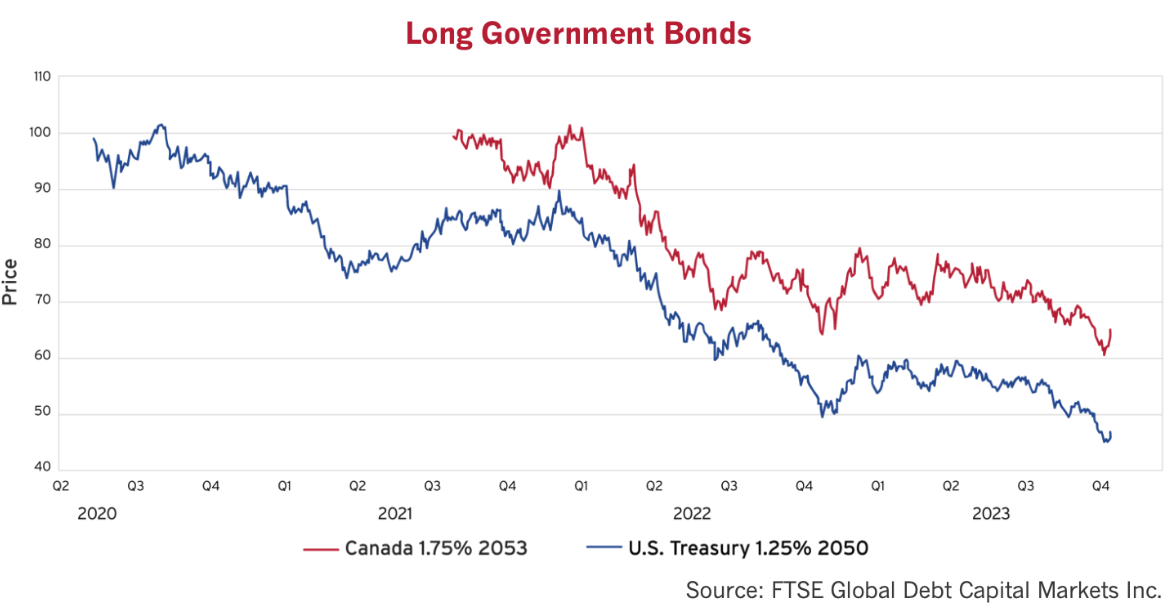
When long Treasury bonds were promising just over 1% for 30 years, we despaired. The promise of $1.00 in coupon income for 30-years and then our $100 of inflation depreciated capital back just didn’t bestill our beating bond hearts. It must have excited other investors, since the U.S. Treasury issued $73,566,720,900 of 1.25% Treasury due on May 15th, 2050, during the low yields of the summer of 2020. As you read above, we said then that buying a long Treasury or Canada bonds at yields just over 1% was a reckless bet by bond investors from a longer term and historical viewpoint. Bond yields were not even that low in the 1930s with serious deflation.
We cautioned our readers that fixed rate bonds bore incredible risks to the investor. A look at the chart below shows that we were very right. The blue line is the price of the U.S. Treasury 1.25%/2050. The $100 issue price immediately dropped to $90, but then recovered briefly to $101 until dropping inexorably to the current $50. The lowest long Canada is the 1.75% of 2053, shown in the chart below by the red line. It has a higher coupon since it was issued when yields were higher in the Fall of 2021. It has only dropped 30%!!
A Shellacking Gets Attention
A shellacking on any financial investment gets a lot of financial media attention. There’s lots of talk now in the financial media about the setback in the bond market. The October Bloomberg Businessweek feature is “Bondageddon”, “Worst US Bond Selloff Since 1787 Marks End of Free-Money Era: Carnage from the bond market—where the rout is worse than anything you’ll find in the history books—is spreading, and the implications are nasty.” Source: Xie, Ye. Worst US Bond Selloff Since 1787 Marks End of Free-Money Era. Bloomberg, October 8, 2023. These Bloomberg reporters didn’t hold their punches.
Now the consensus seems to be moving decidedly against bonds, and especially longer-term bonds, as we expected and predicted in our past newsletters. A 50% crater in price happens frequently in the equity markets, but seldom in the bond market, outside of a default by a corporate issuer. That seems to have hit the nerve with bond investors that we expected. As Bloomberg confirms, investors seem to be throwing in the towel:
““With nerves on edge, investors have been eschewing longer-dated bonds despite the historically high yields they are offering. While I fully understand that it’s tempting to buy duration today, I’m not sure that we have seen the peak in yields,” said Stefan Hofrichter, chief economist at Allianz Global Investors, citing his expectation that rates will stay higher for longer.
There’s also little incentive for investors to buy long duration debt when shorter-maturity bond yields are higher than longer-dated ones — the type of inversion that reflects investor unease about the economy.
“Nobody wants to buy the long end of the curve,” said Eric Vanraes, head of fixed income at Eric Sturdza Investments. “Why should I buy bonds below 5% which have higher duration when I can buy into money markets?”” Source: Ronan Martin and Tasos Vossos. Stay Boring’ It’s How Bond Investors Are Riding Out Volatility. Bloomberg, October 9, 2023
A Divine Bond Discussion
We used to be fairly alone in our concerns about the bond market, but now there are a lot of people who are worried about bonds. Those readers who know the markets as well as we do can divine where this discussion is going. Now that bond investors seem to have given up hope and are accepting “higher for longer” interest rates, does this mean they are capitulating and/or things are getting interesting for Canso???
Yes and yes, and that change in investor sentiment is setting up for an interesting close to 2023. The bad news is that inflation does not seem to have settled down or might settle down at a level higher than expected by the market’s still 2% inflation forecast, predicted by the difference between nominal and inflation-linked bonds. The good news is that the current level of yields is now paying investors more to accept the risk of higher inflation. Is it enough? As always, to assess whether the potential return is sufficient for an investment, we need to research and analyze that potential investment and we return to financial history once again.
Old Memories
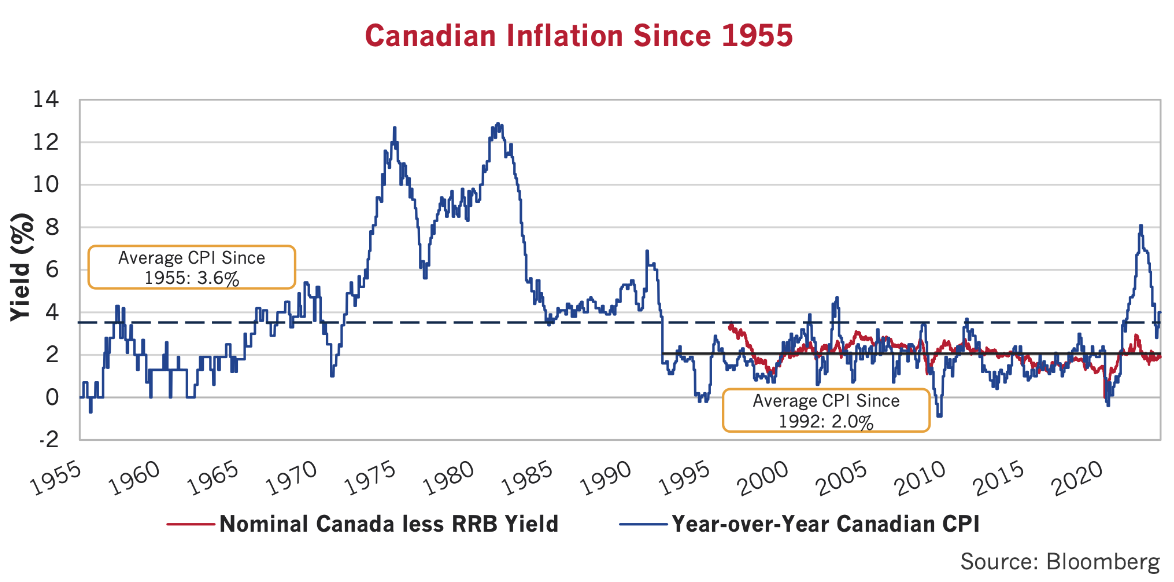
Things are little different in Canada, since Canadian investors persist in their very low inflation forecast. The chart below shows Canadian inflation since 1955, which has averaged 3.6%. We chose 1955 as it was 10 years after the end of WW2 and the resultant inflation after wage and price controls were removed. Inflation had shot up on huge increases in consumer spending and then fell precipitously over the period and finally settled down at just above zero as civilian production picked up after the massive war effort production. Ford and GM had shut down civilian car production and made tanks and military aircraft during the war but had fully returned their factories to civilian car production by 1955.
Back to a 1970s Wage and Price Future??
Today feels familiar to those of us at Canso who lived through the 1970s. Employees are striking, and employers are refusing to settle, at least until they fold in the face of shutdowns and falling revenues. Autoworkers are striking in the U.S., and they have just settled in Canada. The Canadian Ford deal caught our attention:
“Details of the Unifor (GM Canada) deal were not immediately available. But the deal with Ford included a wage increase of 10% in the first year of the agreement, followed by a 2% and 3% increase over the next two years of the contract. It also restored the cost-of-living adjustments (COLA) to protect workers from rising prices.
The Ford agreement also returned to a pension plan — rather than just 401(k)-style retirement accounts — for Unifor members hired at Ford in recent years. And it converted temporary staff who work full-time shifts into permanent employees.” Source: Isidore, Chris. GM settles strike at Canadian plants. CNN Business, October 10, 2023
An employer like Ford can only make such significant concessions if they have the car sales and revenues to support those costs. These costs are very high, and we note that COLA and the pension plan were legacy contract provisions that were cut out after the Credit Crisis restructurings of bankrupt GM and Chrysler in 2009. The Unions then traded cost cuts for jobs. It is clear there has been a power shift here back to labour and unions.
Pay COLA, It’s the Real Thing!!
The Cost-of-Living Adjustment (COLA) in the Ford contract really is a blast from the past. As some of our older Canso staff recall, your pay would automatically increase with inflation and some employers made several COLA adjustments per year to keep their wages the same in real terms. Striking workers demanded pay increases to compensate for inflation if they didn’t have COLA. Sound familiar? The economists of the 1970s debated “Demand Pull” and “Cost Push” as the reason for higher inflation. It definitely looks like more than a bit of “Cost Pushing” here!
No Shortage of Money Yet
Is current monetary policy tight enough? There has to be enough money around for a business to fund higher wages and that requires increased revenues. Tight monetary policy dictates a scarcity of money and credit, thus denying consumers the income for higher consumer spending that forms the revenues that employers need to pay higher wages. Higher unemployment also discourages strikes and higher pay demands.
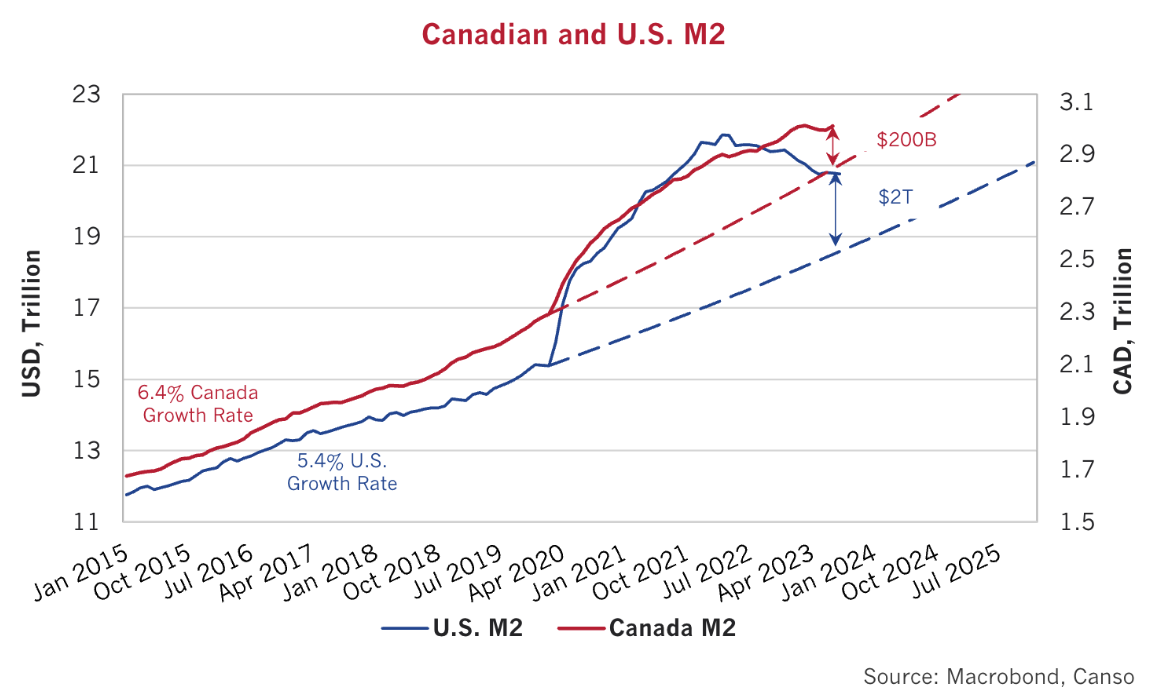
Thus far, we are not seeing a shortage of money in Canada and the U.S., and this is reflected in our updated chart above of U.S. and Canadian M2. As we have pointed out before, the pandemic monetary panic massively expanded M2 well above prior growth rates. Looking closely, note that U.S. M2 had been declining since the summer of 2022, as we pointed out in our April Market Observer, but Canadian M2 had continued to grow, which was necessary to keep interest rates “paused”. Now that both countries have once again “paused” their tightening efforts, it will be a long time before money supply is reduced and the actual M2 growth meets the former 6.4% growth line for Canada and 5.4% for the U.S.
If “Only Money Matters”, then “Houston, we have a problem”. We estimate that the U.S. currently has $2 trillion in excess M2 and Canada has $200 billion compared to their pre-pandemic growth rates. M2 is the narrowest of money supply figures and consumers can spend other “money”. Fractional banking and credit mean that the real numbers and spending power are far larger. It doesn’t matter if your home equity has doubled in value and/or you can make the payments on your loan if nobody will lend against that value. That happens when capital is scarce and being jealously guarded by those who still have it. That doesn’t seem to be the case currently. Although administered interest rates have risen substantially there still seems to be enough money in circulation to not crimp economic activity. So far, we don’t see a lot of evidence that money is “tight” and hard to get.
Older and Richer
This “Rolling Financial Recession” seems to be affecting different groups of consumers in different ways. Recent consumer surveys suggest higher interest rates actually benefit older, well-established consumers. They increase the level of passive income that can be drawn from retirement funds and investment portfolios, while at the same time don’t have the same bite on the housing side given that the older demographic tends to have already paid off their home or at least locked in their mortgage rate. That perhaps is why higher interest rates aren’t hurting as badly as the consensus expected. As the Wall Street Journal reported, seniors over 65 are an important and growing factor in consumer demand in the U.S.:
“In August, 17.7% of the population was 65 or older, according to the Census Bureau, the highest on record going back to 1920 and up sharply from 13% in 2010. The elderly aren’t just more numerous: Their finances are relatively healthy and they have less need to borrow, such as to buy a house, and are less at risk of layoffs than other consumers.
This has made the elderly a spending force to be reckoned with. Americans age 65 and up accounted for 22% of spending last year, the highest share since records began in 1972 and up from 15% in 2010, according to the Labor Department’s survey of consumer expenditures released in September…
… “Our large share of older consumers provides a consumption base in times like today when job growth slows, interest rates rise and student-debt loan repayments begin again,” she said.” Source: Guilford, Gwynn. The U.S. Economy’s Secret Weapon: Seniors With Money to Spend. The Wall Street Journal, October 8, 2023.
Are Long Bonds Cheap Enough???
In the modern monetary policy period since 1955, when post WW2 inflation came under control, Canada has only seen two periods when inflation was above the long Canada yield.
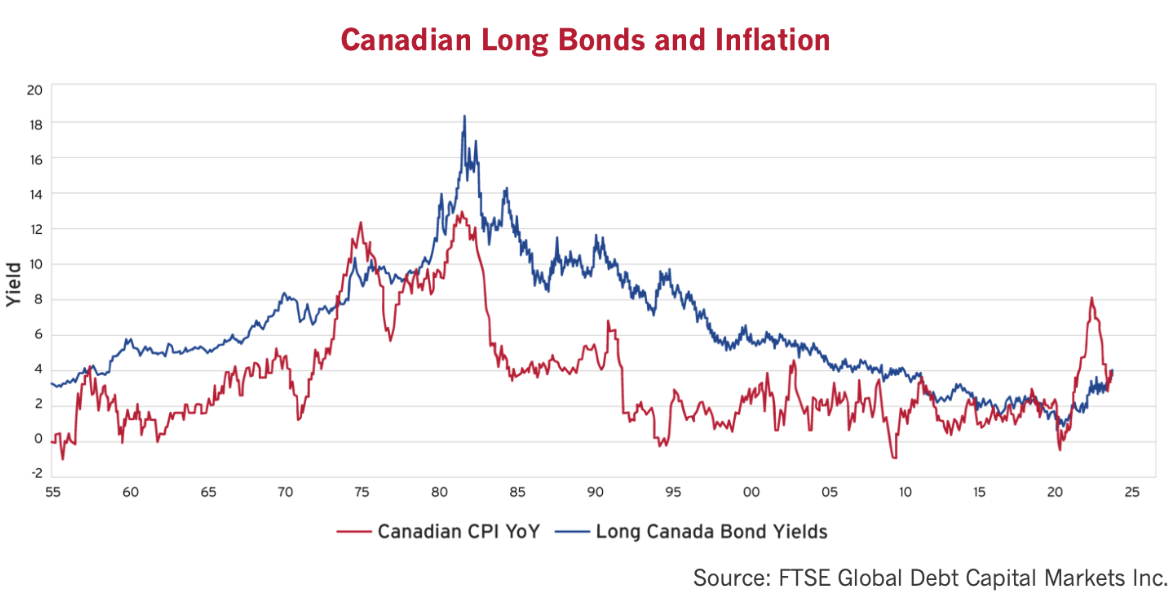
Looking at the chart above, except for the high inflation period from 1973 to 1976, Long Canada bond yields predominately stayed well above CPI until the Zero Interest Rate Period of monetary policy experimentation and exercise in economic stupidity from 2011 to 2021. Either the long Canada yield is going to need to increase, or Canadian inflation needs to fall to create a positive real yield for investors in a long Canada bond.
Despite all this discussion, the question still remains, what level of long bond yields makes it appropriate to hold one? The chart below shows the “real yield” above trailing year-over-year CPI in Canada and the U.S. Since 1980, the long Canada real yield has averaged 3.2%. With Canadian inflation currently running at 4%, that suggests a 7.2% yield on a long Canada if inflation holds at current levels. If the CPI moves to the BOC target of 2%, fair value would be 5.2%, 1.5% above the current 3.7% yield of the long Canada.
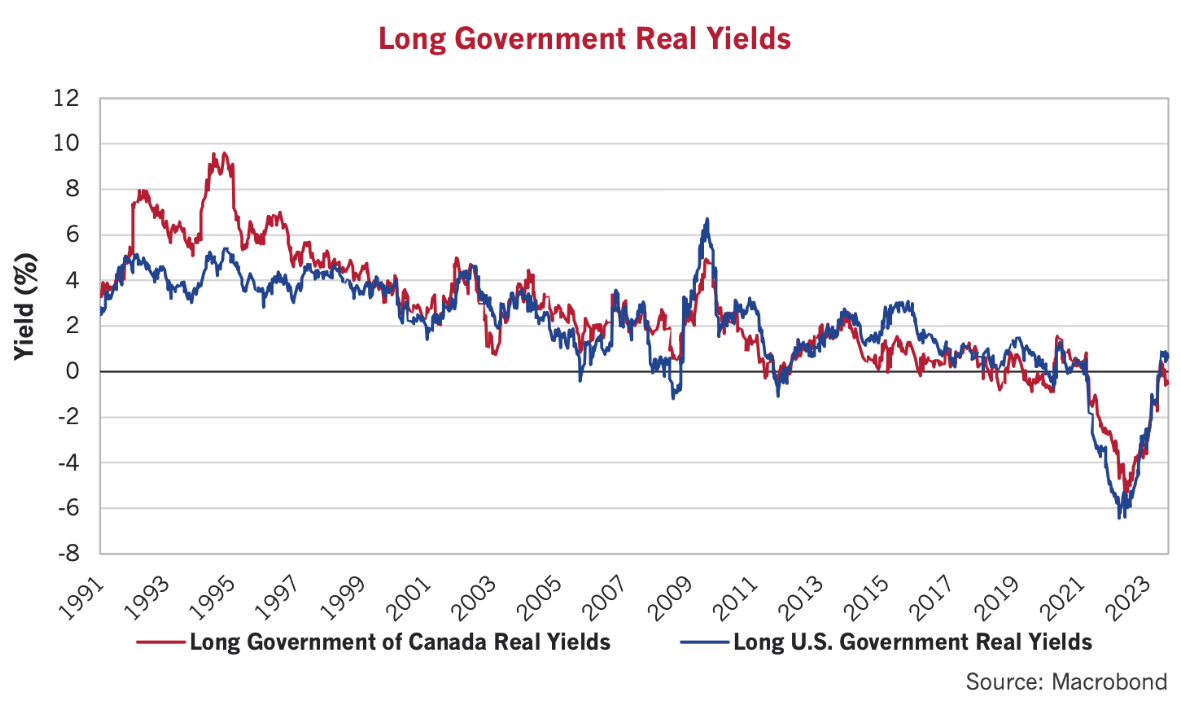
The average real yield on the U.S. long Treasury has run at 2.8% over the same period since 1980. Added to the September U.S. CPI of 3.7%, it indicates a 6.5% fair value yield on a long Treasury, 1.7% over the current long Treasury yield of 4.8%.
Will Canada Bonds Do Better Than U.S. Treasuries???
A major question that we are asking ourselves is whether, as the ultra-easy monetary policy of the pandemic fades, will tight money and a shortage of capital benefit Canada government bonds equally with U.S. Treasury bonds. The current yield of a long Canada is 3.7%, more than 1% below the long U.S. Treasury yield of 4.8%. While we think that the long U.S. Treasury is now starting to look attractive, Canada is definitely a different matter. The current long Canada yield of 3.7% is under the current Canadian inflation of 4% and would only provide a 1.7% real yield if Canadian CPI drops to the BOC inflation target of 2%. That is considerably below the historical average real yield of 3.2%. The Canadian bond market consensus is obviously looking for lower CPI than its American cousin.
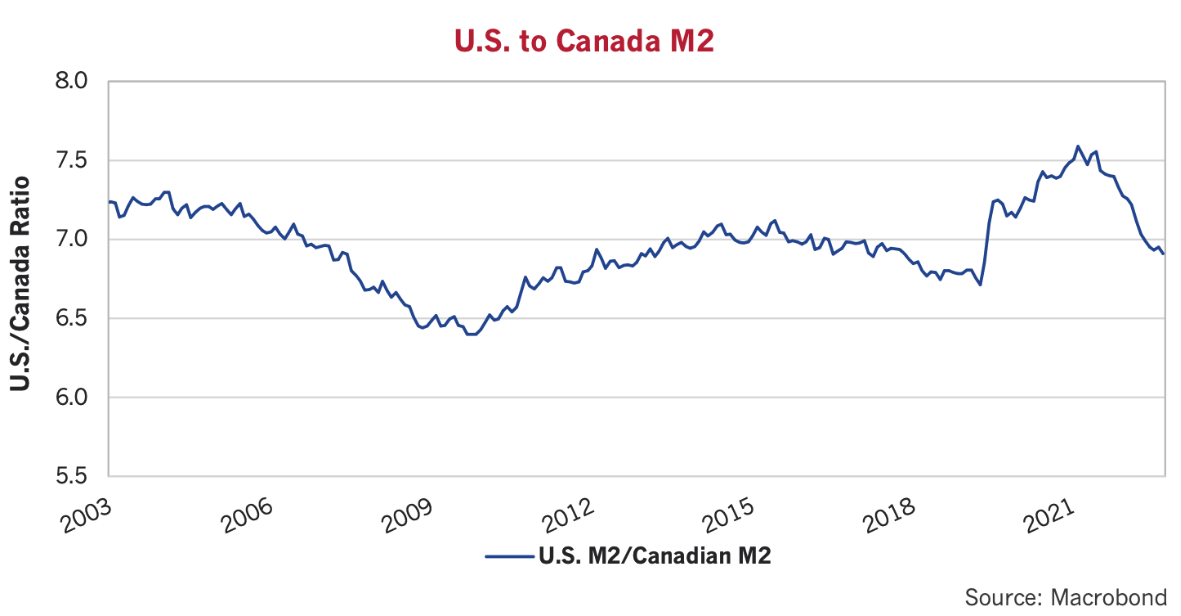
A Deserved Canada Premium?
Is the premium price or yield disadvantage of long Canadas justified versus the U.S.? We’ve done a bit of analysis and some thinking about this. If the U.S. expanded its money supply at a greater rate than Canada, then perhaps the Canadian dollar would be scarcer compared to the U.S. dollar and that might apply to bonds as well. The chart below shows that this is not true. The ratio of U.S. to Canada M2 was 7.2 times in 2003 and currently is 6.9 times. It fell to 6.4 times after the 2008 Credit Crisis but then increased to 7 times and then jumped much higher to 7.6 times in the pandemic, but now has fallen substantially back to 6.9 times as Canada created more M2 compared to the U.S.
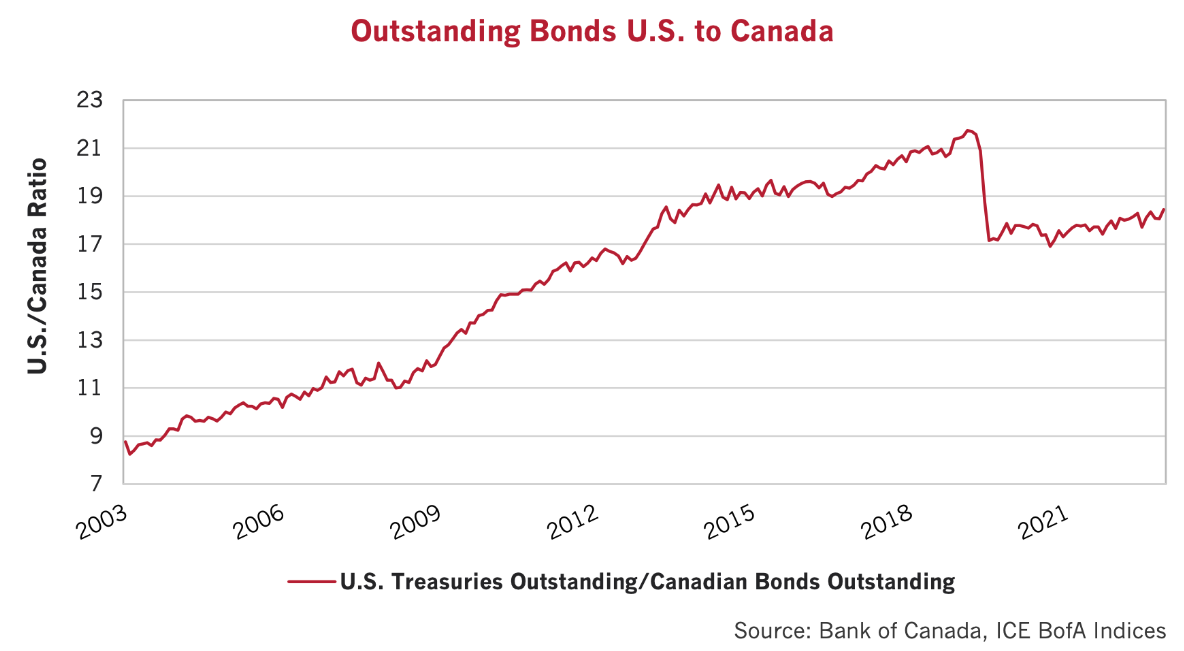
The next chart compares the ratio of outstanding U.S. Treasury bonds to outstanding Canada Government bonds. The idea is that if the stock of U.S. Treasury relative to Canadas increases, then the relative price of the U.S. Treasury should fall. We might be on to something with this. In 2003 there was 9 times the stock of U.S. Treasuries compared to Canadas. That increased to 15 times after the 2008 Credit Crisis and quantitative easing following the 2011 Euro Debt Crisis. It jumped to 22 times at the peak before the pandemic, but has now dropped back to 18 times, since Canada has issued relatively more bonds recently. That argues that long Canadas grew in scarcity compared to long Treasuries and might be the reason that the long Canada yield is lower.
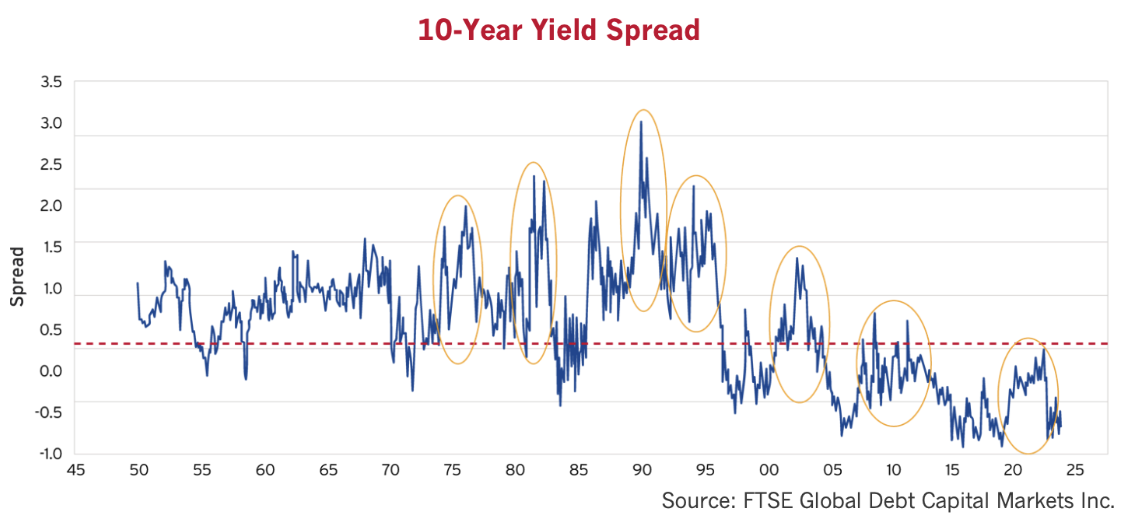
A Flight Risk?
We worry about the much lower yield of longer-term Canada bonds than U.S. Treasuries. The chart below shows the yield spread between the 10-year Canadian Government bond and U.S. Treasuries back to 1947. We used the 10-year spread because of its longer history. The chart shows an average 0.3% higher 10-year yield in Canada than in the U.S. over the last 76 years. It is currently -0.7%, far below the historical average. This concerns us, as we know Canadian bonds typically do not benefit from a “flight to safety” and underperform U.S. bonds in times of political and financial stress. We’ve highlighted some of these periods in the yellow circles. For a recent example, 10-year Canadas went from trading nearly 1% below U.S. Treasuries before the pandemic in 2019 to 0.3% above 10-year U.S. Treasuries by 2022. We are now back to an historically expensive -0.7% spread.
Our evidence of the relative attractiveness of Canada bonds and U.S. Treasuries is not conclusive, but we have to admit that our gut reaction is that longer-term Canadas are expensive relative to U.S. Treasuries. That makes us favour the shorter end of the Canadian yield curve where we think yields are sufficient for prospective inflation.
What are We Doing?
Yields have increased enough to better compensate investors and that has also lowered duration and the sensitivity of bond prices to changes in yield. That said, we are still below historical fair value, as we have discussed, and as the market has slowly and painfully been realizing. Unless inflation falls considerably from current levels, long bonds are not cheap. The bond market has been waiting to return to “normal” for a long time. Given that their sense of normal was developed in the most bizarre period of monetary policy in history, we fear they might be waiting for a long time.
A Fading Low Inflation Sensation
The markets have moved a long way from believing slightly higher rates will lower inflation immediately to the 2% target. We contrarily have believed it would take a long time to get inflation under control, and it obviously has. Inflation is falling in both Canada and the U.S., but the underlying situation is best described as “Sticky”. Bond managers and investment strategists wait breathlessly each month for evidence that the rampaging inflation Genie has been put back into its bottle. Bad news follows good news, exhausting hopes of quick return to the old interest rate normal, which was anything but normal.
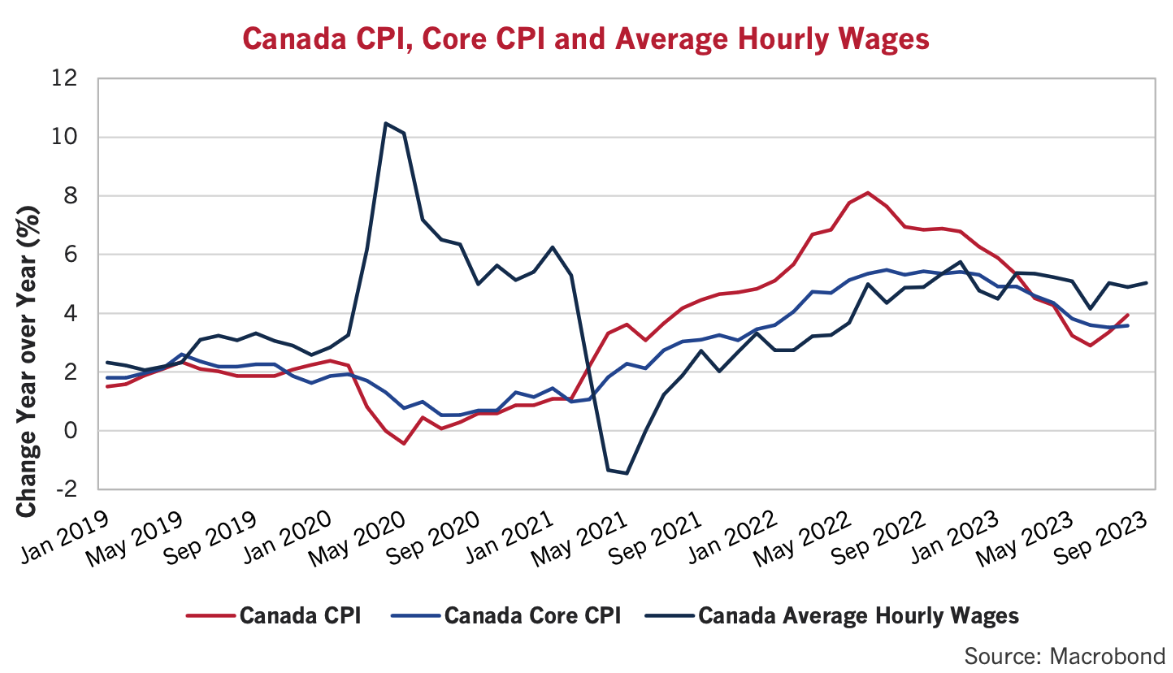
A quick look at inflation is instructive. We have plotted the monthly overall CPI, core CPI and wages for Canada in the chart below. This shows the problem of the Bank of Canada. While overall CPI has declined from its peak of 8% to 4%, wages are stuck at 5% and core CPI seems to be turning upwards along with the overall.
As we’ve seen, the Canadian bond market still hews to its 2% inflation forecast, despite most inflation measures stabilizing at 4%, double the Bank’s 2% target. Shorter bonds at over 5% have built some protection for sticky inflation at 4%, but long Canada bonds at 3.7% still provide a marginally negative real yield. We think that longer bonds still have some “correcting” to do, so we think long bond yields could rise while shorter bond yields hold steady or even fall. The idea of a “Bear Steepener” is just making it into the popular financial press and it has some merit. It also has the potential of drawing the next herd to gather, and that is something we are watching. For now, we have lightened up on our floating rate holdings and redeployed that capital into shorter fixed rate bonds. We also continue to like inflation-linked bonds, which are very cheap compared to their nominal cousins.
Monetary Tightening Doesn’t End Well
A monetary tightening doesn’t end well for risky financial assets, and this time will probably be no different. We still believe it is time to protect our portfolios and avoid uncompensated risk. We prefer higher quality to lower in our credit and equity portfolios as we “Batten Down the Hatches”. We might be wrong, but less liquidity means the downside is increasing for less liquid and lower quality assets. We prefer to have a good margin of safety in our investment portfolios.
There is always a risk that political and other factors could derail anything else.
Stay healthy and be steady in the face of the economic market and political turmoil that we see ahead.