

A Simpering, Whimpering Market Again??
We’ve used this musical theme in another Market Observer, but we can’t help using it again. One would think that Ella Fitzgerald was singing about our current financial markets:
“I’m wild again, beguiled again
A simpering, whimpering child again
Bewitched, bothered and bewildered – am I.”
Ella was languorously singing about infatuation, but she could have been singing about the lust of bond investors to go back to the glorious post-pandemic easy money days. Last time we focused on “Bewitched, bothered and bewildered” but now our thoughts turn to “A simpering, whimpering child again” when it comes to the current bond market consensus. Desperate for the days of 2% inflation and the ultra-low Zero Interest Rate Policy (ZIRP) yields that went with them, bond investors are already there, despite much evidence to the contrary.
Predisposed to ZIRP All
The chart below shows the bond investor predisposition to get back to a 2% inflation future. Inflation had been running between 1.4% and 3% during 2018 and 2019 with the Bank of Canada (BOC) raising short-term rates from 1% to 1.75% in its efforts to cool inflation. Before that, central bankers had been paranoid about catching the dreaded Japanese deflation disease.
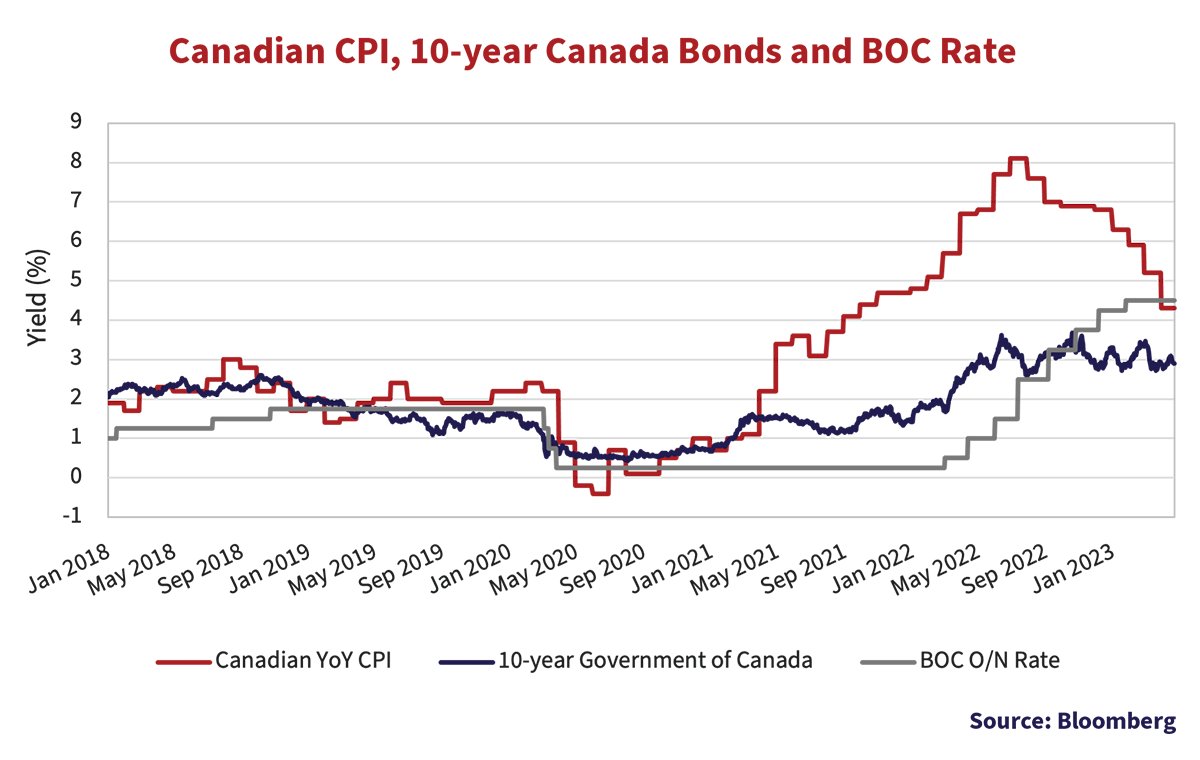
It took the Covid pandemic in early 2020 to really cool inflation down to -0.4%. The BOC and other central banks responded by once again creating copious amounts of cash and buying government bonds. This deflationary hysteria dropped yields back to near zero once again. The BOC rate ended up at 0.25% and 10-year Canada bond yield steadied out at 0.5%.
Just When You’ve Slain the Deflation Dragon
By the summer of 2020, the Deflation Dragon seemed slain with inflation creeping up to 0.5%. It then fell again to just above 0%, so the BOC stayed firm in its conviction that its major threat was still deflation. Despite inflation rising by the end of 2021 to 4.7%, the BOC was resolute in its deflationary fighting stance.
There wasn’t even time for the BOC to take credit for soundly defeating deflation before it became apparent that the problem was actually in the opposite direction. As fears of inflation took centre stage for Canadians, it took until the second quarter of 2022 for the BOC to admit grudgingly that inflation was not “transitory”. Canadian CPI reached 5% by the time the BOC started the process of raising rates. CPI peaked at 8.1% and has now dropped back to just over 4.3%. The 10-year Canada yield peaked at 3.7% and has now dropped back to just under 3% in a bondholder vote of confidence in the BOC.
Faith, Prayers and Belief in Inflation Miracles
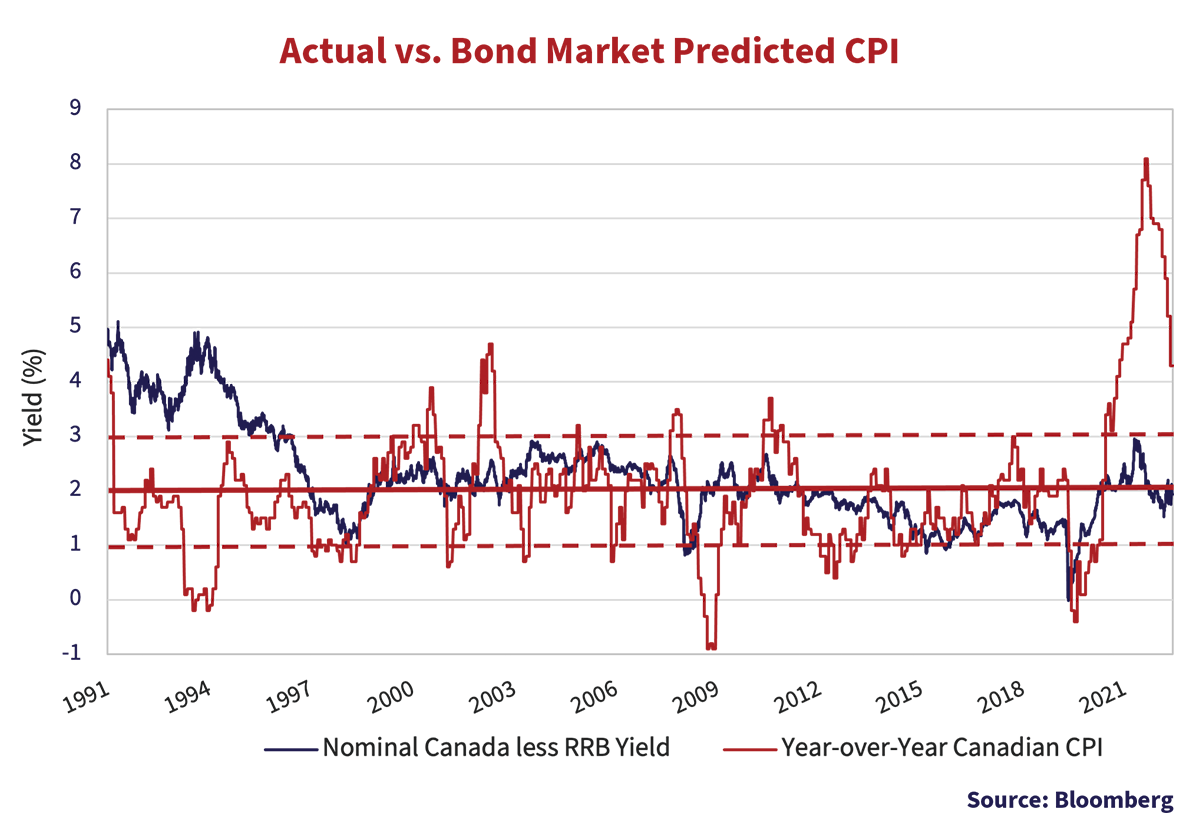
Clearly, a 10-year Canada bond yielding 3% is not a great bet if inflation stays at 4.3%. The holder basically locks in a return that is -1.3% in real terms. It takes considerable faith and prayer in the central bank gods to believe in inflation miracles, and that seems to be the case with the bond market. This can be seen in the graph above of the actual year-over-year CPI vs. what is predicted by the bond market using the yields of a Real Return Bond (RRB) and a similar term Canada.
The chart above shows the period since 1991 when the BOC implemented its 2% “Inflation Targeting” regime. The year-over-year Canadian CPI is shown in red and the average CPI over the period is the thick red line. The CPI has generally stayed within the 1-3% target band since then, averaging just over 2%. The Break-Even Spread (BES), the bond market’s expectation for inflation, is shown by the blue line. This is the difference between the yield on a normal or “nominal” Government of Canada bond and a similar term Canadian Real Return Bond, which represents the bond market’s forecast of maximum inflation.
A New Inflation Abnormal??
Inflation was not outside of the 1-3% target range for sustained periods. The post-pandemic period changed all that. This period of abnormal inflation has lasted far longer. The period of high inflation from mid-year 2002 to mid-year 2003 saw the CPI peak at 4.7%, 2.7% over the BOC target, only above target for 12 months. The period of very low inflation after the Credit Crisis saw a low of -0.9%, 2.9% below the target, and this period of low inflation lasted just under a year. The current period of high inflation started in May 2021, with a peak of 8.1%, 6.1% above target. Current inflation is 4.3% and we are now approaching 2 years above target.
Absolutely Terrible Forecaster
This chart also confirms that the bond market is an absolutely terrible forecaster of inflation. The BES forecasted inflation much higher than actual from 1991-1998. Bond managers feared the high inflation of the 1970s and 1980s would return and it took 7 years for the forecast inflation to approach actual inflation. We have seen the opposite in the 2 years since 2021, with BES forecasting inflation much lower than actual inflation. It took 7 years in the 1990s for forecasted inflation to approach actual inflation. Will it take another 5 years for today’s bond investors to eventually come to their senses like their predecessors?
The alternatives are not great. The human experts either believe that monetary policy has overcorrected and already put us in recession and deflation, or that we have lost control of inflation and monetary policy is far too loose. In the middle we have bond managers who don’t have a clue and are hugging their portfolio benchmark term and duration as closely as they can.
So, the real questions are, when will inflation fall, and what will it take to make that happen? As we’ve said many times since the pandemic, monetary policy is a potent tool that works. There is no question that extremely tight monetary policy would work its “bad magic” and cause a severe economic setback. The bond market has already impounded that. It has been predicting 2% inflation for most of the period since inflation exceeded 2% in May 2021. The exception to that was a peak forecast of 3% when actual inflation was 5.7% and rising.
A Monetarist Awakening
The good news is that central bankers seem to have recognized their error. The large amount of money they created has unleashed an inflation storm they weren’t contemplating, expecting or prepared for. Now their recessive Monetarist tendencies have been fully awakened, and after their very rough ride over inflation, they seem to believe once again that “Only Money Matters”. The bad news is that, as we have shown again and again, central bankers are only human. That’s the essence of the great monetary policy debate. Have central bankers done enough to get inflation under control?
A Graphic Tale
We believe that monetary policy and the credit cycle are powerful forces, but we suspect that things on the inflation front will be a lot more difficult than the fashionable market crowd suspects. The consensus believed for a very long time that excess money supply would not result in excess inflation. Now that we’ve had runaway inflation after the extraordinarily excess pandemic money supply after the pandemic, they still can’t bring themselves to believe that the current restriction of money supply is not disastrous.
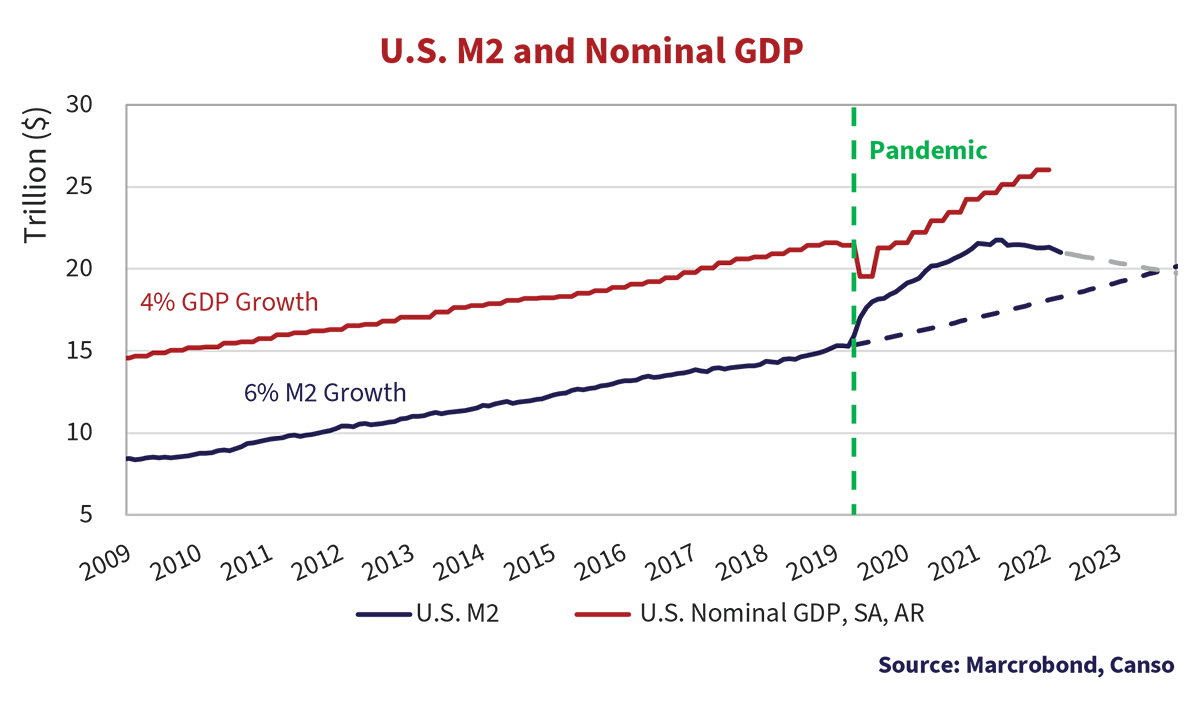
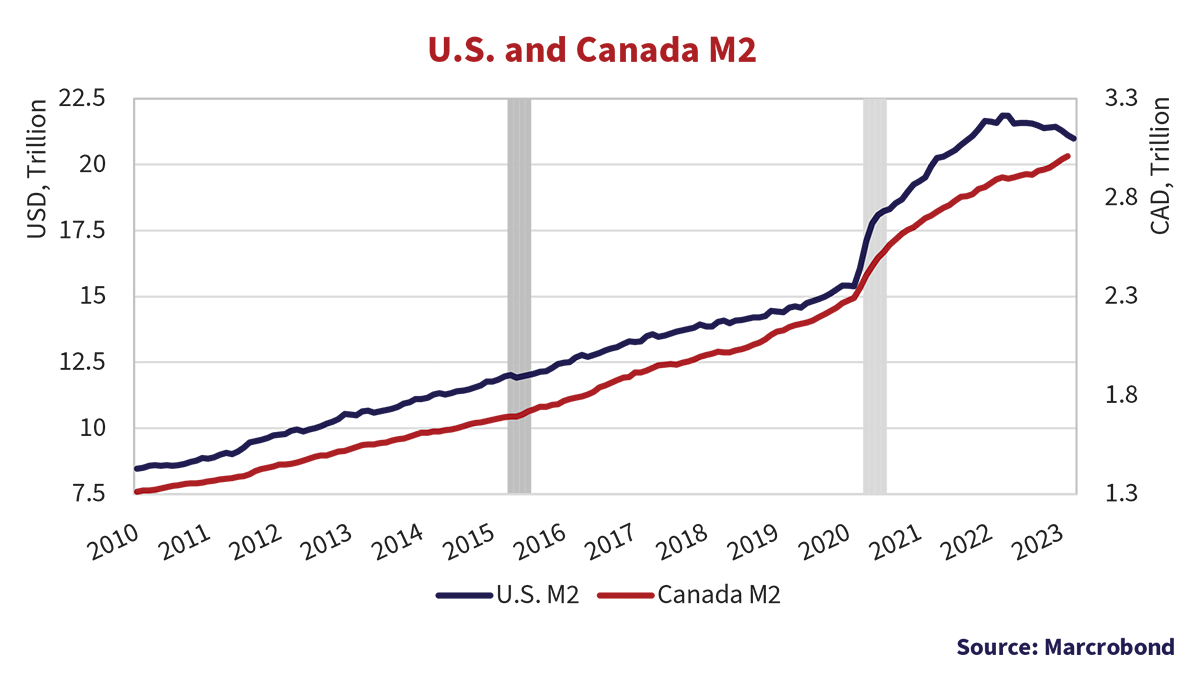
We could resort to Ouija boards, seances or a fortune teller to divine the course of monetary policy, but we prefer our own research. The chart above shows very graphically what happened to U.S. money supply during and after the pandemic. This chart shows that the annualized rate of increase in U.S. M2 from December 31st, 2009 to 2019 was 6%. That resulted in 4% nominal GDP growth. The jump after the pandemic that started in early 2020 is very evident. M2 moved from $15.4 trillion just before the pandemic in February 2020 to the peak of $21.9 trillion in March 2022, a 42% increase. The good news is that this monetary stimulus and U.S. government fiscal stimulus got U.S. nominal GDP rising again. The bad news is that, if “Only Money Matters”, an increase of 42% in U.S. money supply should increase prices. U.S. CPI averaged 1.6% from 2009 to 2019. That changed when money was directly given to consumers during the pandemic, rather than directed at incompetent bankers to help them escape default.
At Canso, we thought this time around there would likely be inflation as a result of that huge increase in money supply. This was actually the case, unlike other times central bankers ran to the sound of economic gunfire. The U.S. CPI Index was 258.7 in February 2020 and was 287.5 in March of 2022, at the peak of money supply, an increase of 11.1%. The March 2023 CPI Index was 301.8, a further increase of 5%, despite the drop in U.S. M2. That’s a total 16.5% in the CPI from just before the pandemic.
A Big IF
In our chart above, we have continued the 2010-2020 growth of 6% in U.S. M2 money supply. It is very clear how much pandemic money supply growth departed from its previous trend. It is also pretty clear that money supply is now being reduced or, euphemistically, “liquidity is being removed”. We’ve calculated that as well, and it annualizes out to a -3.7% reduction in money supply since the Federal Reserve started raising rates in June 2022, which we have also plotted. At that rate of reduction, we show when M2 will get back to the prior trend, which looks to be somewhere around July 2024, over a year from now. At that point, if the Fed resumes its prior rate of money supply growth, and that is a big IF, with all other things being equal, things should get back to “normal inflation”.
OH, Canada
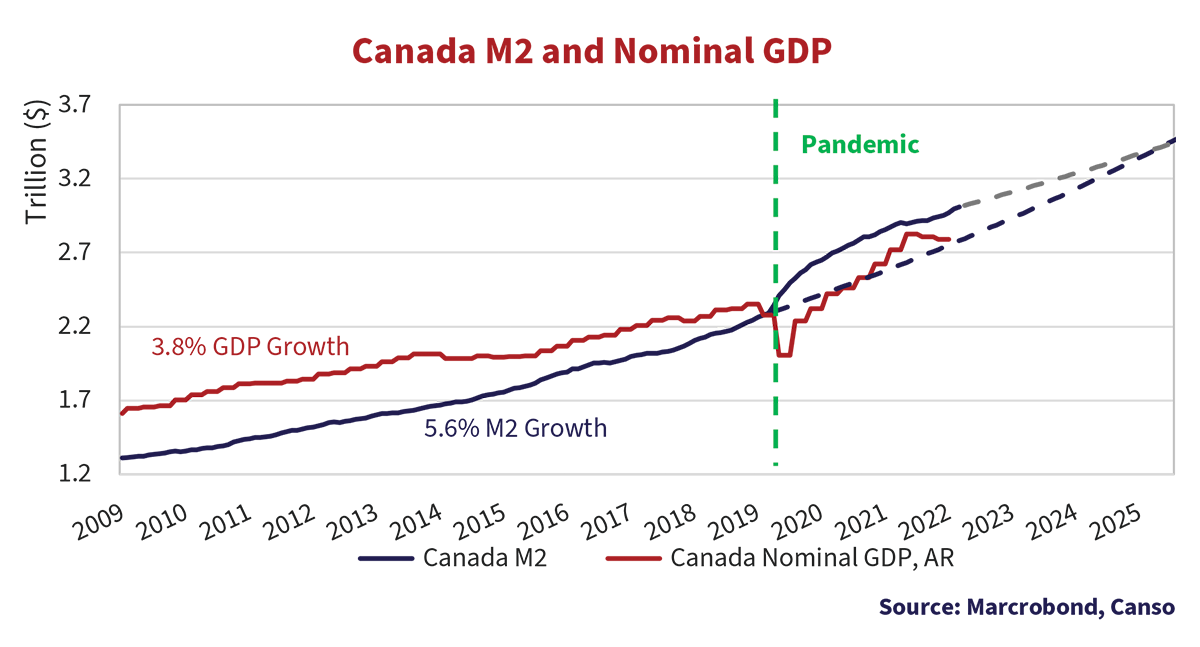
We have also plotted Canadian Nominal GDP and M2 on the chart below. Canadian M2 grew at 5.6% from December 31st, 2009 to 2020, but jumped sharply after the Covid pandemic began. Canadian GDP dropped but recovered. The interesting thing about this chart is that it shows Canadian GDP was higher than M2 before the pandemic but has been lower ever since. As Canadian M2 is still growing, it looks to us that we will not get back to “Normal” money supply for quite some time.
To Grow, Or Not to Grow
The graph below of U.S. and Canadian M2 shows the difference in monetary policy. U.S. and Canadian M2 were growing at reasonably similar rates until the pandemic. Now, the U.S. has actually reduced money supply since the peak, but Canada is still increasing M2. The U.S. Fed and the BOC both use “open market” operations to achieve their targeted interest rates. They remove money to increase interest rates and supply money to decrease interest rates. The BOC’s “pause” in rate hikes has meant that it has had to supply money to prevent rates from rising beyond its target.
Going Against the Ingrain
The real problem, as central bankers are well aware, is if inflationary expectations become “ingrained”. Employees are consumers, and in the U.S., they have seen the 16.7% increase in CPI and the resulting fall in their purchasing power. If you’ve had a 2% annual wage increase for the 3 years since the pandemic started in March 2020, then you’re up 6.1%, but behind by 10.6% in real terms. That’s the problem. Central bankers and financial bureaucrats might want everyone to “take one for the team” and accept lower real wages until we get back to 2% inflation, but rational economic agents should be striving to get their real incomes back up.
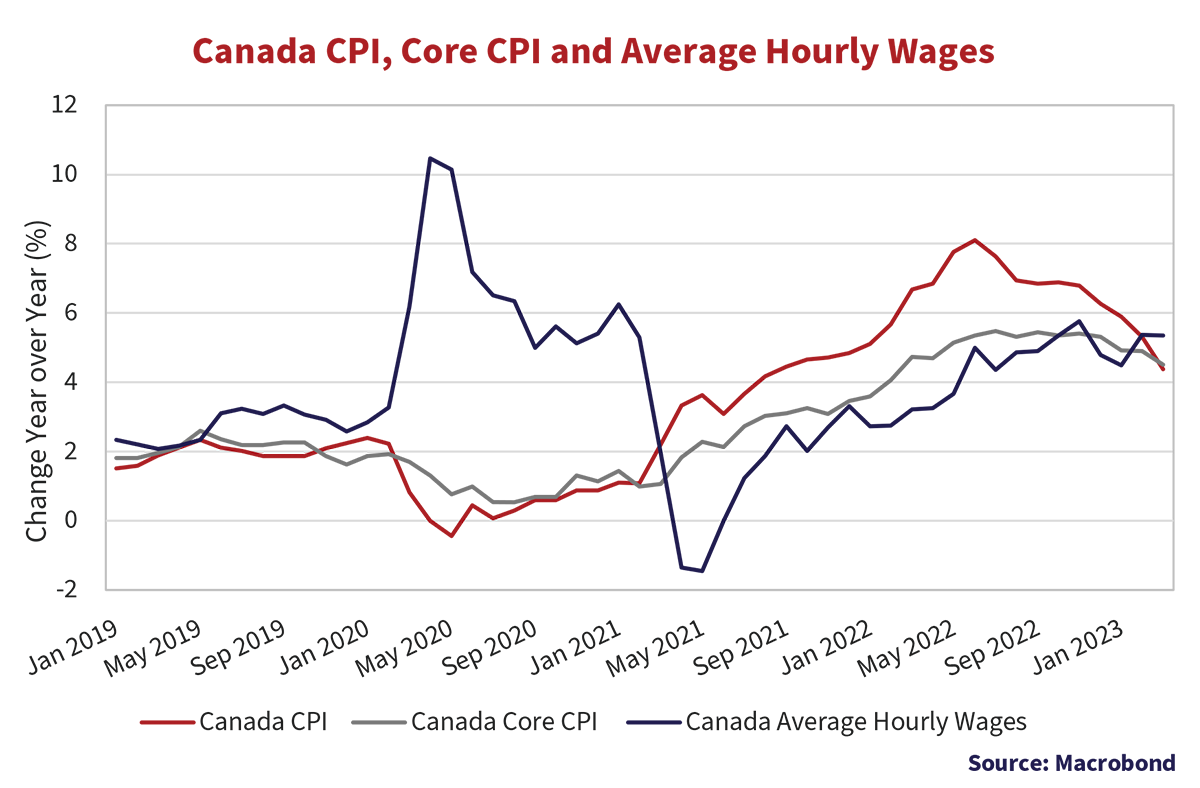
We see this in Canada with the strike of Federal government civil servants, who have seen their pay raises fall far behind the rising price level. They’re looking to catch up for sure, asking for 4-8% annual wage increases. Private sector employees have had 4% wage increases in the past year, as can be seen in the chart below, and the civil service union leaders are pointing this out as part of their negotiations. The overall Canadian CPI is moderating due to falling goods prices, but core CPI, due to services and wages, is staying high. Since labour is a much more important cost component for the service sector, one would expect wages and service sector prices to be similar, which is also shown in the chart.
The Grinch Who Gave an “Orr-Full” Christmas
As we tell you frequently in this newsletter, more money is always more popular than less money. Printing money and rescuing the financial system and economy from disaster is the stuff of monetary superheroes. Making money scarce and causing recession is the recipe of a financial villain.
Scarce money will never be popular, but central bankers seem more than a little tone deaf with their delivery. Adrian Orr, the Governor of the Reserve Bank of New Zealand asked Kiwis just before Christmas to take one for the team. His parting remark at the press conference following his November 23rd monetary policy decision, in which he raised rates by 75bps, was to wish New Zealanders a “sensibly spending Christmas”. Commentators joked that the Governor had gone “full Grinch”, and had “set the table for an Orr-full Christmas”. In the same briefing, Orr also commented that everyone needed to trim back their wage demands with lower pay raises and for employers to trim back their price hikes. “People could just start expecting lower inflation in the future and start working that way. The power is in the hands of the people if you just start behaving 1% different around inflation expectations and wage growth then our job is easier”.1
Clearly, Orr is so removed from normal people that he doesn’t have a clue about how to explain his policies to them. Wage and price controls were difficult in the 1970s when governments imposed them to defeat inflation. They didn’t work then, and asking people to self-impose them now is rather bizarre, given their personal financial situation. What seems like a good PR strategy in the boardroom of a central bank seems more than a little daft on main street!
Not Spreading Recession
So, when will we know if the central banks, and the BOC in particular, have done enough? We watch for signs of recession, and credit spreads have been a very consistent indicator of the financial stress of issuers. If internal cash flows are falling, an issuer needs to issue more bonds which leads to more supply and wider spreads, and bond investors are perhaps experiencing troubled issuers within their own portfolios. The graph below shows Canadian recessions in the shaded grey areas. The red line is the yield spread of the FTSE Canada Corporate Bond Index compared to the Canada Government Bond Index and the blue line is the spread between BBB and the Canada Government Bond Index. The grey line is the “quality spread” between the yield of a BBB and A-rated bond.
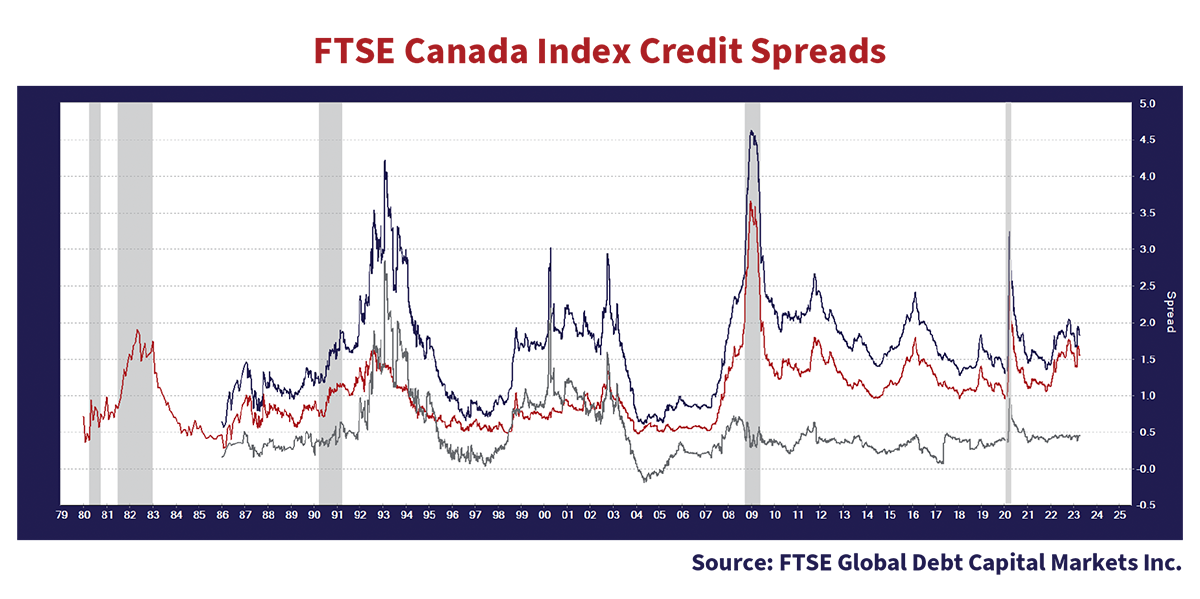
One can see why we at Canso put faith in the value of corporate bond yield spreads as a precursor of recession. We’ve had yield spreads trend up without recession, but we’ve never had a recession without yield spreads trending up, usually well before the recession. On this measure, both the overall corporate bond and BBB yield spread has trended up recently, but the quality spread between BBB and A-rated bonds is not showing signs of stress.
Taking Stock of Stocks and Junk Bonds
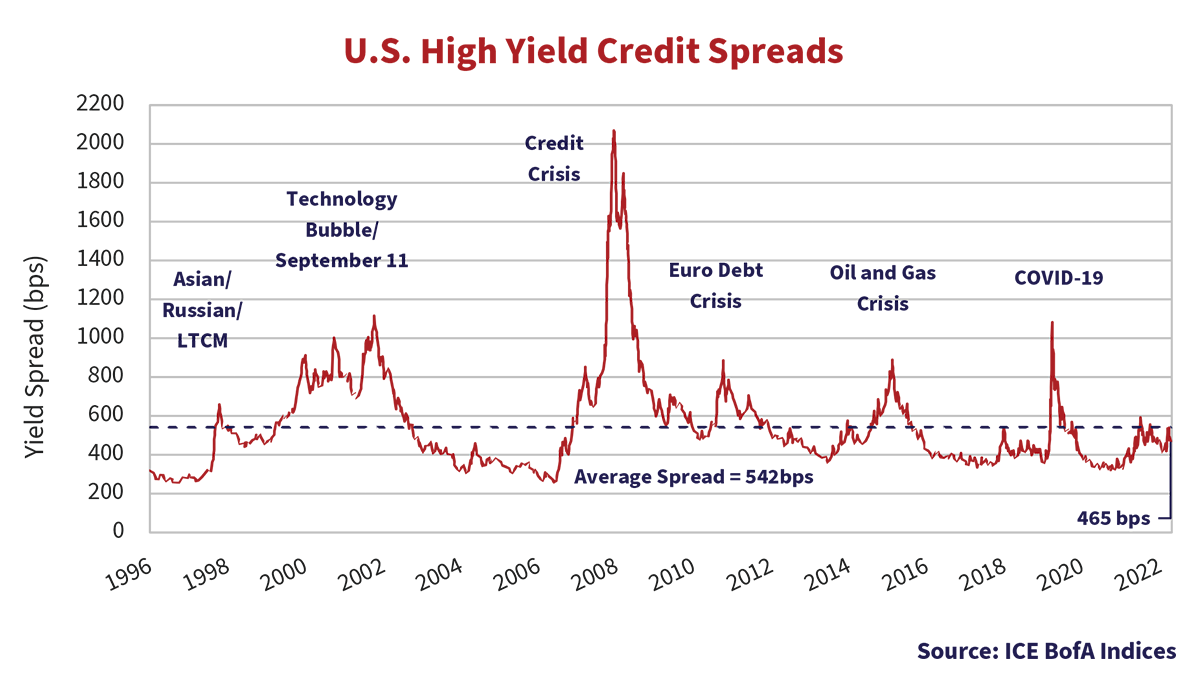
The stable A to BBB quality spread suggests to us that the recent bank run crisis elevated all corporate bond spreads, not just banks. Bond investors have not yet started to worry about lower quality bonds, as this spread suggests. Turning to the U.S. high yield market of lower quality bonds, the chart below suggests that investors are not worrying about corporate credit quality. The spread on the ICE BofA U.S. High Yield Index is 465 bps, higher than the salad days of the Federal Reserve buying junk bonds during the pandemic, but just about the average spread since 1996.
There doesn’t seem to be a lot of pain contemplated in financial assets other than government bonds. The stock markets are also staying well behaved. The U.S. S&P 500 Index is up 8.2% year-to-date, and only down 1.6% year-over-year, so things don’t look so dire on the equity front. Leveraged loans and bond defaults are also well behaved.
Strictly Stricture
Another portent of recession is the shape of the yield curve. Many economists and strategists look at the inversion between short and longer-dated bonds as evidence of a coming recession. Certainly, that gets a lot of financial media attention. As we said earlier, we don’t agree that longer-term bonds anticipating 2% inflation are the best financial forecaster. We believe the financial stricture of tight money and a lack of credit is a better gauge of economic health.
The chart below shows the yield spread between 2-year bonds and the BOC rate. This represents the additional yield available to an investor by going out the yield curve from floating rate to a 2-year bond. When the 2-year yield is 2% above the BOC rate, it indicates loose monetary policy and easily available money. This also represents a very “normal” yield curve and an indication that investors believe the economy is in good shape and short-term yields will rise. They are content to stay in a longer-term bond for the extra yield and accept the risk of inflation, believing they are well compensated for that risk.
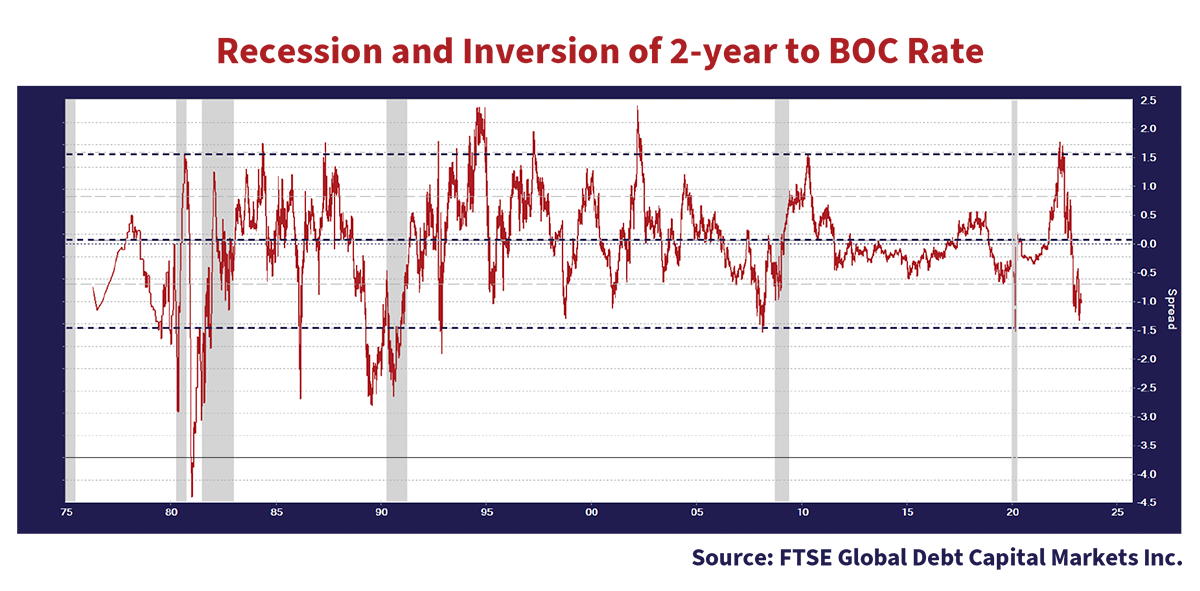
On the other hand, when the BOC rate is well above a 2-year bond yield, it represents very tight monetary policy, an actual shortage of money and credit. That results in an inverted yield curve, as investors believe the economy will weaken and short-term rates will fall as the BOC eases. Because of this, they believe they are better off locking in the lower yield of a 2-year bond to avoid riding down falling rates. It also shows that treasurers rolling over short-term debt will pay whatever the market dictates if default is their alternative.
Seldom Average
Looking back at the chart, on average this spread between the 2-year and BOC rates is very small at 0.06%, but it is very seldom at that average. Like a navigator plotting his course on a chart, the ship is very seldom actually right on course, it deviates from side to side. In the case of the good ship monetary policy, it is rarely on course and wildly swings over and under what is necessary. We have plotted the 66% band of 2 standard deviations from the mean of 0.06%. It now shows that the current -0.95% is nearing the danger zone of -1.5%. Given that bond investors believe that inflation is already at the 2% target, a good 2.3% below actual inflation, the value of the bond market’s opinion on the yield of a 2-year bond could be questioned. Inspection of the chart shows that the prior inflationary periods of the 1970s and 1980s saw inversions of -3% to -4% before the BOC relented due to the economic mayhem it had caused.
Higher for Longer
Putting this all together, our take is that the BOC and other central banks are bleeding off money, but it seems to us we’re still a long way from scarce money and relenting. After their giant mistake of waiting too long to raise rates after the pandemic, central bankers are likely to overcorrect in the opposite direction. That means we think it is highly unlikely that they will relent until well after inflation hits their target band around 2%, so interest rates could stay higher much longer than the bond market consensus believes.
Questionable Banks??
In the aftermath of the Silicon Valley Bank and Credit Suisse bank runs, we have been fielding calls from clients questioning the banking sector, particularly Canadian banks. The main argument against Canadian banks centers around Canada’s inflated housing market and the banking sector’s exposure to residential mortgages. If home values fall and defaults rise, banks will inevitably experience losses.
We have worried about the Canadian residential real estate market for many years. We published a Position Report on Canadian Housing in 2013 that argued Canadian housing was overvalued and the impact of falling home prices could affect our economy, especially given Canada’s reliance on housing as a primary engine of economic prosperity. We were wrong, very obviously and very publicly.
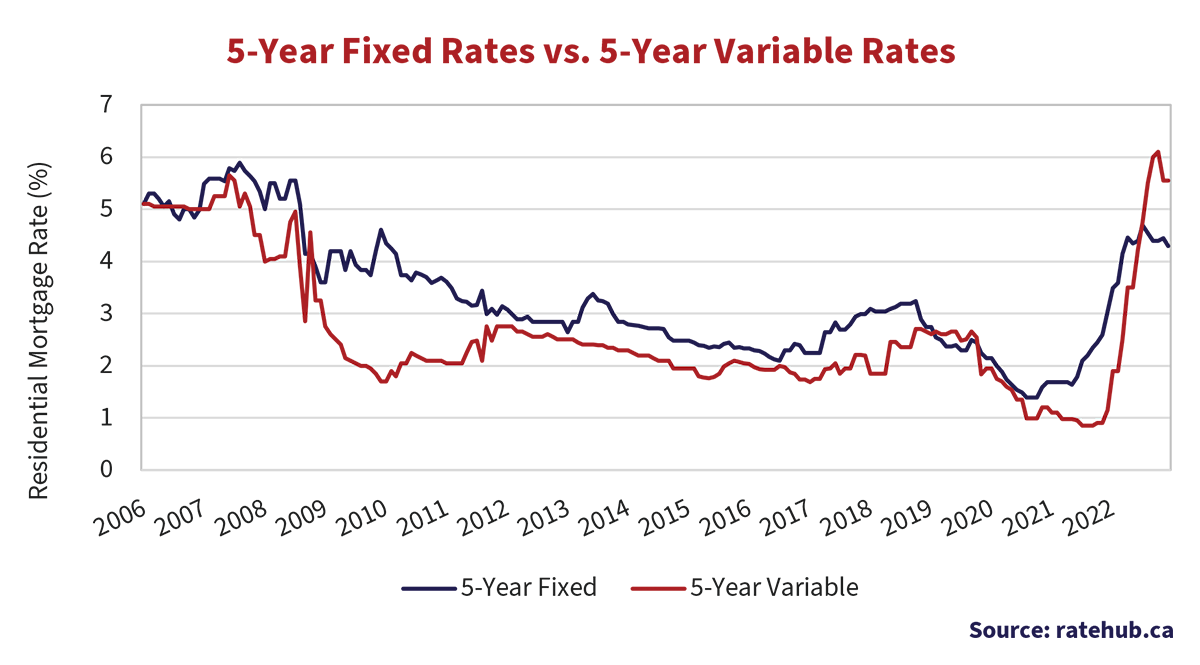
We don’t mind being wrong for the right reasons. The major reason we were wrong was that instead of interest rates “normalizing”, they were taken to almost zero by central banks, including the BOC, as the chart below shows. Five-year fixed rate mortgage rates fell from 3.5% when we did our analysis, to 1.5% during the pandemic. Floating rate mortgage rates fell from 2.5% to below 1%. As we said in 2013, housing prices are inversely correlated to mortgage rates. It is not happenstance that the peak housing prices came with the low interest rates during the pandemic.
Mortgage rates have risen significantly from the pandemic lows, and now that we’ve had a protracted period of much higher mortgage rates, many of the issues we highlighted are germane once again. Reports of widespread mortgage fraud are back and developers struggling to fund completion of projects. Private mortgage lenders, the last resort for distressed borrowers, are pulling the plug on funding.
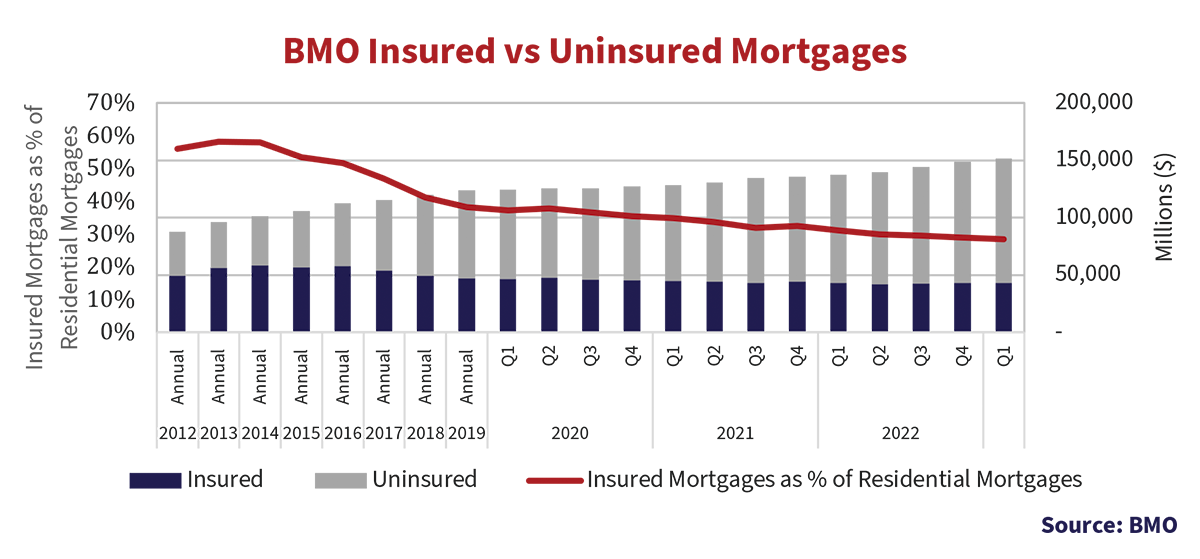
Things are actually worse now than in 2013 in terms of Canadian bank exposures. When we wrote our Position Report, banks were far more insulated from housing distress as approximately 60% of their mortgage exposure was insured against losses by the government. CMHC tightened up on the amount of insurance that major banks can use and now that number is closer to 30%. This is shown in the chart below of BMO’s mortgage portfolio. They had $56 billion or 58% in insured mortgages out of their total mortgages of $96 billion in 2013. BMO’s insured mortgages dropped to $43 billion in 2022, only 29% of their much larger $106 billion mortgage portfolio.
The Canadian residential real estate and mortgage industry is currently going through an “exogenous shock”, as an economist would say, due to the normalization of interest rates. The price of mortgage credit has jumped up with the normalization of bond yields. If you’re a Canadian homeowner who went for a 5-year mortgage five years ago in 2017, you are in for a shock when you come up for renewal. Your rate has gone from 3% to 5% and your payment will increase by about 18%. Any homeowner who borrowed at the lowest 5-year fixed rate in January 2021 at 1.39%, is desperately hoping rates fall before 2026, since today’s rates would cost them an additional 37% per month.
Not a Brilliant Plan
If you’re lucky, you could be one of the people who’s had their friendly bank “extend amortization.” The majority of variable rate mortgages in Canada have fixed monthly payments. Instead of the mortgage payment adjusting higher each month with rising interest rates, the percentage of the payment that goes towards interest increases, while the amount that pays down principal decreases. This has the effect of increasing the amortization of the mortgage. Canadian banks went from reporting no mortgages on their books with amortizations higher than 30 years, to now having 30% of their books with this exposure. Some Canadians’ amortizations have extended to over 80 years.
This game might be over, as OSFI, the Canadian bank regulator, is now considering telling banks this is not a brilliant plan to reduce financial risk. Who knew?? In any event, borrowers face the prospect of significantly higher payments when they are required to return to the initial amortization. We calculate that a borrower who took the 0.85% variable rate offered in 2022 would have a 90% increase in their payments when they renew in 2027, assuming variable rates stay put.
Yet despite all of the above, delinquency rates in Canada have barely budged off historic lows, as seen in the following chart. Things can change quickly, moving from 0.18% in 1990 to 0.65% by 1992. Despite a few bumps along the way, arrears have dropped since then. Rising house prices have kept arrears low and under control, except for the 2008-2011 period of rising rates when they almost doubled from 0.25% to 0.45%. The period of ultra-low interest rates that started with the Euro Debt Crisis in 2011 fixed that, and arrears dropped to the recent record low of 0.14%, lower than 1990.
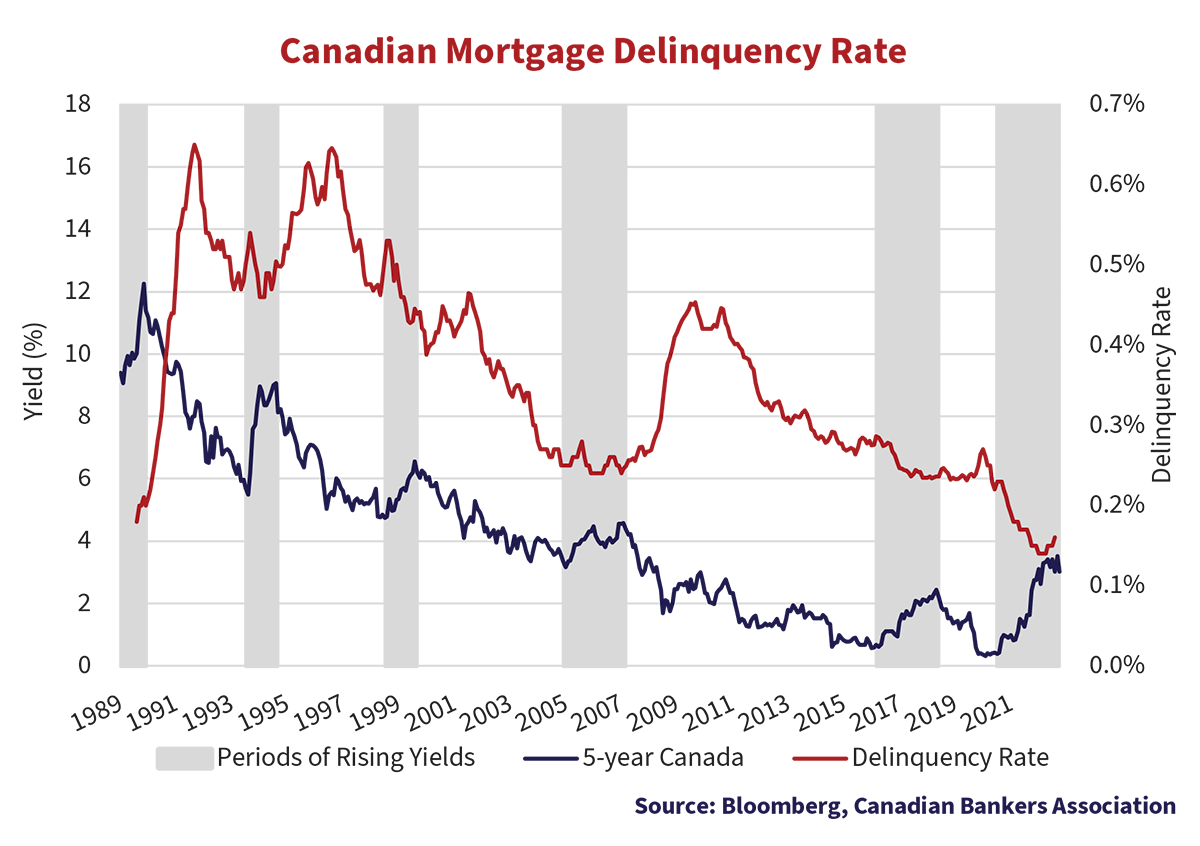
The long-predicted setback in Canadian real estate now seems to be happening. Mortgage arrears are now growing once again, as interest rates rise and borrowers struggle with the very high mortgage debt that comes with very high house prices. The last time we went through a protracted period of falling house prices was in the early 1990s, and mortgage arrears and loan losses soared. Private mortgage insurer MICC went bankrupt and government-backed CMHC needed help from the Federal government. Given Canadian banks’ increased exposure to uninsured residential mortgages, their residential loan losses will increase, and their profits will suffer.
A recent Globe and Mail article on Canadian mortgage insurer Canada Guaranty Mortgage confirmed the problems:
“Disclosures from Canada Guaranty Mortgage Insurance Co. show its proportion of loans with an estimated LTV ratio above 100 per cent increased by more than six times to nearly $4-billion in the fourth quarter of last year. That represented 5 per cent of its outstanding insured mortgages for individuals, according to Canada Guaranty’s quarterly portfolio metrics.
That is up from $532-million, or 0.74 per cent of its outstanding insured mortgages in the fourth quarter of 2021, according to the disclosures.”2
That all said, Canadian banks continue to earn significant risk-free profits on the 30% portion of their mortgage book that is insured. The Federal government extended assistance to Canada’s banks during the 2008 Credit Crisis with its Insured Mortgage Purchase Program (IMPP) and would likely to do so again. This assistance quickly gave the Canadian banks liquidity and risk-free profits to shore up their balance sheets. If a government wants happy voters, a dire and messy residential housing market is not their chosen strategy.
Is Our Money at Risk?
The Canadian banks benefit from the implicit and symbiotic support of the Federal government, and their oligopoly that curtails competition. While a downturn in Canadian housing and recession could lead to lower profits, we believe the risks are less than the Credit Crisis of 2008. Bank regulations have been substantially tightened since then, improving liquidity and limiting very risky capital markets activity.
That said, a run on any bank is just that, a loss of confidence where depositors believe their money is at risk with that bank. If you only have 10% of customer deposits on hand in cash and everyone wants their money back at once, that’s a problem. Credit Suisse’s customer base was wealthy international money that took flight once they sensed trouble. We believe the Canadian banks’ deposit base and franchises are more stable.
Historically, Tier One (T1) capital securities of Canadian banks traded at very tight levels to their senior unsecured bonds. These T1 securities would have been converted into Preferred Shares if the bank actually failed. At the time we did not think that low spread was worth the risk. Once T1 became distressed, we made considerable money on various global bank T1 and subordinated debt over the years.
After the Credit Crisis, the global regulators forced banks to issue “Bail-In” senior debt and created Additional Tier One (AT1) securities that could suffer large losses at the point of “Non-Viability”, called Non-Viable Contingent Capital (NVCC) bonds. A version of these bonds were wiped out in the Credit Suisse debacle, and that put all AT1 under suspicion. In our view, the problem was that the holders of the Swiss Contingent Convertible (CoCo) bonds had not read the fine print and did not understand the risks they were taking. A bond is a contract and if the contract says you can be wiped out, don’t complain about it. We accumulated and held the Bail-In senior unsecured bonds of Credit Suisse, which we made money on, but we did not hold the CoCos based on our analysis and understanding of the downside.
Our Canso investment team understands risk and prices it. We have extensive experience and success with various classes of bank securities. We believe that the current trading levels of the Canadian AT1 Limited Recourse Capital Notes (LRCNs) are reasonable compensation for their risk, as they are now trading at very high yield levels to call and/or maturity. They provide for forced conversion into equity at non-viability and OSFI, the Canadian bank regulator, has confirmed this. This would cause massive dilution of common shareholders and AT1 bondholders could end up controlling the bank. There would be considerable uncertainty and downside to the AT1 of a troubled issuer, but there would be the upside of getting the equity at distressed levels. We saw much higher yields and lower prices for junior bank securities during the Credit Crisis, so a buyer must be aware that there might be substantial downside before any upside.
What is Tight??
In conclusion, we still believe that things will get worse before they get better if central banks continue to raise interest rates. The whole point of “tightening” monetary policy is to reduce the availability of money and credit in an economy and slow inflation down as economic activity drops. The current debate rages around what is actually “tight”. The bears in the negative camp for the economy believe enough has been done. We are not so sure. Currently, Toronto real estate agents are again holding bidding wars for attractive houses. It would seem their clients have adapted to higher rates quite nicely in their frenzy to buy a house.
The bond market is already anticipating 2% inflation, but if that’s not the case soon, then it is more likely that higher yields are ahead than lower. It might take some time, as in the case of the bond market’s overestimation of inflation in the 1990s. The good news is that the current level of short-term yields is appropriate for 2% inflation. The bad news is that Canadian long bonds at just below 3% don’t have a lot of upside, even if we miraculously hit 2% inflation very quickly.
Clear As Mud
That makes us favour the short end of the yield curve over the long end. We also believe that inflation-linked bonds, after perversely handing losses to investors with the highest inflation in years, are looking very cheap to us. If the Fed, BOC and other central banks stay on the path they’re on, then there will inevitably be a recession. That makes us cautious with our credit portfolios.
As ancient soothsayers used to say about their crystal balls or braziers full of chicken bones in movies, “all will soon become clear”. Right now, things are as clear as mud, so we’ve got our boots and rain gear ready to go, still prepared for heavy weather ahead!