INFLATION AND FINANCIAL ASSET PRICES
Wild swings in asset prices have seemed to have become the norm in financial markets lately, even in supposedly “safe” asset classes such as fixed income. The source of this volatility can be traced to inflation, which in June 2022, peaked in the US at a level of 9.1% on a year-over-year (“YoY”) basis, a level not experienced in North America in over 40-years.
The key link between inflation and financial asset prices is the overnight interest rate (“overnight rate”), which is determined by the central bank – in the US, the Federal Reserve (“Fed”).
The overnight rate is the primary policy tool used by the Fed to maintain inflation at a target rate of YoY 2.0%. If inflation is too high, the Fed will raise the overnight rate to encourage less inflation, and if inflation is too low, the Fed will lower the overnight rate to encourage more inflation.
The overnight rate is also a key input in valuing financial asset prices. In general, they exhibit an inverse relationship, that is, financial asset prices tend to increase when the overnight rate
decreases, vice versa, financial asset prices tend to decrease when the overnight rate increases.
A reason for the wild swings in financial asset prices could then be explained by investors attempting to position their portfolios ahead of expected changes to inflation, as the path of inflation should dictate the level of overnight rates and consequently the direction
of financial asset prices.
As readings on inflation are only released monthly, investors will tend to trade on other economic indicators tied to inflation. However, as economic indicators are prone to change, so too do investors’ expectations.
BULLS AND BEARS
With issues related to financial markets there is often a “bull-case” (i.e. positive for financial asset prices) and a “bear-case” (i.e. negative for financial asset prices). Common bull-case and bear-case narratives can be described as follows:
- The bull-case, a “soft-landing”: generally characterized as a return to YoY 2% inflation, declining overnight rates (also termed as a Fed “Pivot”) and increasing financial asset prices.
- The bear-case, a “hard-landing”: generally characterized by more persistent elevated inflation above YoY 2%, higher-for-longer overnight rates and lower financial asset prices.
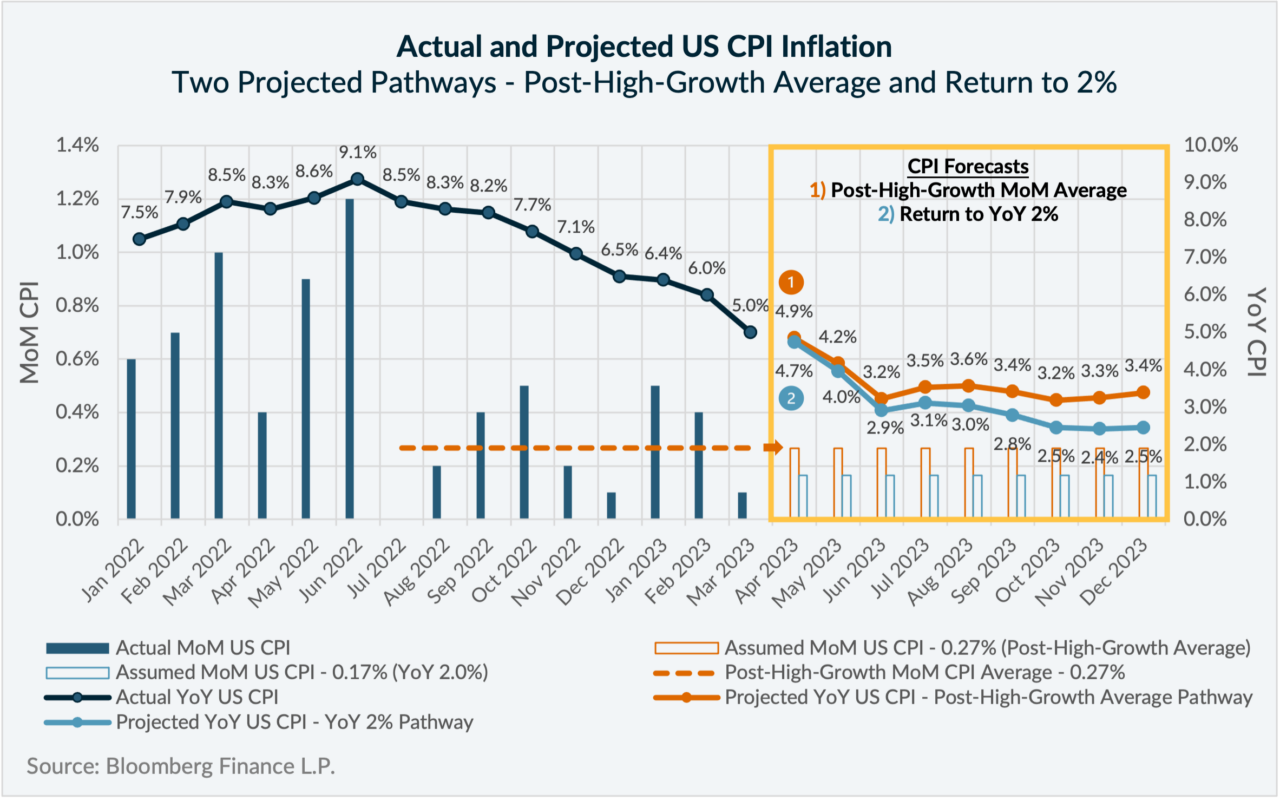
As inflation is a primary catalyst to driving both scenarios, to help contextualize the likelihood of each case playing out, we have conducted the following forecast of future inflation based on two possible scenarios:
- Post-High-Growth MoM Average (bear-case) – Month-over-month (“MoM”) inflation will continue at the average level it has been post the YoY inflation peak in June 2022 (0.27%).
- Return to YoY 2% (bull-case) – MoM inflation returns to a level consistent with YoY 2.0% inflation (0.17%).

KEY TAKEAWAYS
Based on the YoY inflation forecasts in the chart, there are two key takeaways to consider:
- YoY US inflation should reach a steady-state level after June 2023 because of the base-year rolloff of high-inflation months.
- The path back to YoY 2.0% could take time and is not for certain.
BASE-YEAR ROLL OFF OF HIGH-INFLATION MONTHS
Monthly declines in YoY inflation will likely diminish after June 2023 in both scenarios because of the base-year roll-off of high-inflation months.
YoY inflation is measured as the percentage change in the CPI Index value from a given month relative to the same month in the prior year. As YoY is a fixed measurement period (i.e. 12-months), when a new reading is released, a new month is added to the measurement period; at the same time, a month is dropped off the back of the measurement period and a new base-year is established.
As illustrated in the chart, the MoM change in inflation (the bars in dark blue) experienced high growth up until June 2022, and lower-growth following June 2022. This is why there is a natural downward bias to the monthly change in YoY inflation, as new lower-growth monthly inflation readings are replacing older higher-growth months – this will end after June 2023.
CONCLUSION
The future path of inflation, of course, remains unknown. Economic data releases tied to inflation will likely continue to fluctuate, which will contribute to further financial asset price volatility as bull and bearmarket narratives play out in the marketplace.
One thing is for certain is the Fed’s stated commitment for YoY inflation to return to its 2.0% target. Based on the projections in the chart, we are not on course for a return to YoY 2.0% inflation if we maintain the average level of MoM inflation readings going forward. Even if MoM inflation readings were to be congruent with a return to YoY 2.0%, we would not reach that level until some time into 2024.This does not present a compelling case for a quick “pivot” in Fed overnight rate policy.
While persistent asset price volatility may present a challenging environment for some investors to navigate, it could also present an attractive environment for experienced, active portfolio managers, to add value to their investment portfolios.