The Federal Reserve’s dot plot was created in 2012 post the financial recession of 2008 / 2009. In 2012, like recent times, interest rates were virtually at zero.
The dot plot was created to give Fed followers an advanced look at what Fed officials were thinking before they made any official interest rate decisions. In the decades prior to the financial recession, there was never any formal interest rate guidance given by the Fed. Market participants were left to their own devices to predict the path of interest rates. A foreign concept for any young analyst / portfolio manager that has entered the market in the last 10 years.
However, with an abrupt change in the inflation picture over the last year and a blood bath in traditional fixed income indices in the first quarter of this year, markets are grasping for guidance. Unfortunately, they will not find it in the Fed’s dot plot.
With what appears to be the great “pivot” to a higher rate environment, the market can no longer take comfort from Papa Powell. Even last summer the Fed chairman stated that “Dots are to be taken with a big, big grain of salt…The dots are not a great forecaster of future rate moves.”
As highlighted in our previous commentary, the combination of ultra-low rates, work from home rules, and fiscal support for consumers created fantastical valuations in the affectionately labeled “meme” stocks. While these companies represent a small part of the equity market, recent earnings reports from large S&P 500 companies have emphasized the pressure of supply chain problems as well as higher material and labor costs. Equity investors have taken notice of these margin dampers with the S&P 500 index down over 13 percent to the end of April this year.
Crucially, the Fed Funds rate is still only at 0.75 – 1.00 %. Expectations are for it to reach 2.5% – 2.75% by year end and as high as 4.00% to 4.25% by the summer of 2023. Avoiding the constraints of benchmark investing will be critical to avoid, in our opinion, the lurches that the market may face the next couple of years. Lower prices are already starting to get our attention but selling has been reasonably orderly and the prospect of higher future returns, in our opinion, has not reached its nigh.
The portfolio of Lysander-Fulcra Corporate Securities Fund (the “Fund”) has maintained a very short level of duration of approximately 2 years for some time, and a robust level of liquidity (cash and short corporates / governments) that has helped the Fund avoid the pitfalls faced by the indices and fully invested benchmark constrained managers. While several bonds have contributed to the Fund’s slight positive performance year to date, the position in Sherrit International bonds has been most impactful.
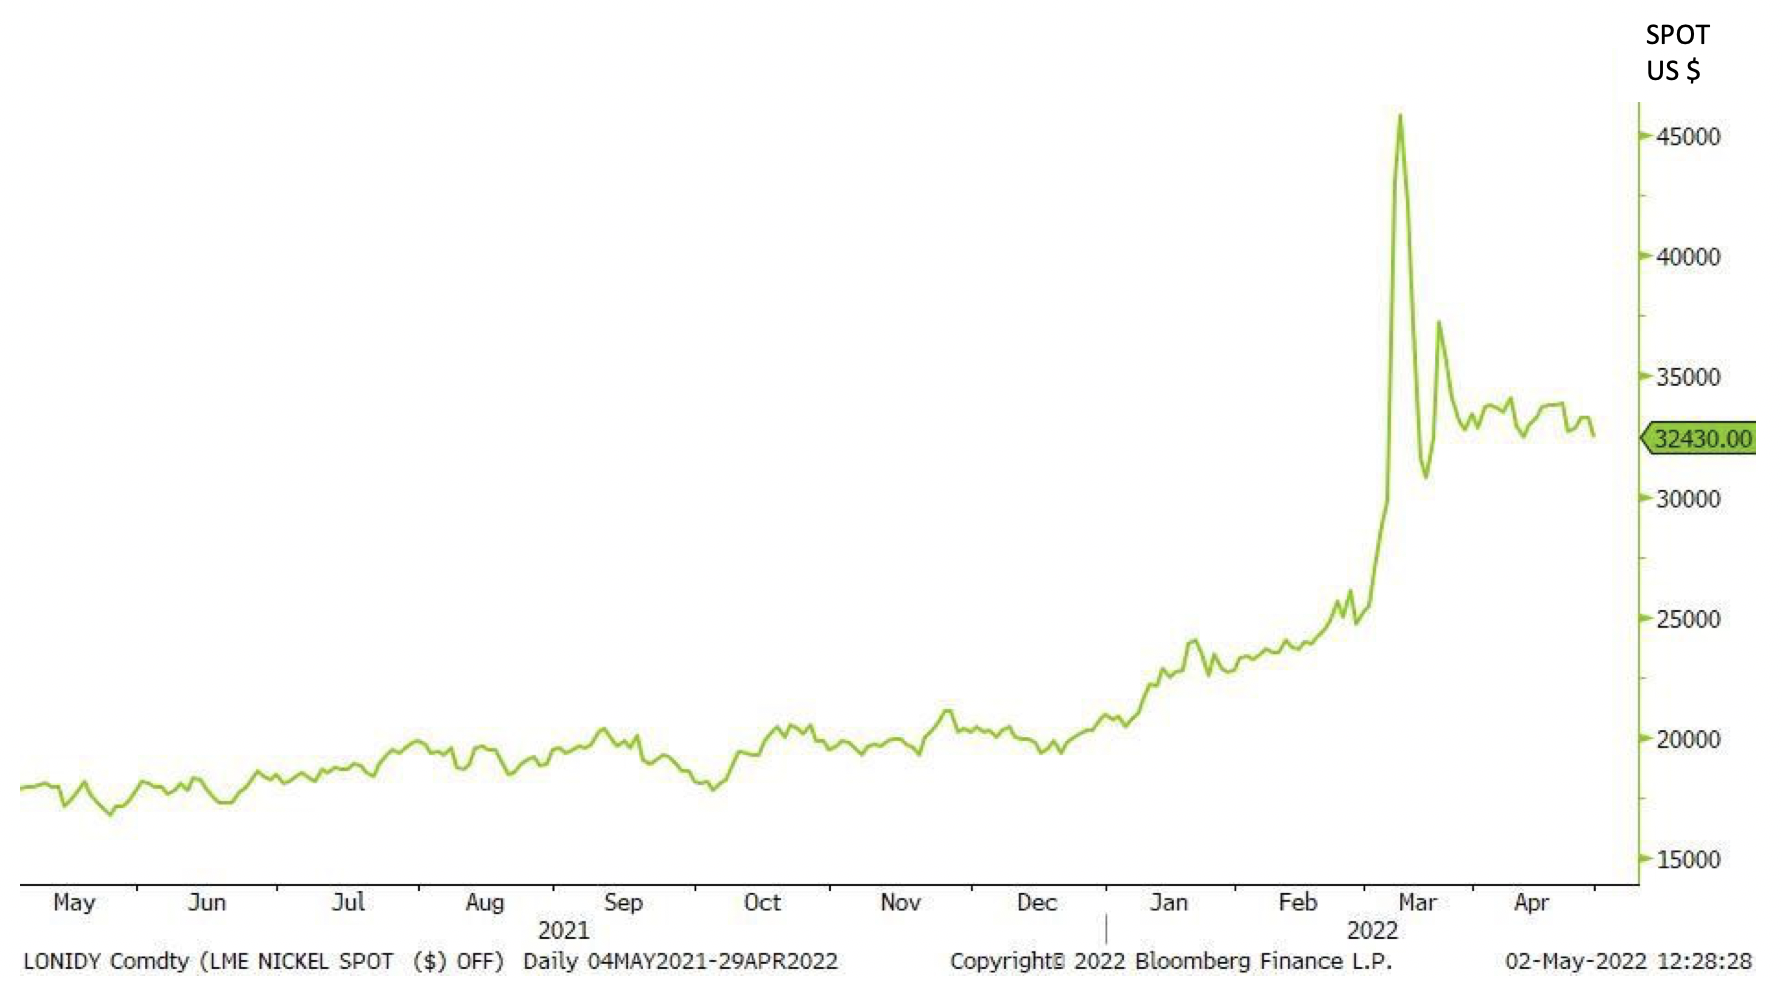
As one on the largest producers in the world of class one nickel, Sherritt stands to financially benefit from the recent rise in the price of nickel (graph below) due to economic sanctions being placed on Russia, historically one of the largest exporters of nickel. While this dramatic price increase in a commodity can have an immediate positive impact on the public equity of a concentrated producer it may not impact the bond price of said producer.

In the case of Sherritt, however, the bonds contain a unique covenant that requires the company to buy back bonds at par with any excess free cash flow the company generates after maintenance capital expenditures. This is an obligation, not an option for the company and is a very creditor friendly covenant that has created interest in the Sherritt bonds.
As the path to higher interest rates is set, it will not necessarily be a straight one. At a current 0.75 – 1.00 % Fed Funds rate which is forecasted by some to be above 4% in 12-16 months, the bumpy ride for “traditional” fixed income is sure to continue. While the positive repricing continues, we expect a very target rich environment to build.