

A Historic Month
“Historic” is at least one word that can be used to describe the month of March and the impact the spread of the COVID-19 virus has had on many facets of life for people around the world.
In the US credit markets, the month of March has also solidified itself in history as being one of the most volatile months on record, as indicated from the following charts.
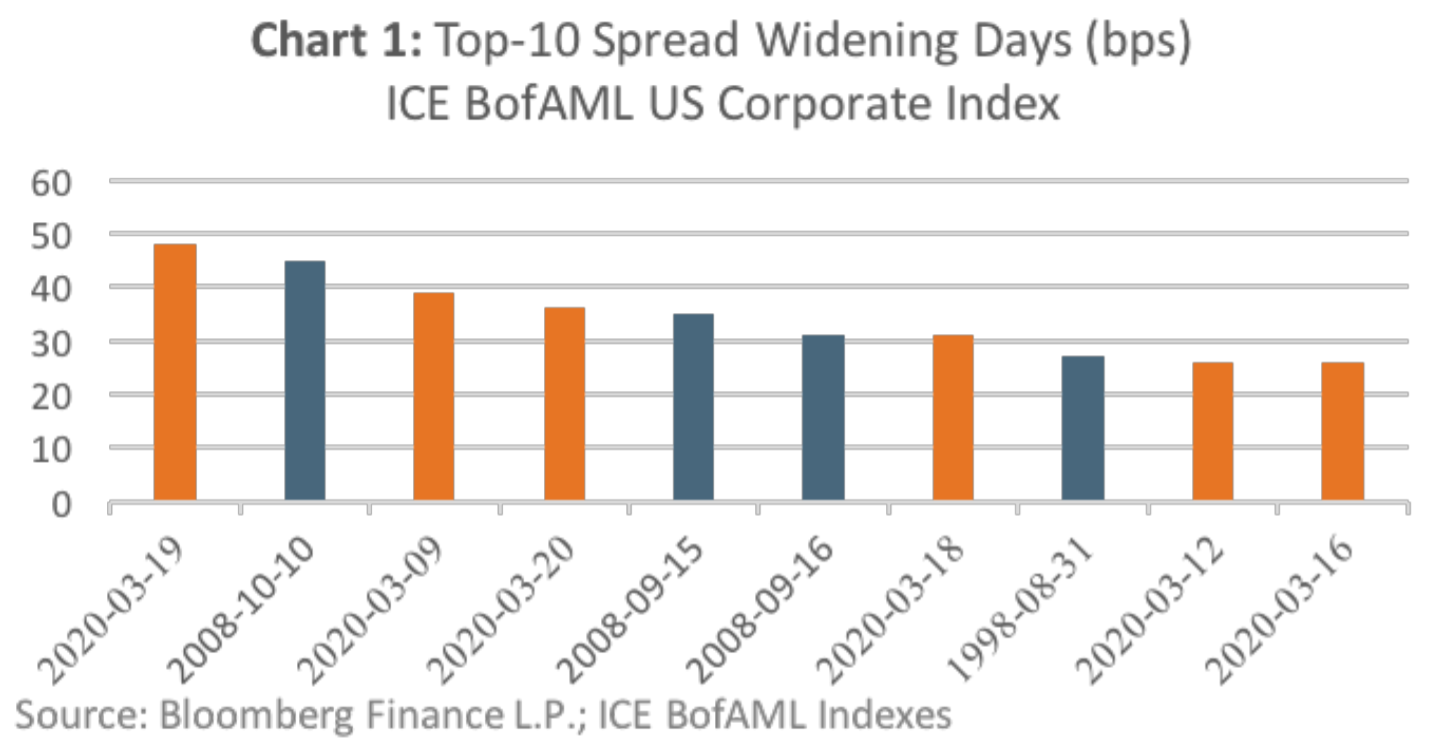
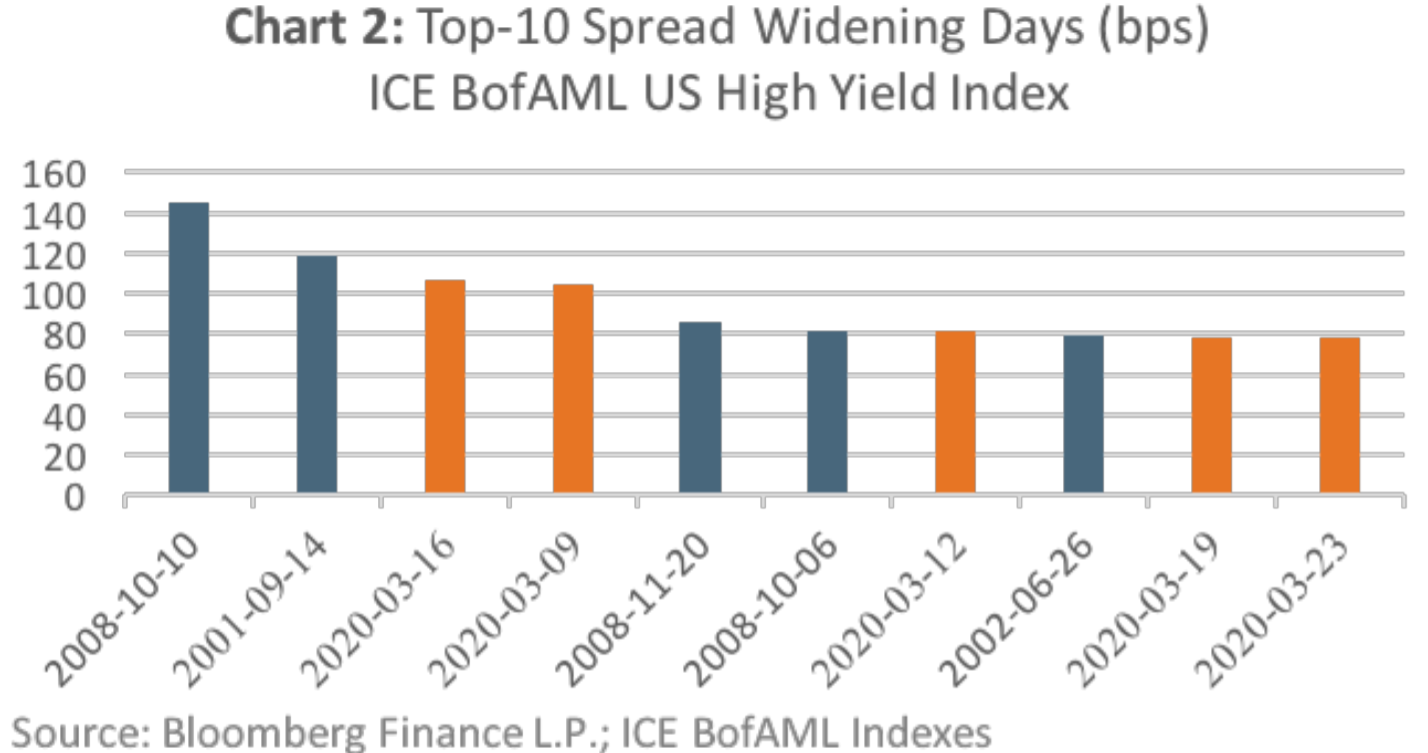
Chart 1 and Chart 2 show the top-10 credit spread widening days for the US investment grade (ICE BofAML US Corporate Index) and US high yield (ICE BofAML US High Yield Index) markets from December 31, 1996 to March 31, 2020, respectively.
Astonishingly, for both the US investment grade and US high yield markets, March 2020 now accounts for more days in their respective top-10 spread widening days than there are days in the top-10 from the 2008 Financial Crisis! Also, in the US investment grade market, March 19, 2020 was the largest spread widening day on record.
Spotting the Relative Value in Credit
With the recent widening of credit spreads, it has also created a historic opportunity for investors with available cash to enter the credit markets at extremely attractive prices. Conventional wisdom may suggest that the best opportunities lie in credits with the highest yield, such as those in the lower quality segments of the credit market, also known as high yield. However, another way to identify opportunity in the credit market is based on the principle of mean-reversion.
What do you Mean Reversion?
Mean reversion is a statistical principle that states that random patterns tend to revert to their mean over time. In the context of spotting value in credit, the question that could be asked is what segment of the credit market has seen the largest spread movement relative to its long-term average (mean)? Charts 3 to 5 illustrate the answer to that question by charting the yield advantage achieved by moving down different segments of the credit spectrum1.
• Chart 3 shows the yield advantage of moving from US Single-A to US BBB, which is currently 3 standard deviations from the mean;
• Chart 4 shows the yield advantage of moving from US BBB to US high yield, excluding distressed, which is currently 2 standard deviations from the mean;
• Chart 5 shows the yield advantage of moving from US BBB to US distressed high yield, which is currently less than 1 standard deviation from the mean.
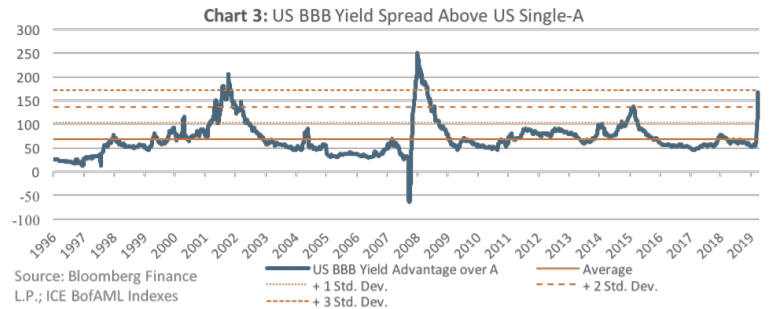
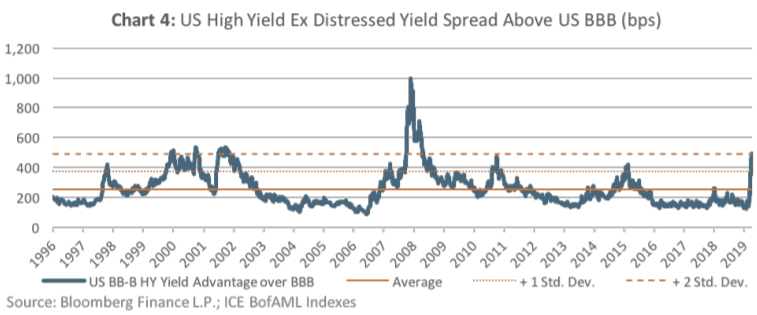
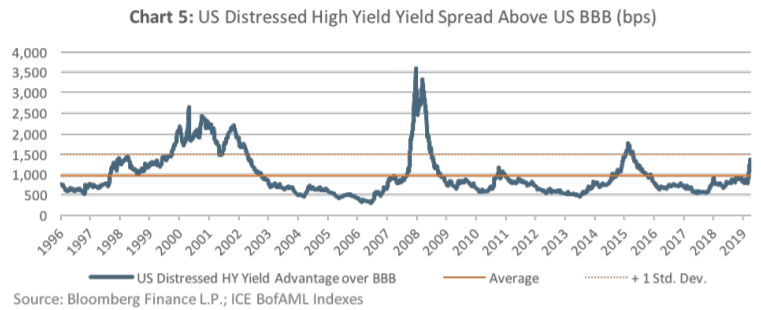
The key takeaway is the segment of the credit market with largest relative yield spread advantage (largest deviation from the mean) is US BBB. In US high yield, there is a moderate advantage in moving from US BBB to US high yield, excluding distressed, and even less advantage moving from US BBB to US distressed high yield.
Conclusion
March 2020 was a historic month in the credit markets, and no one can say for certain if the same levels of negative volatility will persist into April. For investors looking to put cash to work in the credit markets, they should not just consider credits that offer the greatest spread, but should also consider the additional yield achieved for reducing credit quality and how that yield pick-up compares to its historical average. According to our analysis, investors may find that the best risk-reward is found in the US BBB segment of the market. From a broad market perspective, the high yield segment looks moderately attractive, although investors may want to be more selective or employ an active investment strategy if they want to venture into more distressed names.
1The credit market segments in this analysis are based on the following: “US Single-A” – ICE BofAML Single-A US Corporate Index; “US BBB” – ICE BofAML BBB US Corporate Index; “US High Yield Ex Distressed” – ICE BofAML BB-B US High Yield Index; “US Distressed High Yield” – ICE BofAML CCC and Lower US High Yield Constrained Index
March 2020: A Historic Month and Spotting Relative Value in Credit