

Watershed Moment
On Friday, June 10th, 2022, Headline YoY US CPI was reported at a level of 8.6%, exceeding market expectations and was the largest print since December 1981.
The May 2022 US CPI print could have been a watershed moment for markets where two points were realized:
- The US Federal Reserve (“the Fed”) will need to be more aggressive to control inflation.
- The forward guidance from the Fed is losing credibility and longer-term interest rates could continue to rise.
A More Aggressive Fed
At its meeting on June 15th, 2022, the Federal Open Market Committee raised the Fed Funds Target Rate (“Fed Funds rate”) by 0.75% – the largest individual increase since 1994.
This historic increase to the Fed Funds rate could be viewed as capitulation by the Fed in recognizing they have been behind the curve in using their policy tools to control inflation. The only problem is it appears the Fed may have to do more to get ahead of the curve on inflation.
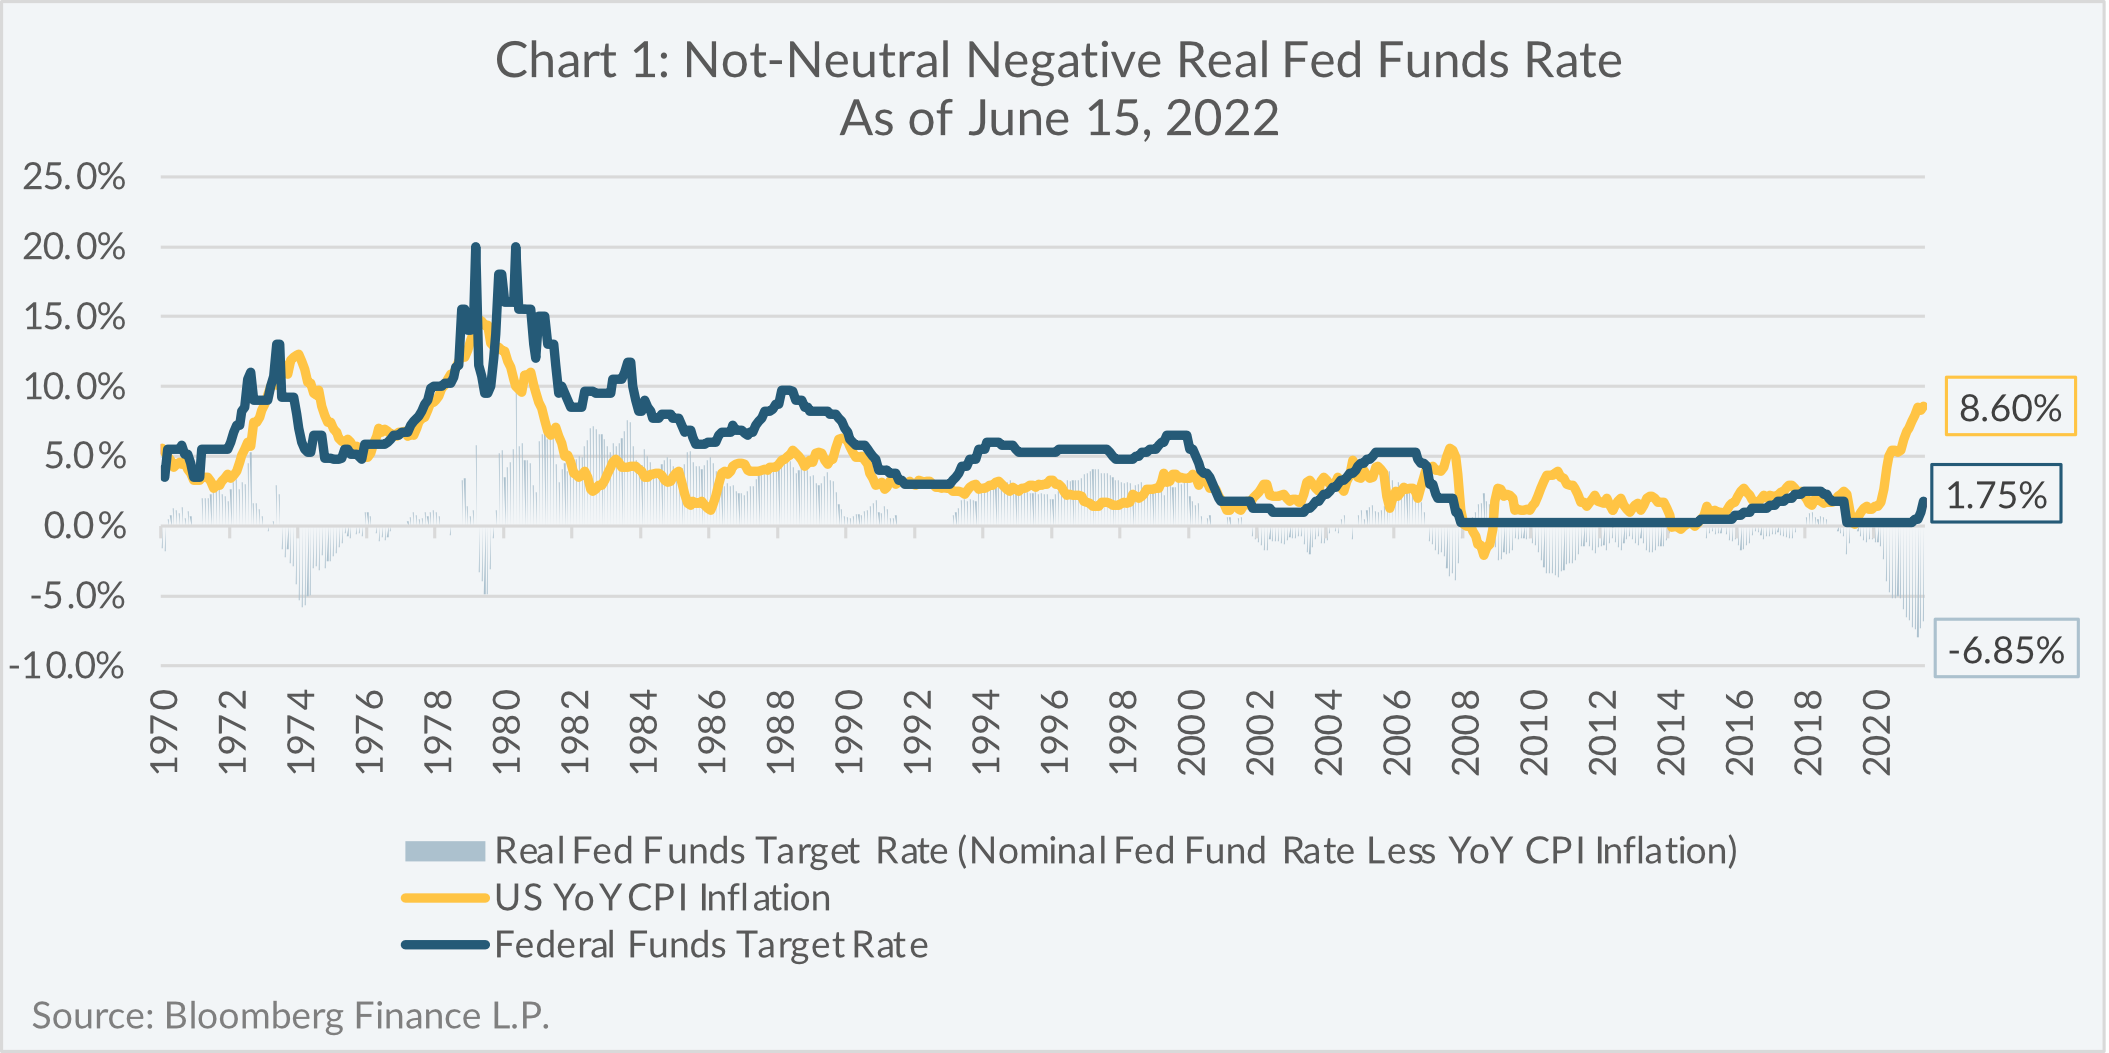
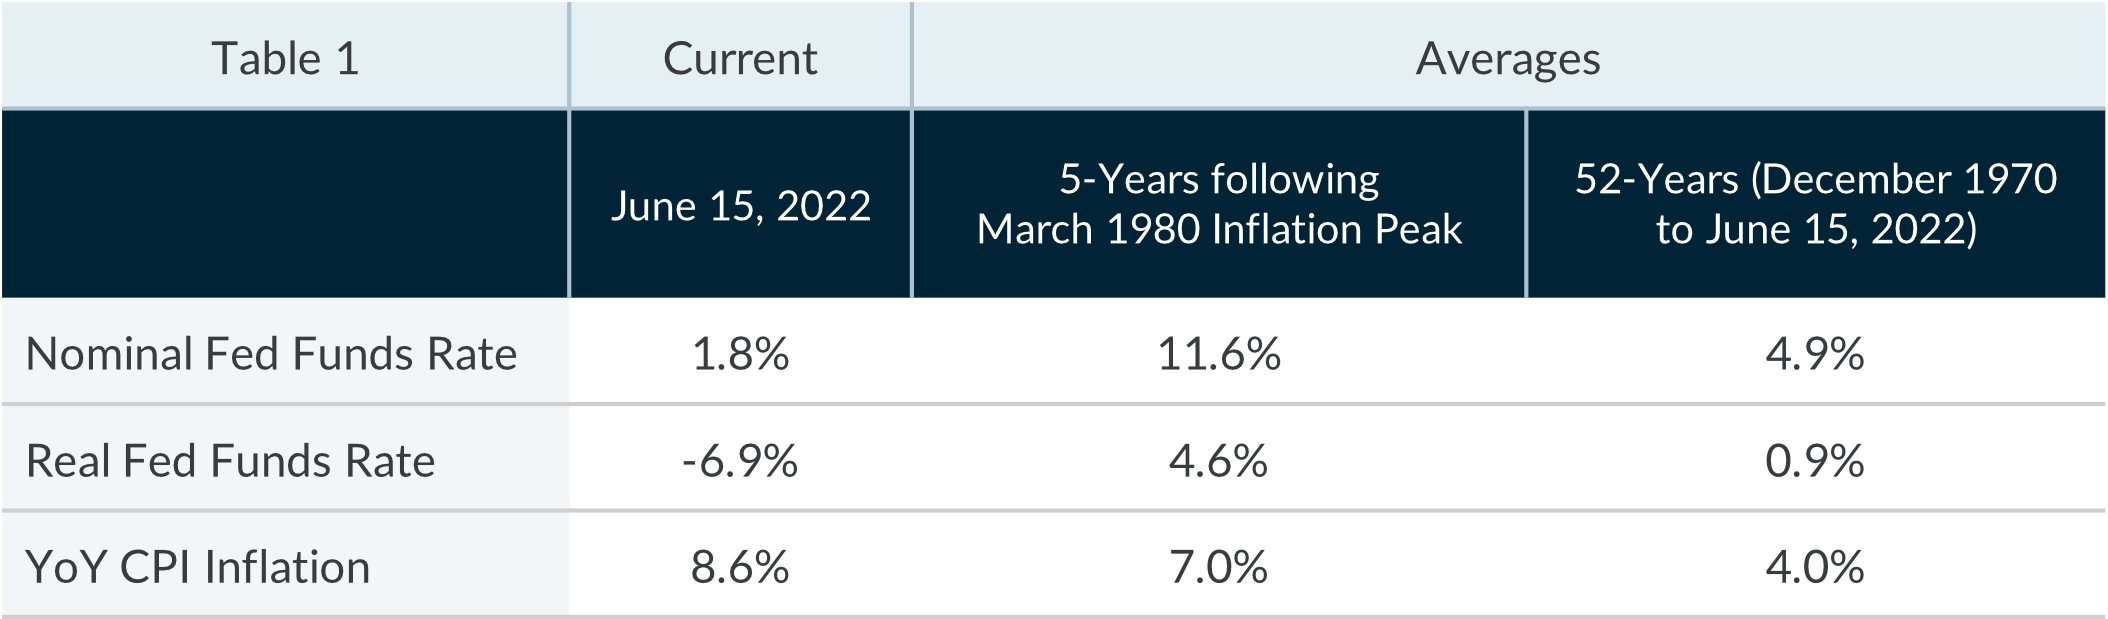
As illustrated in Chart 1 and Table 1, as of May 31, 2022, the real (i.e. after-inflation) Fed Funds rate was -6.9%, near its lowest level in over 52-years. When YoY US CPI peaked in March 1980 at 14.8%, the average real Fed Funds rate 5-years thereafter was 4.6% and the 52-year average of the real Fed Funds rate was 0.9%.
While no one knows the precise level of nominal Fed Funds rate that controls inflation (referred to as the “neutral” Fed Funds rate1), history has shown that a good place to start is a positive real Fed Funds rate, and we are a still a long way from there.
Losing Forward Guidance Credibility
Interest rates are influenced by different factors depending on its tenor on the yield curve. The Fed has direct influence over the short-end of the yield curve by setting the Fed Funds rate, while market expectations of growth and inflation tend to have more influence on the longer-end of the yield curve. Despite it not having direct influence, the Fed has shown an ability to indirectly influence longer-end of the yield curve through its forward guidance.
Post-March 2020, longer-term interest rates have remained relatively low in comparison to the elevated levels of CPI inflation, partly because the market has believed the narratives of inflation being “transitory” or having “peaked”. After the May 2022 US CPI print, those dovish narratives are waning, and interest rates have move higher along with greater expectations of future inflation.
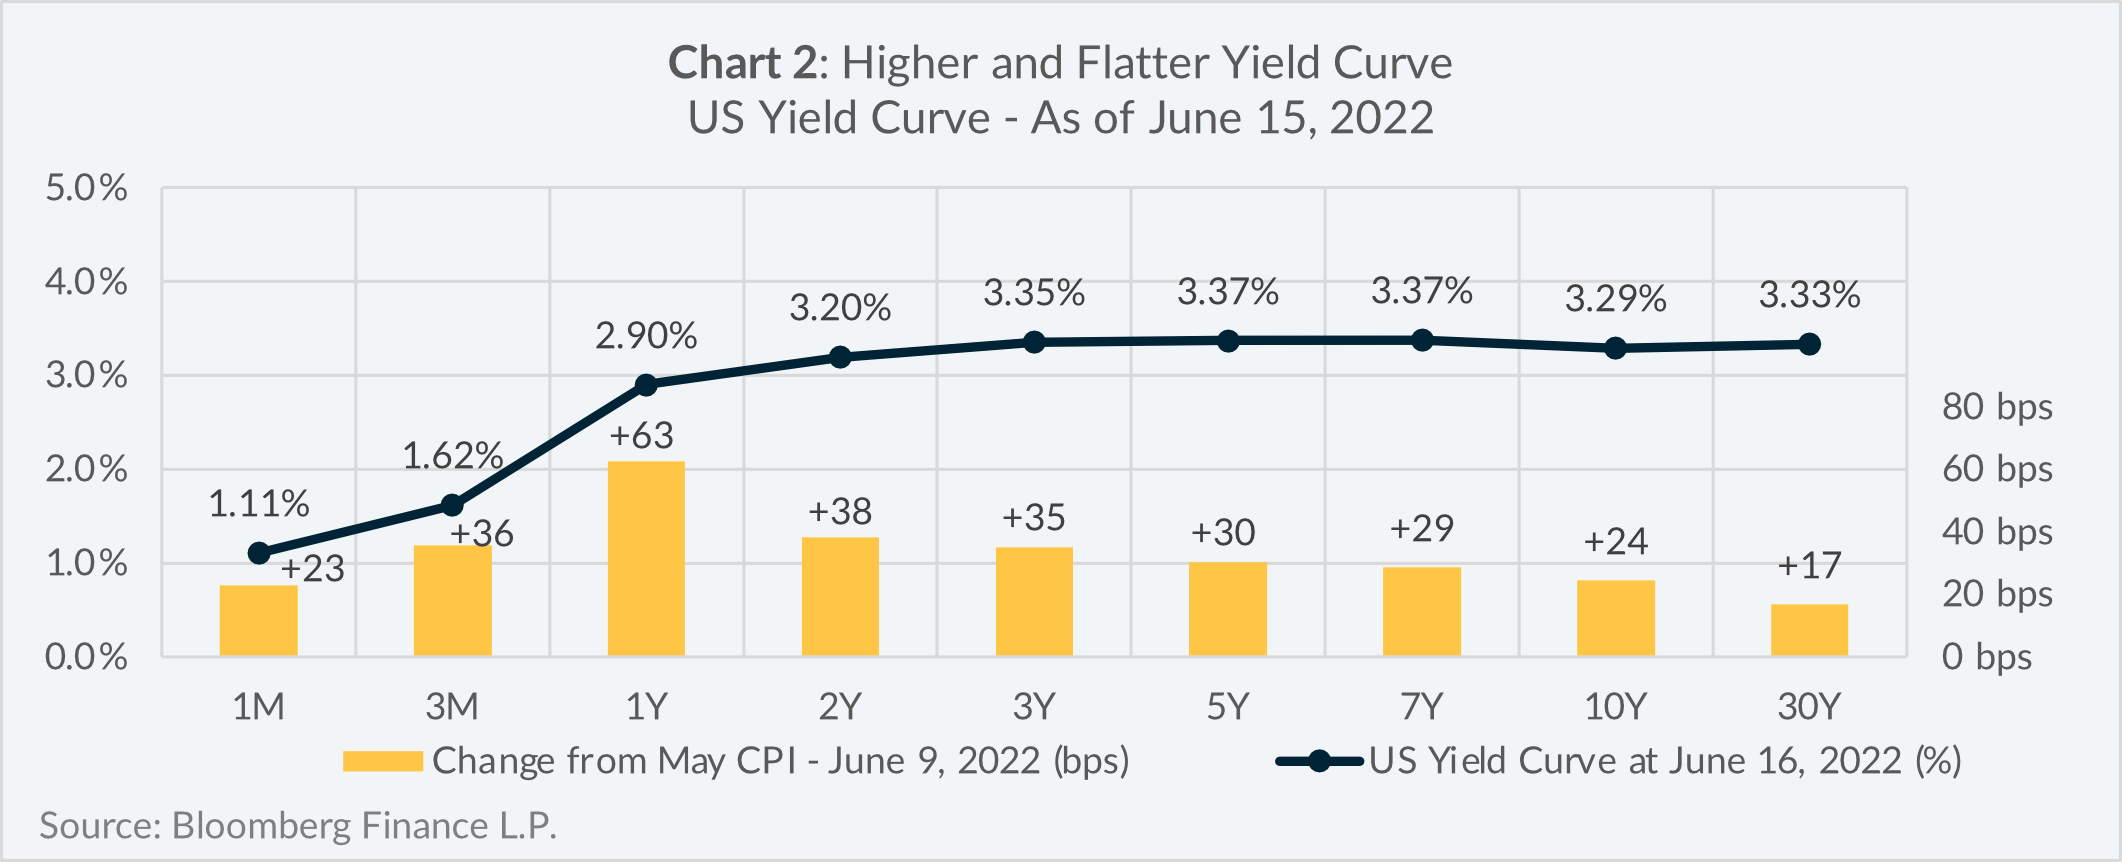
As illustrated in Chart 2, US interest rates increased significantly across the yield curve in the week following the announcements of the May 2022 US CPI and the Fed Funds rate decision on the morning of June 15, 2022.
What does this mean for Bond Investors?
Today there is an unprecedented level of risk in the bond market for the following reasons:
1. No compensation for additional risk assumed
As illustrated again in Chart 2, the US yield curve is essentially flat between the two-and-thirty-year tenors, which means bond investors are not getting paid, that is, investors are not achieving greater yields for assuming the incremental interest rate risk associated with investing in longer-term bonds.
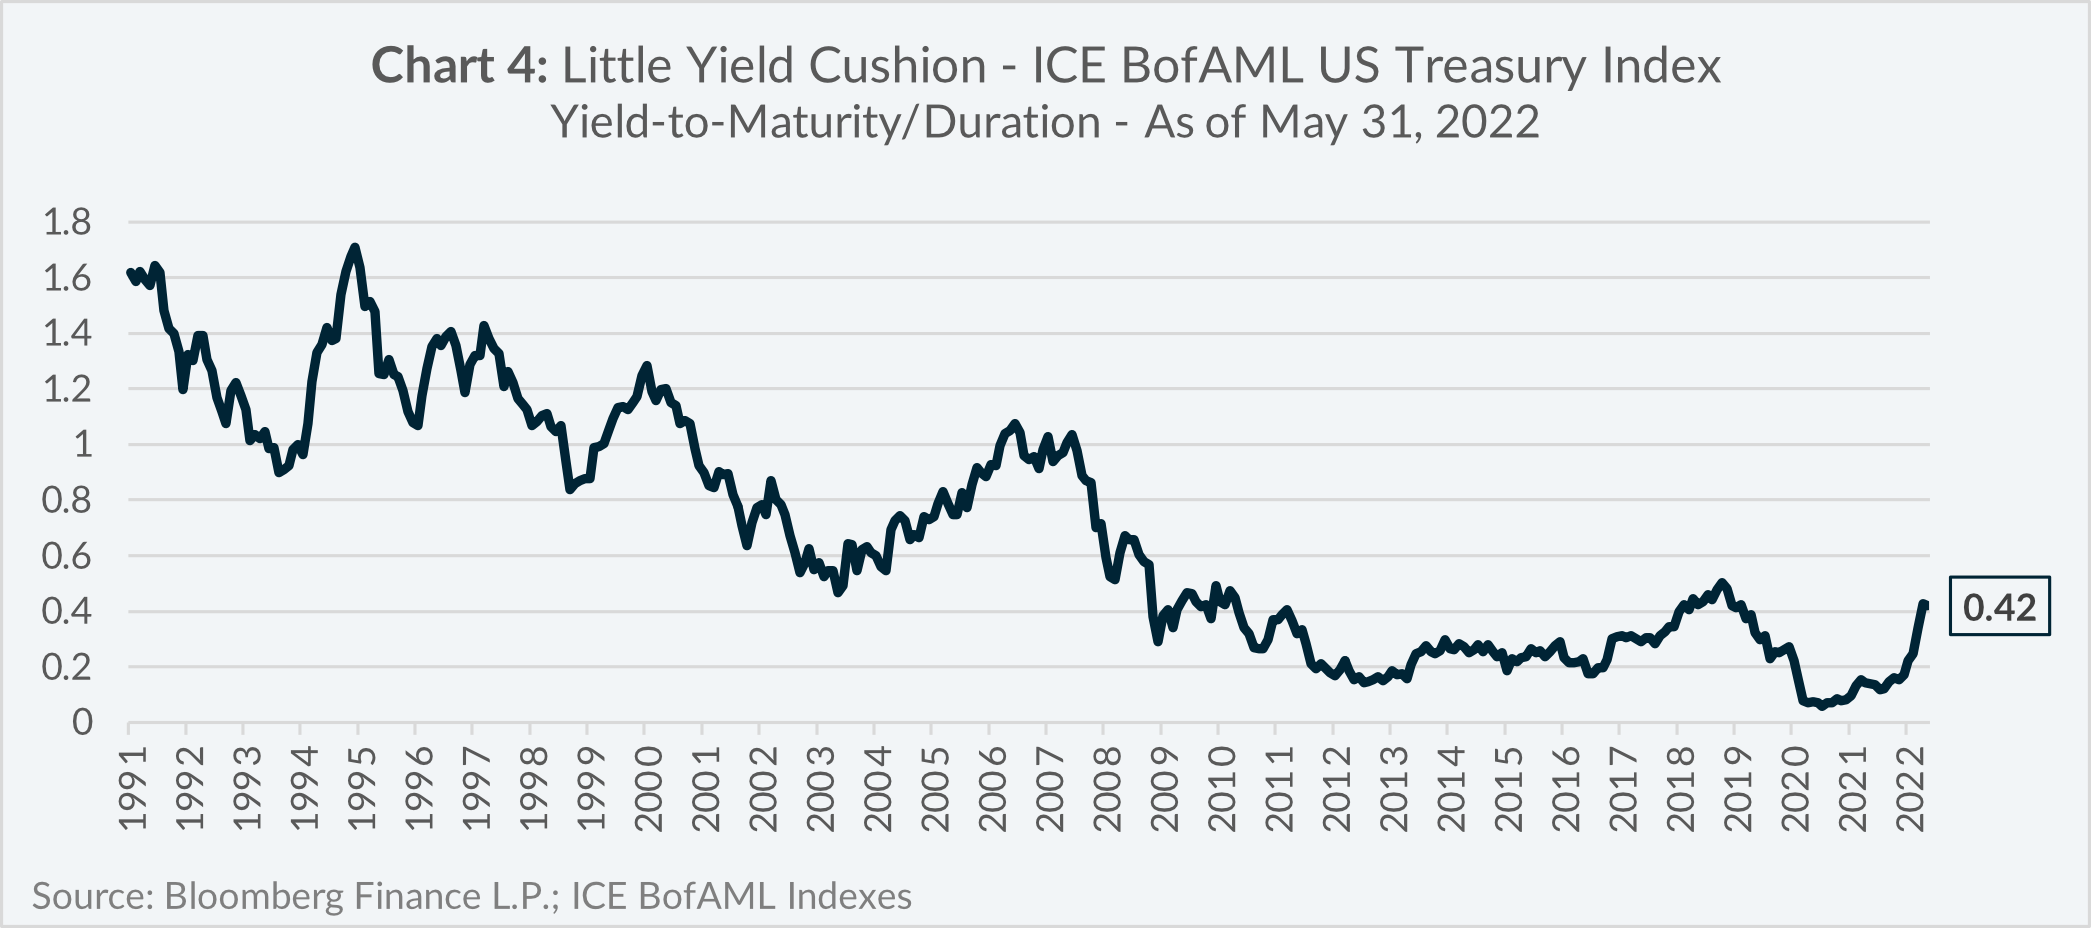
2. Little “yield cushion”
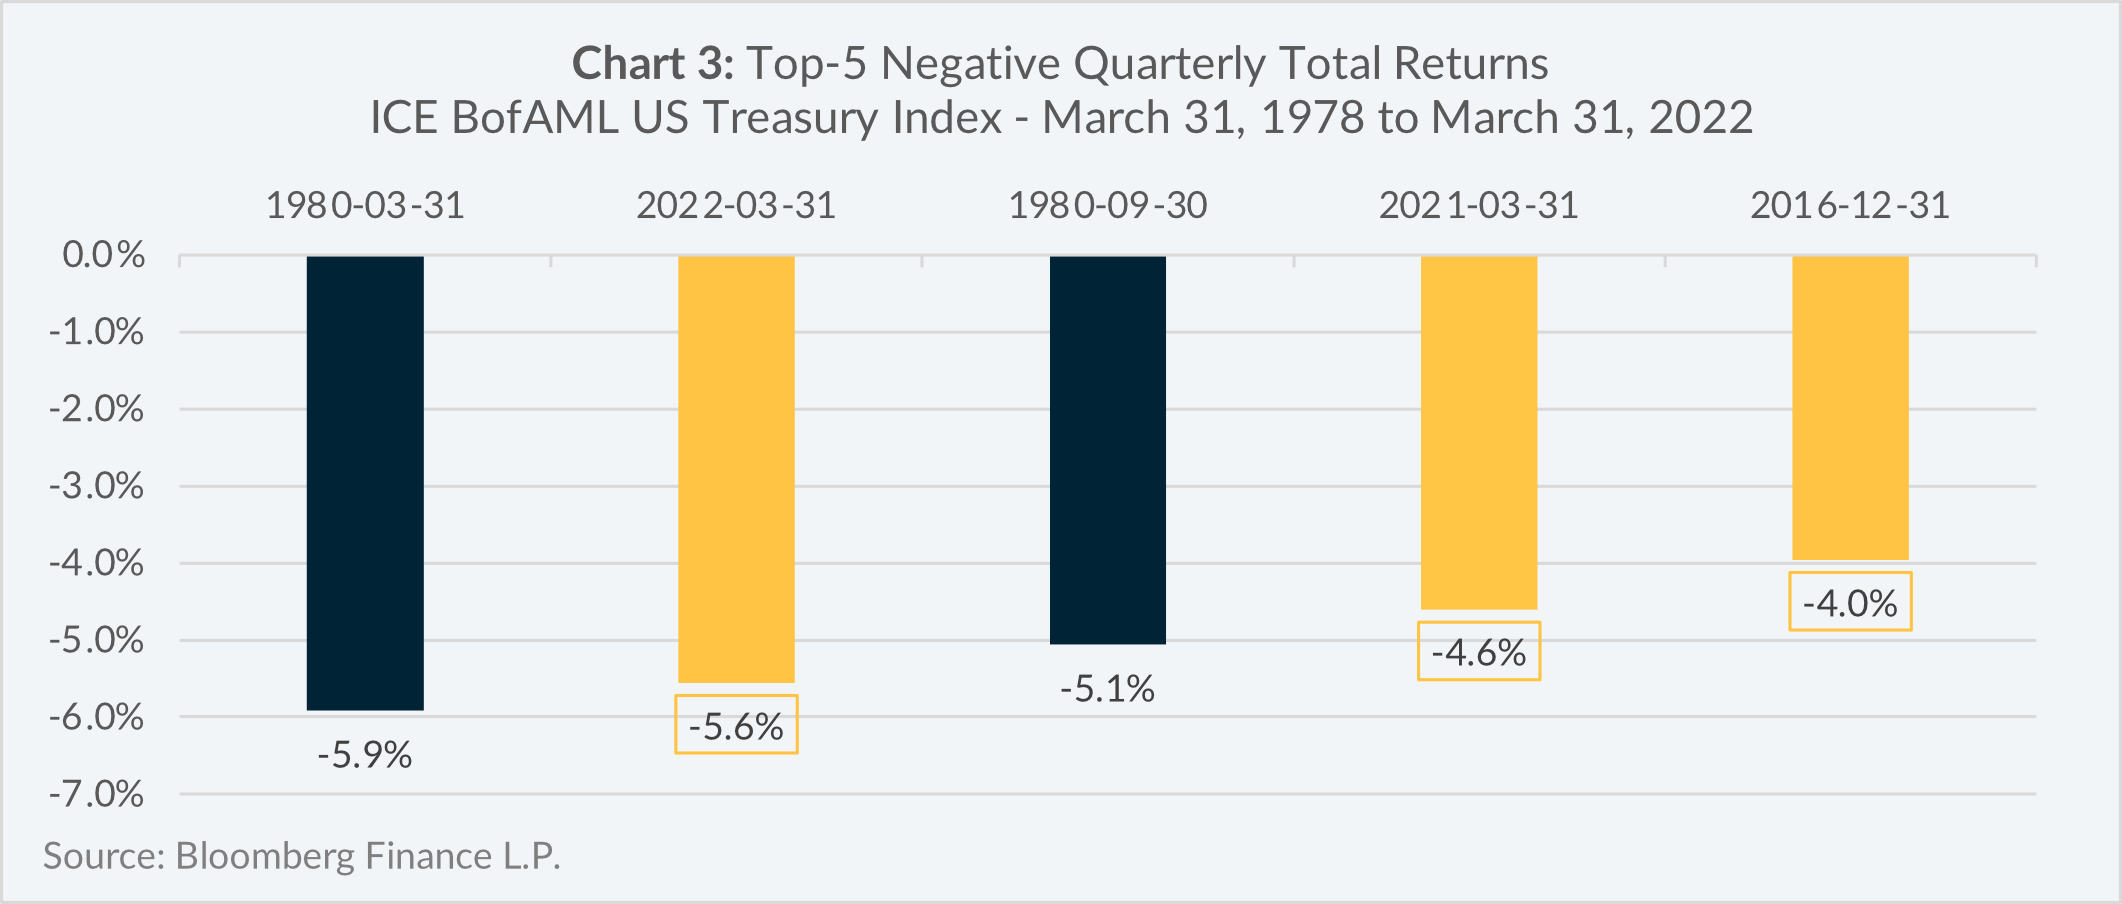
As illustrated in Chart 3, three of the top-five negative quarterly total returns for the ICE BofAML US Treasury Index over the past 44-years have occurred within the low interest rate environment of the past 6-years.
Bond strategies with low yields relative to their durations2 means there is less yield cushion to protect bond investors from capital losses when bond prices fall from rising interest rates.
Another way to look at the concept of yield cushion is to divide the yield-to-maturity of a bond by its duration, which effectively quantifies how much of an interest rate increase would approximately wipe out one year’s worth of coupon interest.
As illustrated in Chart 4 as of May 31, 2022, an interest rate increase of approximately 0.42% would create a capital loss large enough to offset one year’s worth of yield for the ICE BofAML US Treasury Index. This is a massive departure from the 1990s and 2000s when there was a much larger yield cushion to protect bond investors from larger interest rate increases.
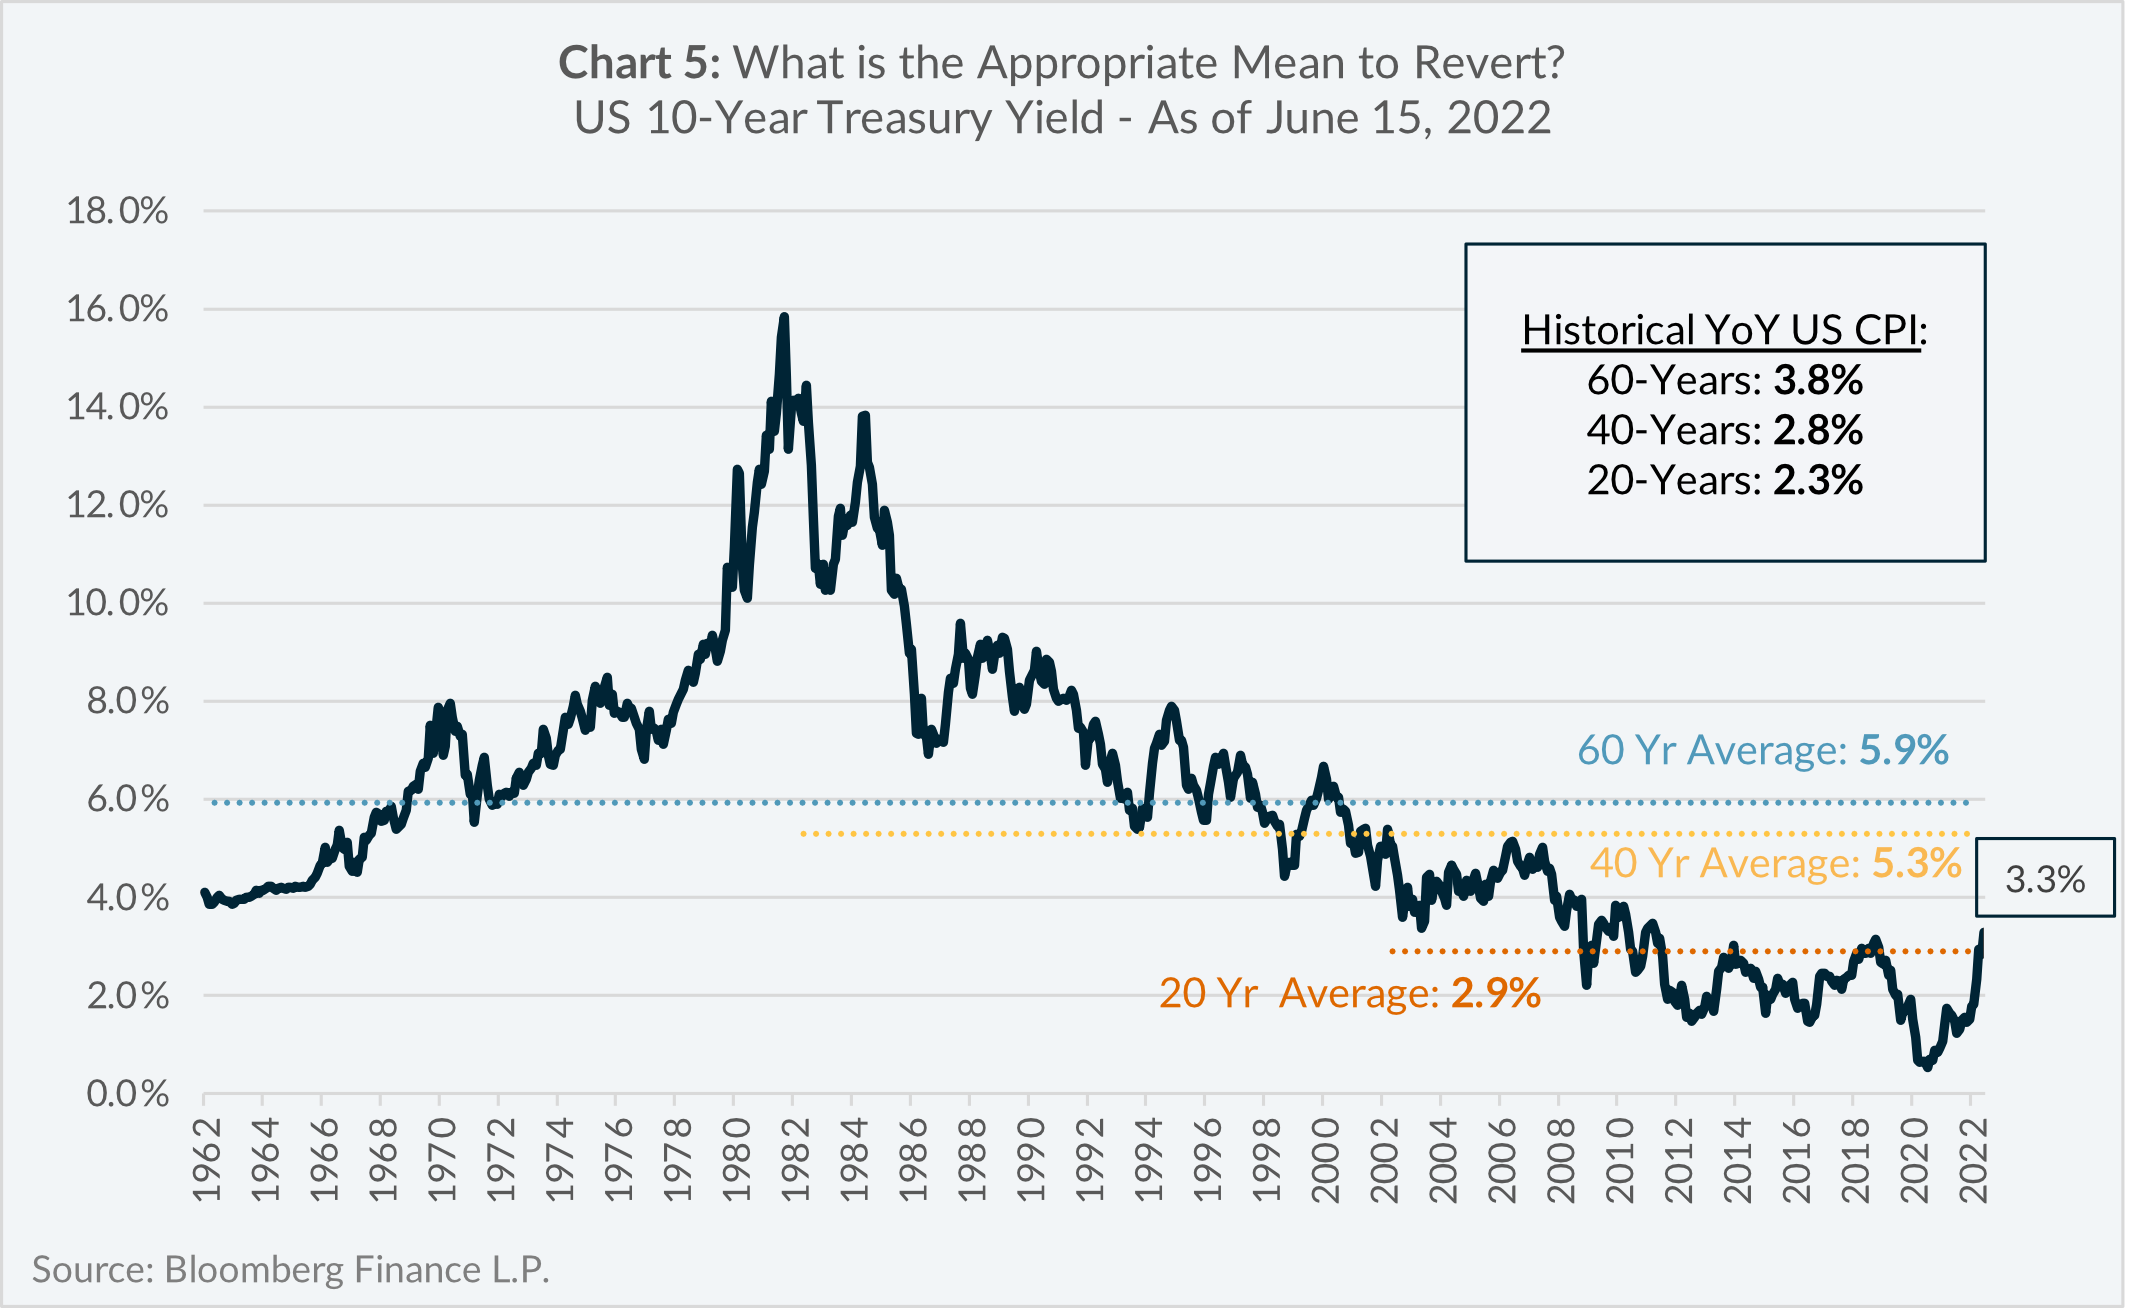
3. Catalysts for higher interest rates
As mentioned in the section above, one of the factors impacting long-term interest rates is the market expectation of future inflation. Thus, a period with higher expected inflation should also be accompanied by higher expected interest rates, all else being equal.
As of June 15, 2021, the market expectation for average future CPI inflation was 2.7%3, which is closely aligned with the 2.8% average YoY CPI inflation over the past 40-years.
As illustrated in Chart 5, if the US-10 Year yield were to revert to its 40-year average it would represent an additional yield increase of 2.0% from its level on June 15, 2022.
How can Bond Investors adapt to rising interest rates?
In a rising interest rate environment, investors could be well served by lowering the duration of their bond portfolios and increasing yield in ways other than extending the term out the yield curve.
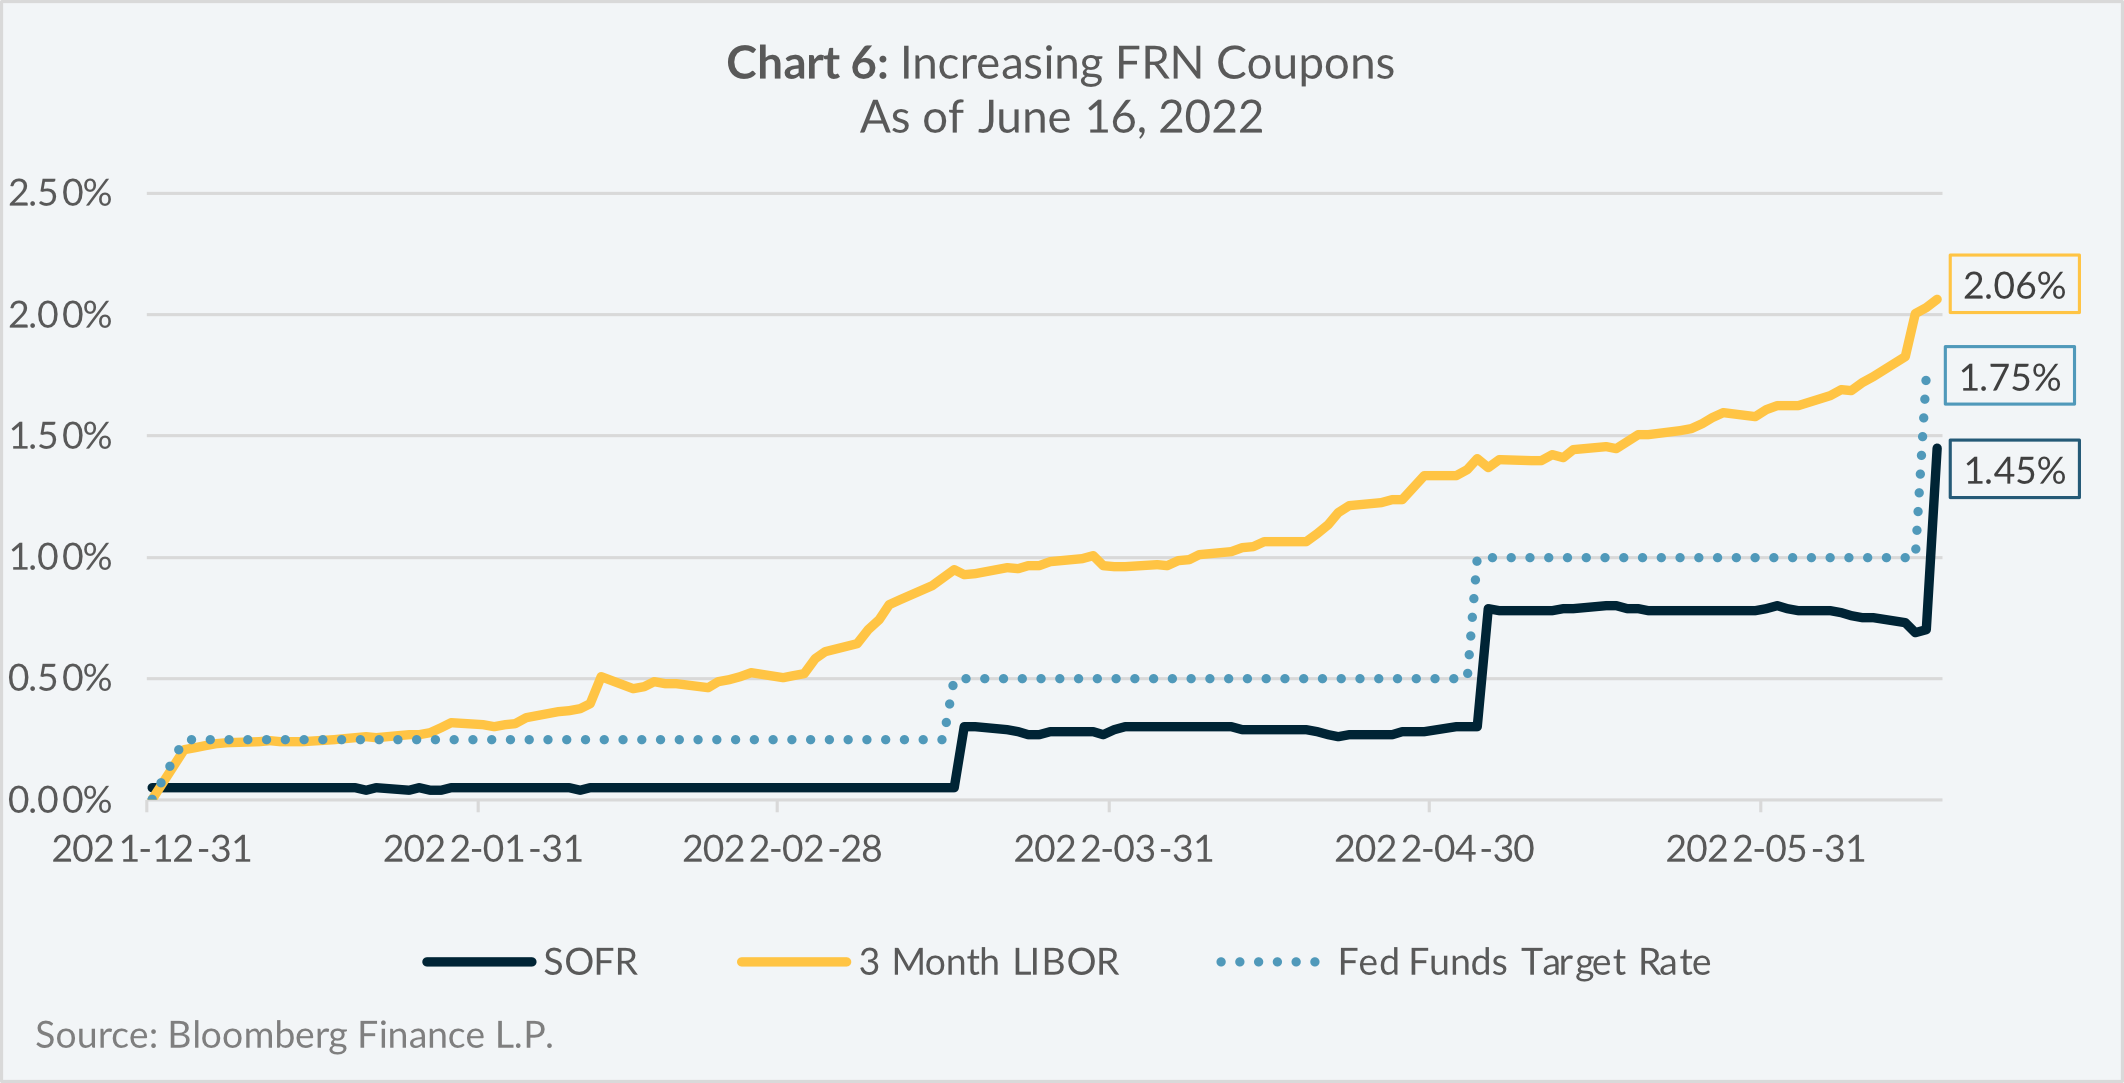
One fixed income security that can benefit from a rising interest rate environment is the floating rate note (“FRN”). FRNs pay coupons that change based on a variable rate reference index, thus the duration of FRNs tends to be very low.
In the US, a popular reference index has been the London Interbank Offering Rate (“LIBOR”), although LIBOR is in the process of being phased out and will be replaced with the Secured Overnight Financing Rate (“SOFR”) on June 30, 2023.
As illustrated in Chart 6, year-to-date in 2022, the yields of SOFR and LIBOR reference indexes have increased along with the Fed Funds rate, which also means higher coupon payments to FRN investors.
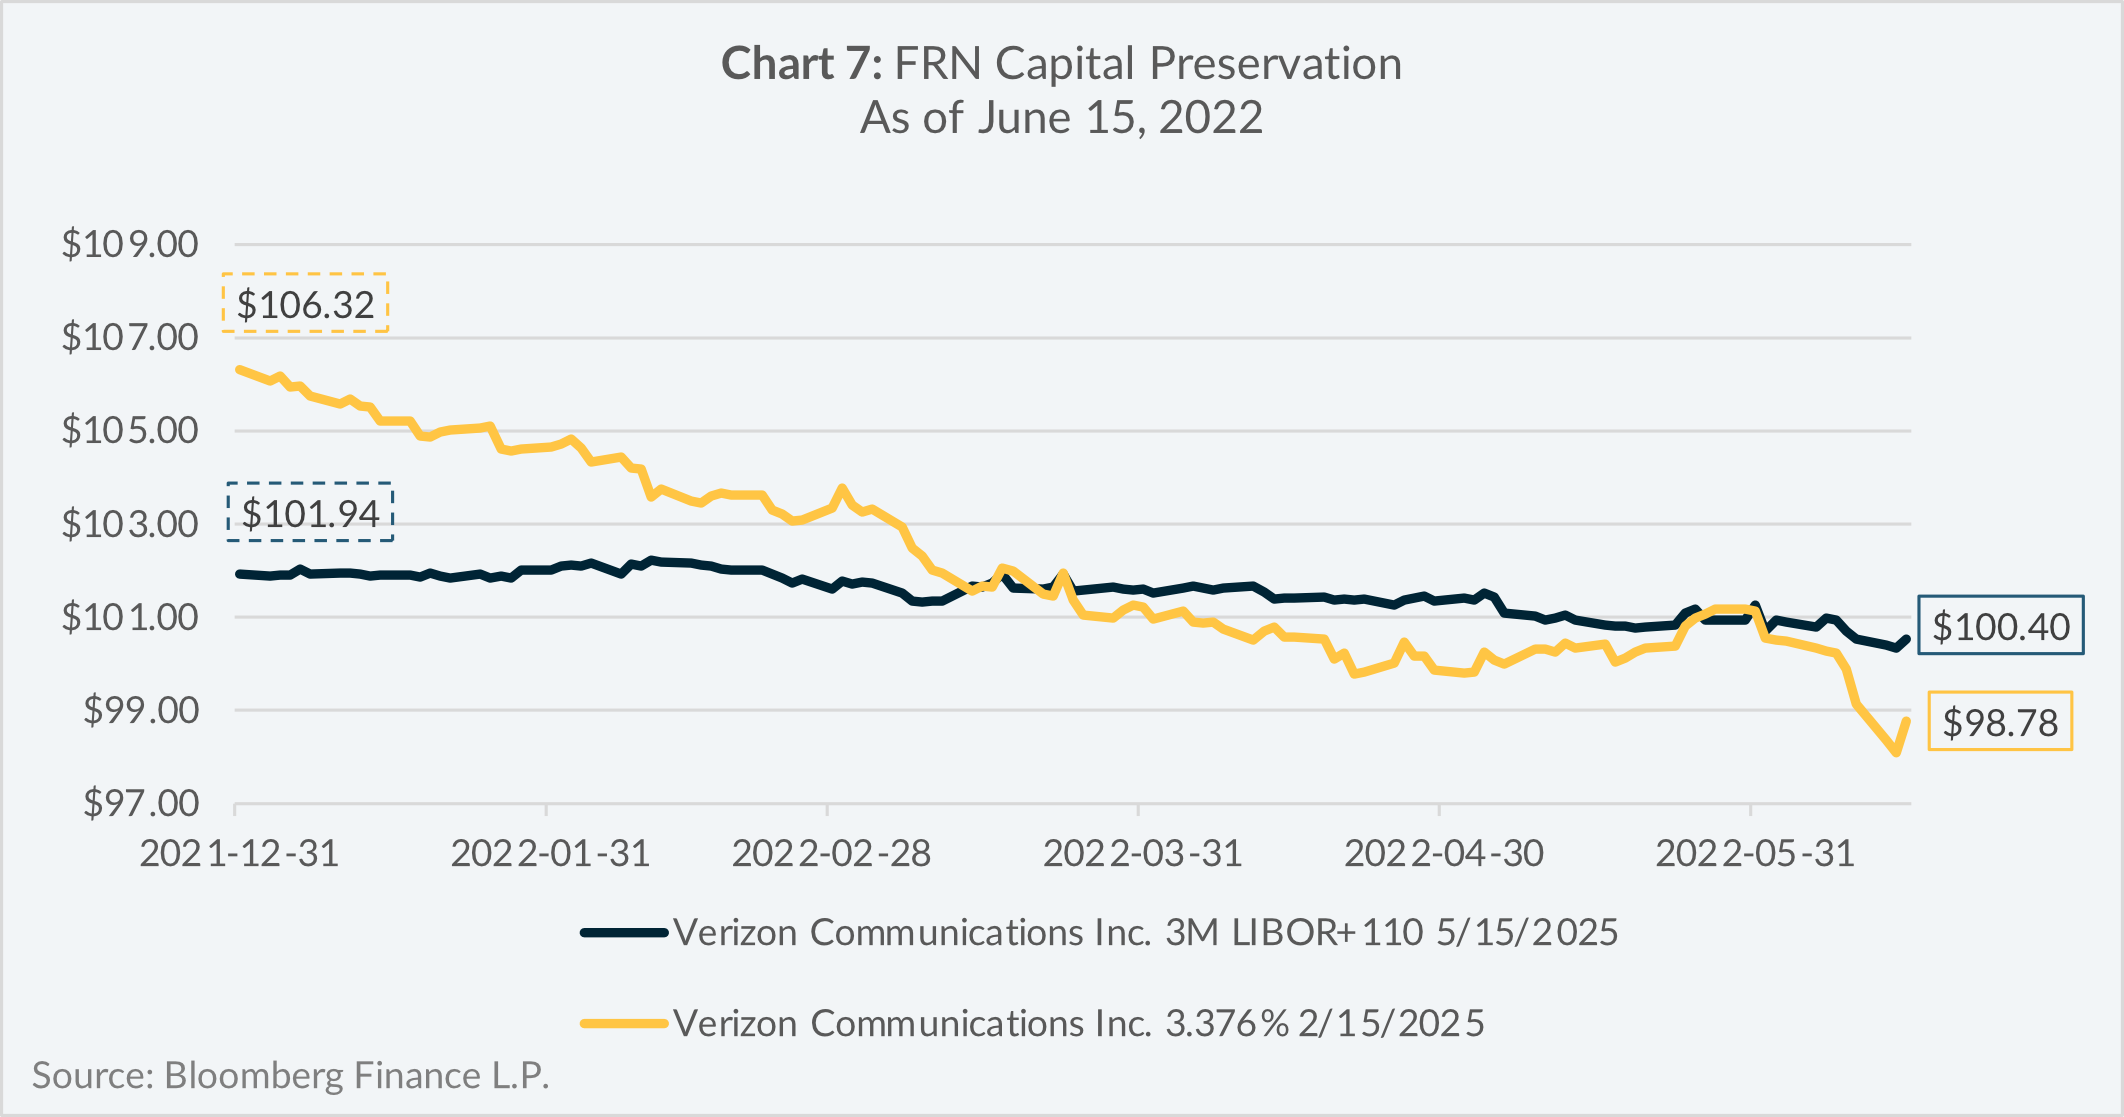
Another benefit of FRNs is their relative price stability compared to similar bonds with fixed coupons. Consider the examples of Verizon Communications Inc. (“Verizon”) in Chart 7. Year-to-date as of June 15, 2022, the Verizon FRN had a price return of -1.4% compared with the price return of -7.1% for its fixed coupon counterpart.
Conclusion
With a more hawkish Fed and prevailing bond market risks of 1) no compensation for additional risk assumed 2) little yield cushion and 3) catalysts for higher interest rates, investors should proceed with caution when considering longer-duration bond strategies, such as passive bond market indices.
Investors may want to consider an actively managed bond strategy, which has demonstrated the ability to mitigate duration.
The FRN is one tool that could be used, which can benefit investors in a rising interest rate environment in two ways:
- Increased coupon rates paid to investors as short-term interest rates rise.
- Increased capital preservation compared to fixed-coupon bonds.
With this said, any investment decisions should be made within the context of the risk and return requirements of the individual investor and should be done in consultation with a professional financial adviser.
Bond Solutions at Lysander Funds
Lysander Funds offers a suite of bond funds to investment professionals to match the different return and risk objectives of their clients. Our two portfolio managers in the bond arena, Canso Investment Counsel Ltd. and Fulcra Asset Management Inc., both apply bottom-up (i.e. company-first) approaches towards portfolio construction.
As of May 31, 2022, the yield-to-maturity, duration, and yield cushion statistics of the bond funds offered by Lysander Funds are noted in Table 2 below.
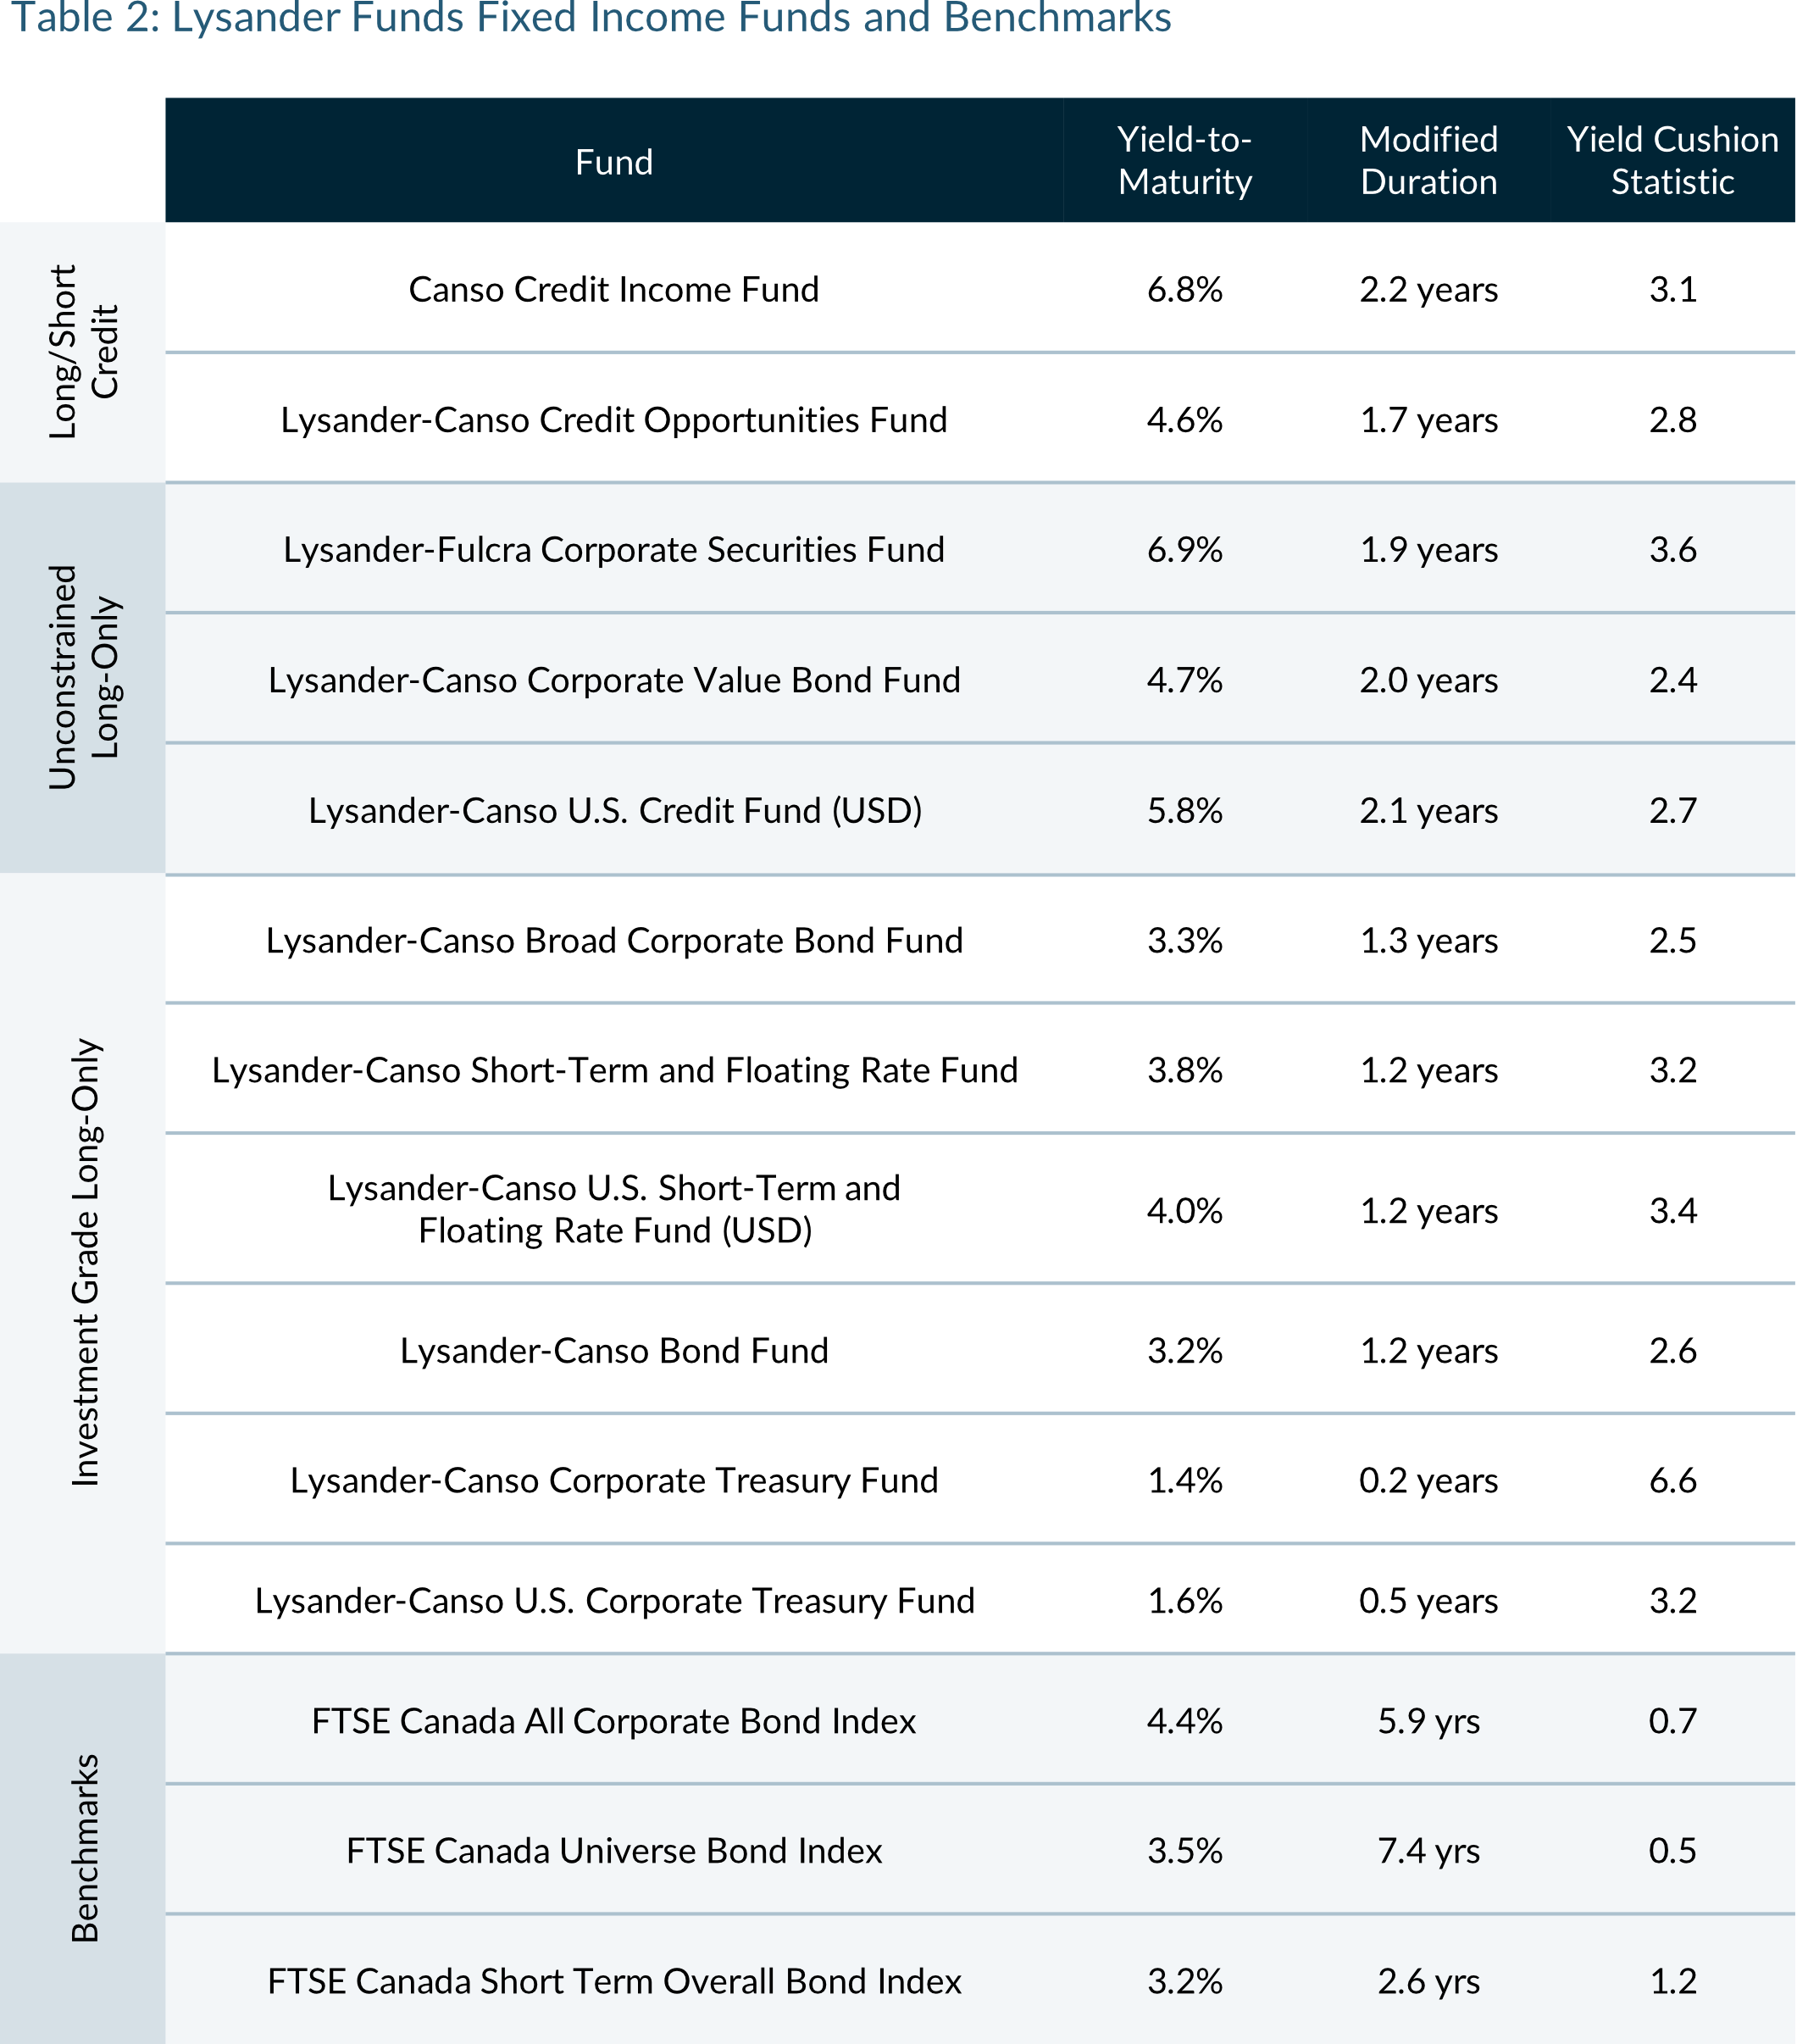
Source of FTSE Indices: FTSE Global Debt Capital Markets Inc. The indices are used for broad market comparisons. The FTSE Canada All Corporate Bond Index is comprised of Canadian investment grade corporate bonds. The FTSE Canada Universe Bond Index is comprised of Canadian investment grade corporate bonds. The FTSE Canada Short Term and Overall Bond Index is comprised of Canadian investment grade corporate bonds and government bonds with term-to-maturities between 1-5 years. The indices are presented on a total return basis.
1The Neutral Fed Funds rate is the nominal Fed Funds rate in which it is neither stimulative nor restrictive to economic growth.
2Duration is a measure of bond price sensitivity to changes in interest rates.
3The market expectation for average future CPI inflation was determined by the US 10-Year Breakeven Inflation spread.