

I Knew You Were Trouble.
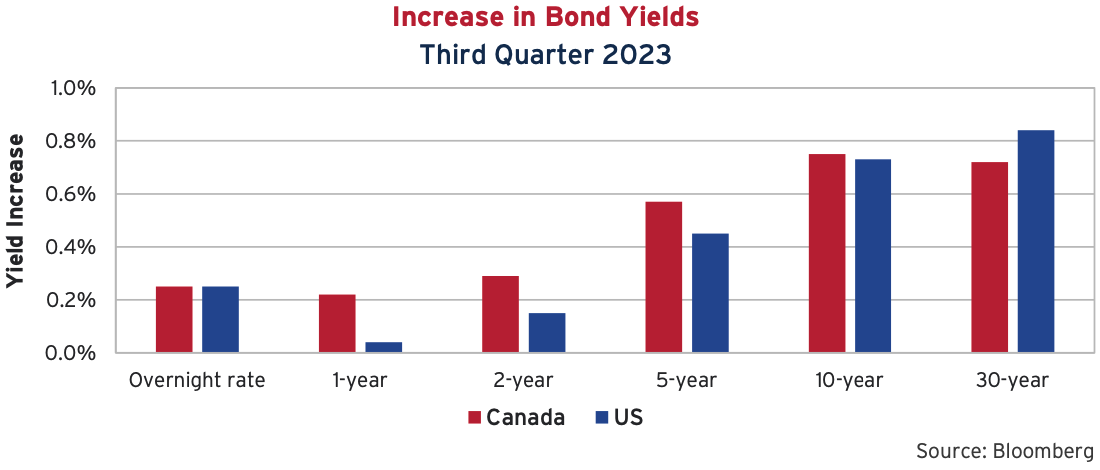
It was a cruel summer in the bond market as interest rates climbed swiftly higher. Yields across both Canadian and U.S. government curves jumped, hitting levels not seen since 2007. Increases were most pronounced at the long end, with 30-year yields rising 72 basis points in Canada and 84 basis points in the U.S., sending long bond prices down over 10%. Rate volatility continues to be a thorn in bond investors’ sides, with many fixed income portfolio managers navigating dangerous and uncharted markets they have never seen before. The steep rise in the third quarter threatens bond markets with their third consecutive year of annual declines.
Everything Has Changed
Rates back to 2007 levels have us reminiscing about how times have changed. In 2007, Apple released their very first iPhone at US$499. This September, we were introduced to version 15 which retails for as low as US$799 (that’s a 3% annual increase before “hedonistic adjustments” for those keeping inflation score at home). Also in 2007, the U.S. Treasury sported three AAA credit ratings. After Fitch’s downgrade in August, they are now down to one. And finally, in 2007 Taylor Swift had only one studio album to her resume and was a resident on the country music charts (no indication whether she was an NFL fan at that point).
Picture to Burn
The rise in long yields over the past three years has decimated long-bond returns. The iShares 20+ Year Treasury Bond ETF, which trades under the ticker TLT, experienced a 50% drawdown in price from its high point on August 4, 2020, to its low point on October 6, 2023. In equity markets, investors generally accept volatility and drawdowns as the price of admission. The fact that a portfolio of bonds, all issued by the U.S. government, is down 50% in price has no doubt caught many investors off guard.
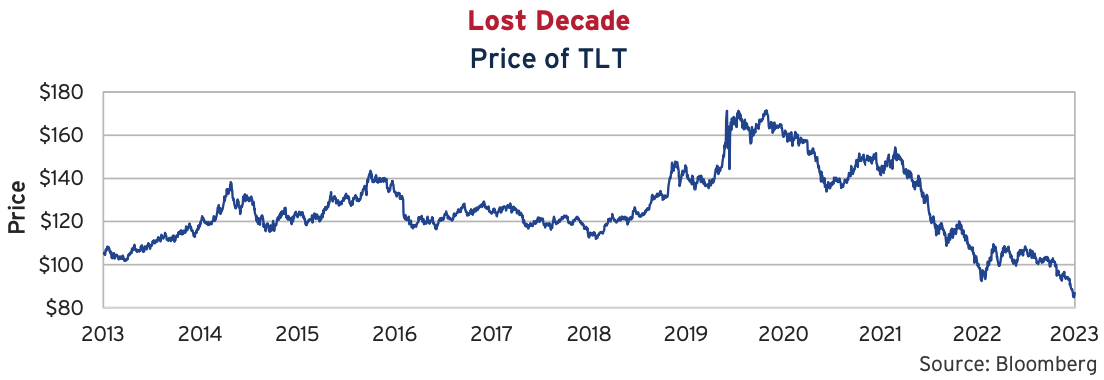
Following its 50% drawdown, TLT is trading well below its price from a decade ago. When factoring in distributions, the iShares.com website indicates $10,000 invested on October 17, 2013, would have grown to $10,127 over the following 10 years.
The Upside of Down Markets
To highlight just how far rate rises have taken us over the past 2 years, we dig into the FTSE Short Corporate. At the end of 2021, there were 398 bonds in the FTSE Short Corporate Index. Of this total, the vast majority traded at all-in yields between 1% to 3%. There were only 9 bonds priced at yields above 3%, and only 2 above 4%.
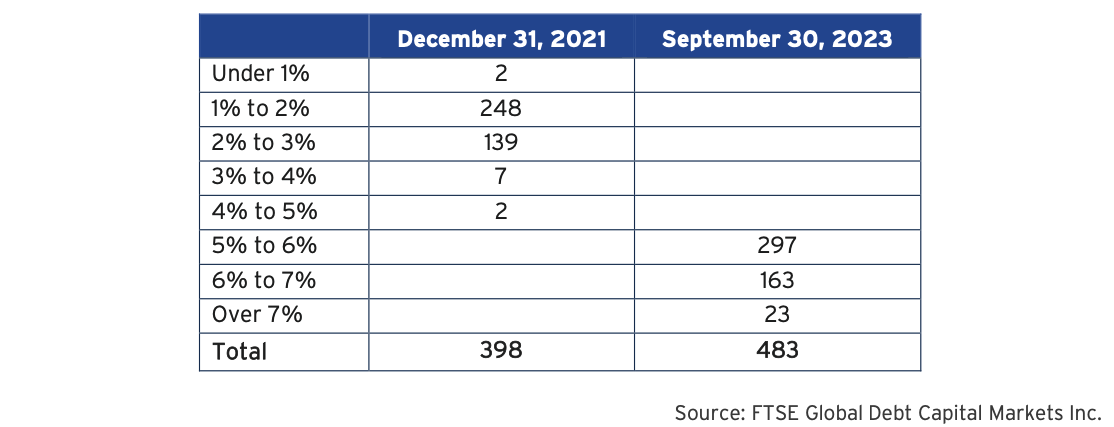
Fast forward to September 30, 2023, and investors are increasingly compensated for holding short-term, high grade corporate bonds. Significant rises in government rates may have made the last two years miserable for bonds investors, but looking forward, prospective returns are attractive. There are now 483 bond issues in the Short FTSE Corporate Index – all of which are priced to offer yields higher than 5%. Furthermore, 23 are priced at yields above 7% (warning: better do your credit work on these). Investors are finally receiving decent compensation in the short-end of the investment grade universe.
It’s All Relative
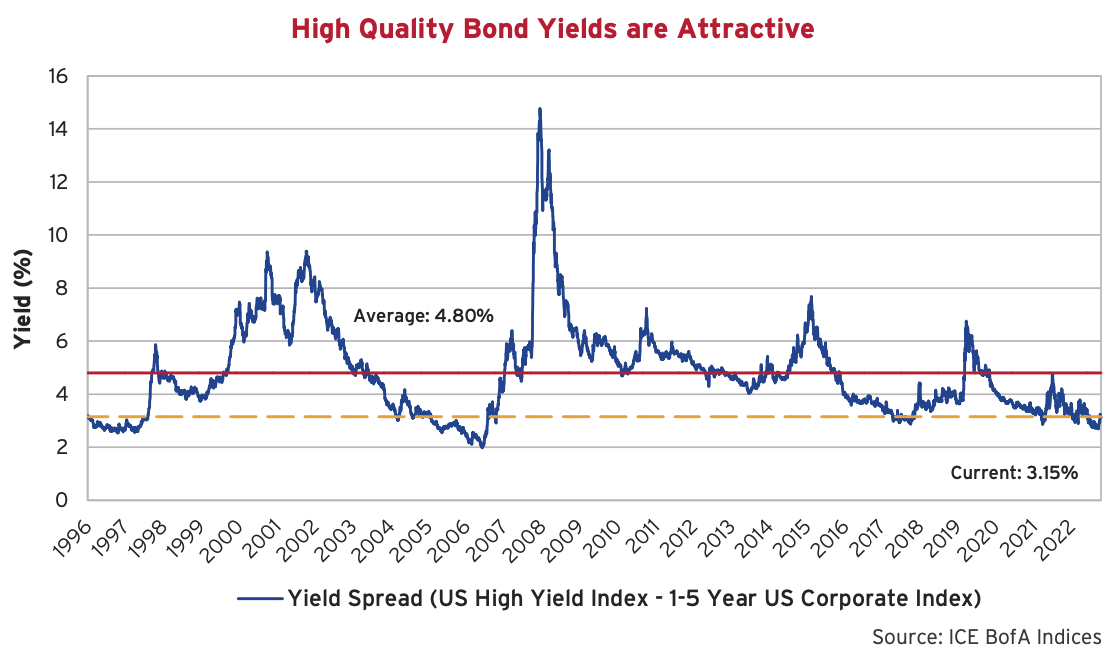
High quality bond yields are also increasingly attractive relative to the more speculative high yield market. At just over 9%, the all-in yield of the ICE BoA U.S. High Yield Index has captured the attention of yield starved investors. In absolute terms, this may seem appealing coming off all-time low yields, but relative to the yield of short term investment grade corporates, it leaves a lot to be desired. Below we have plotted the difference in yields between the U.S. high yield and short investment grade indices to illustrate. At just a 3.2% trade-off, we are happy to insulate our portfolios with high quality bonds.
The Bottom Line
Longer duration bonds of the Broad indices in Canada and the U.S. were the worst performers in the quarter and have given back their year-to-date gains. Not far behind these laggards were the Investment Grade indices that suffered a similar duration fate. Cautious credit spread tightening and higher running yields only modestly helped offset price declines due to rising rates. The Investment Grade bond indices in both countries remain only slightly positive on a year-to-date basis. Further yield increases to close-out the year would mean unprecedented third straight annual declines for these markets.
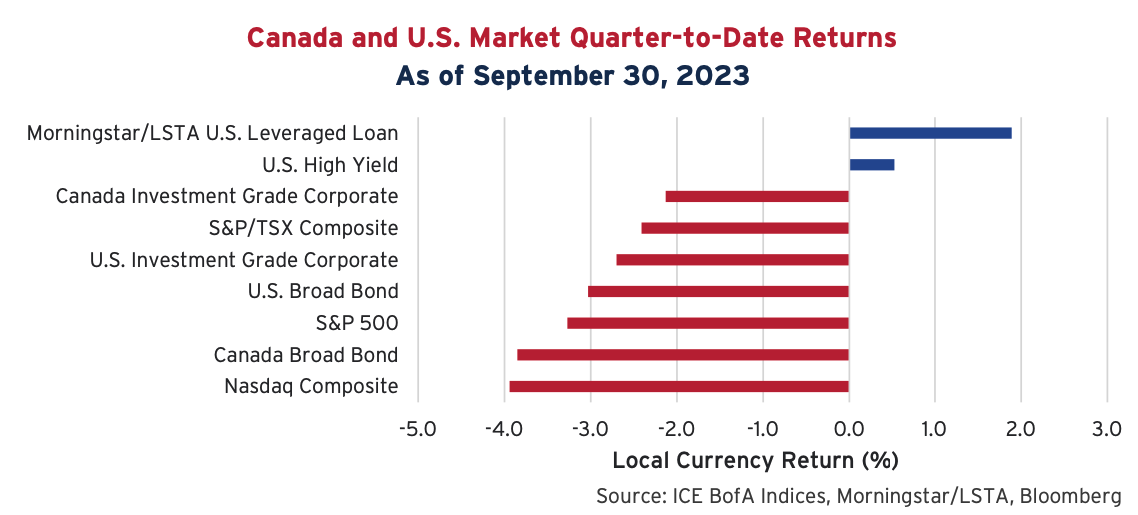
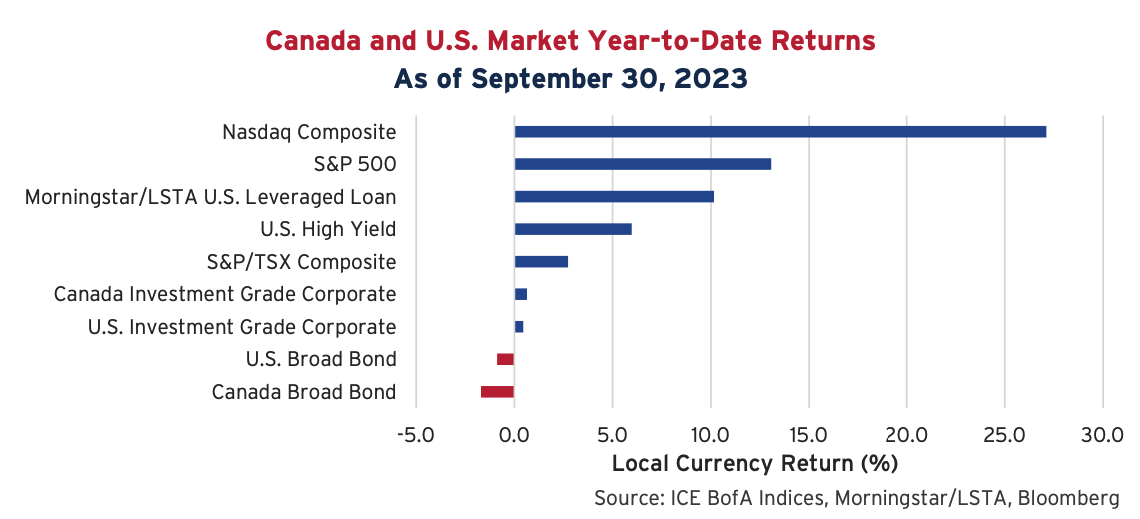
Despite the rise in rates, not all bond markets were negative on the quarter. High yield and leveraged loan credit spreads continue to outperform on a year-to-date basis. These markets have warded off defaults and dodged concerns of a “not so soft” landing. Their short duration and, in the case of levered loans, their rising coupon payments have led these indices higher. Equity markets gave back some of their first half gains but overall remain strong performers over the first three quarters of the year.
Corporate Action
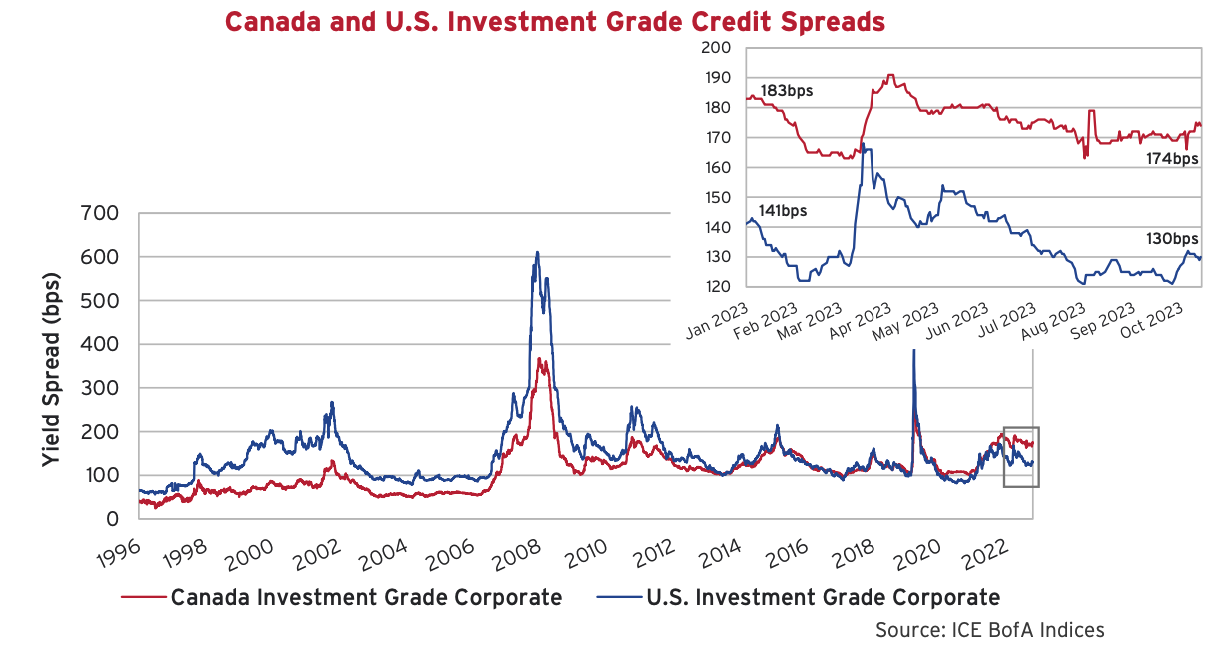
In contrast to the volatility in government rates, corporate credit spreads have remained relatively stable. Canadian investment grade spreads were 171 basis points to end the quarter and U.S. spreads were 127 basis points, representing 4 and 7 basis point tightening, respectively, over the period. Spreads in the U.S. retraced their tights this year in both July and September and continue to be firmly inside of the historical average of 147 basis points. In Canada, the February tights remain elusive, and spreads continue to represent reasonable value.
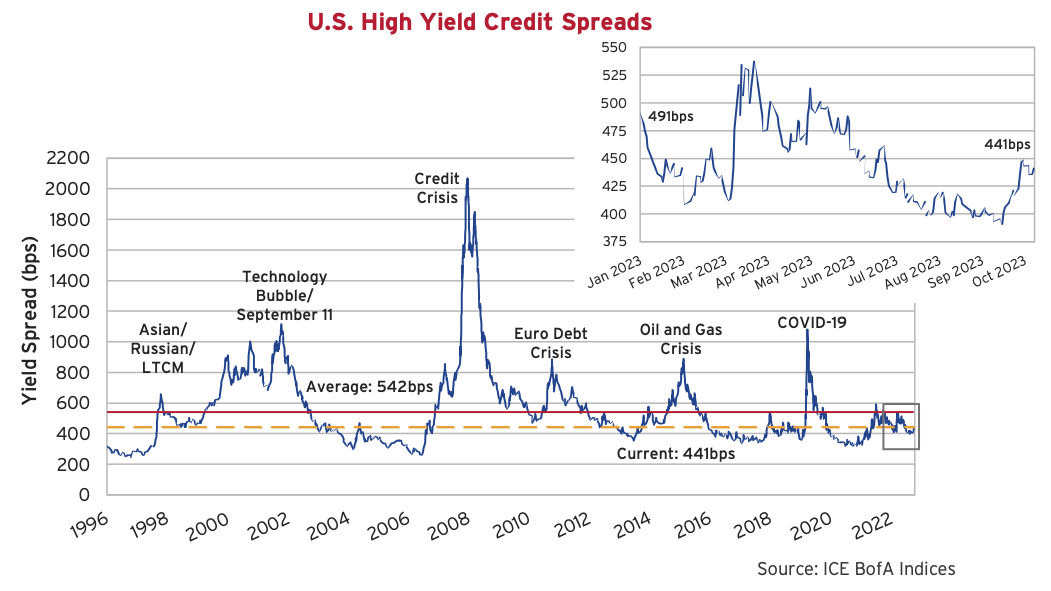
High yield spreads were also well behaved, tightening 9 basis points to end the quarter at a spread of 416. Spreads dropped below 400 basis points in both August and September and are well inside of the index series average. The lowest quality issues continue to outperform and fly in the face of tightening market conditions. We continue to believe that spreads aren’t offering enough of a risk premium to compensate investors in what is the most speculative end of the credit market.
Disappearing in Silence
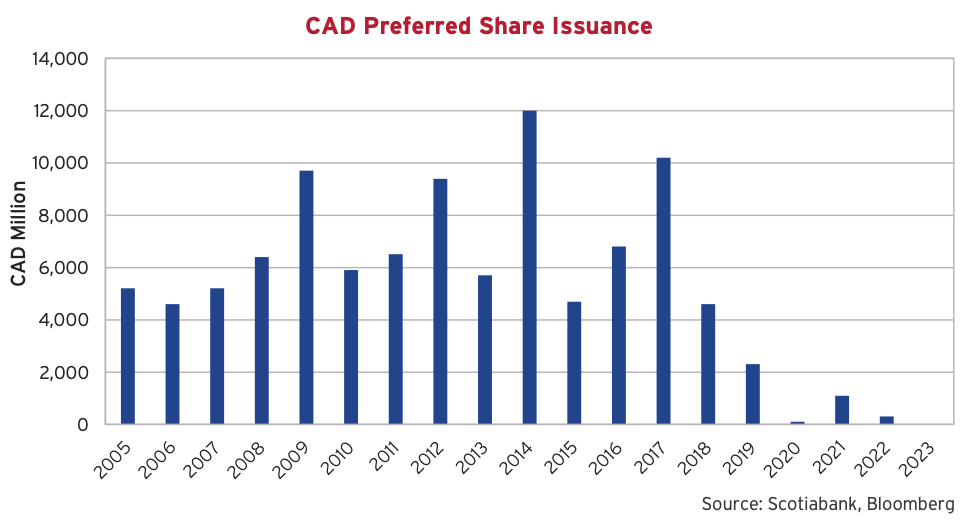
The Canadian retail preferred share market is disappearing in silence. The market has seen zero new issues in 2023 and only two deals priced in 2022. This extremely quiet time in the market has been helped by low levels of redemptions, but overall, the market has continued to shrink. Since 2016, the size of the retail preferred market in Canada has declined from $60 billion to $40 billion. In a world of substantial inflation and active capital markets activity, it’s not easy to find a market that is outright declining.
A primary reason for the reduction in size of the retail preferred share market is the push from OSFI – Canada’s federal banking regulator. OSFI’s goal is to shift risk from retail hands into institutional hands. The regulator seems to feel that preferred shares’ complicated structure and large volatility make them unsuitable for average retail investors, particularly those using them as a higher yielding substitute for bonds. We find this interesting as these securities are in a second loss position following bank common shares, which we do not anticipate regulators limiting retail investors from purchasing.
Shifting Tides
Banks have spent most of the last decade calling legacy preferred shares and replacing them with Non-Viability Contingent Capital (NVCC) preferred shares (which can be converted into common equity at the option of the regulator). The introduction of Limited Recourse Capital Notes (LRCNs) in 2020 further disincentivized banks from issuing retail preferred shares. LRCNs rank equally with preferred shares but their interest payments are tax deductible – making them attractive for banks to issue. OSFI limited the amount of LRCNs that banks can issue, but will allow that amount to increase if banks have other “institutionally issued” equally ranking capital. As a result, Canadian banks have stopped issuing new preferred shares to retail investors and have shifted to institutional investors.
Separately, the retail preferred share market is in decline due to the rise of hybrid bond issuance. Many Pipeline, Utility and Telecom issuers that have traditionally issued preferred shares have shifted to issuing hybrid bonds. Rating agencies view these bonds as part debt, part equity, helping borrowers keep leverage levels down and credit ratings high. Like LRCNs, these bonds also benefit from a large market size and the tax deductibility of interest payments.
Although swapping dividend payments for interest payments is attractive from an issuer’s perspective, taxable retail investors should be sad to see this market go.
Pipe Dreams
The eighth and tenth largest issuers in the Canadian corporate bond market announced significant transactions in the third quarter. Enbridge announced a US$14 billion acquisition of three gas utilities from Dominion Energy while TC Energy announced a 40% sale of its Columbia Gas and Columbia Gulf assets and its intention to split into two independent companies.
The Enbridge acquisition is a bet on gas distribution and will expand the company’s operations into Ohio, North Carolina, Utah, Idaho and Wyoming. Enbridge plans to finance the deal with a mix of senior unsecured debt, hybrid debt and common equity. The company raised CA$4.6 billion of common equity in the days following the acquisition announcement and successfully tapped the bond market in the following weeks, raising US$2 billion of hybrid bonds in the U.S. and CA$1 billion of hybrid bonds in Canada. The hybrid debt carries a BBB- rating, 2 notches below its BBB+ senior unsecured rating and only 1 rung above junk status. The successful equity and hybrid offerings will help keep leverage at manageable levels and should ultimately help allay fears of a credit downgrade.
TC Energy has been beleaguered by cost overruns at its Coastal GasLink project and stubbornly elevated leverage. As a result, rating agencies have been keeping a close eye on the company. In an effort to reduce debt, TC Energy announced the sale of a 40% equity interest in its Columbia Gas and Columbia Gulf Transmission systems for CA$5.2 billion. Uninspired by the sales price or the speed at which the company is reducing its debt load, DBRS downgraded the company to BBBH while Moody’s downgraded them to Baa2.
Shortly after the announced sale and downgrades, TC Energy announced its intention to split into two independent companies. One entity will focus on liquids pipelines and the other on natural gas and energy solutions. This transaction, which is expected to occur in late 2024, will allow the separate companies to pursue their own growth, streamline the organizational structure and, most importantly, target separate leverage levels.
High Funding Costs
The U.S. high yield market has seen over US$40 billion in issuance in each quarter of this year, which is up from historically depressed levels in 2022, but quite low relative to the US$1.2 trillion market size. Higher financing costs continue to keep many high yield issuers on the sidelines. The graph below illustrates sharply higher new issuance yields, which kicked back up in the latest quarter, ending the period at 8.8%.
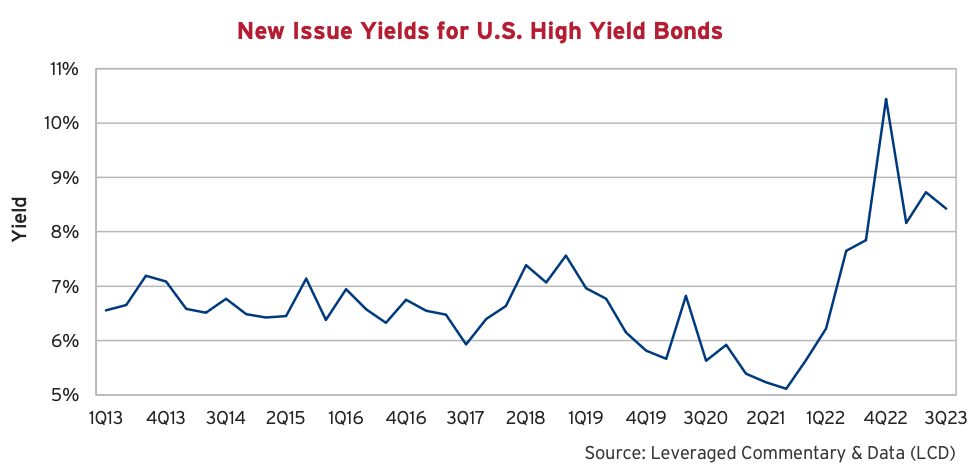
The graph does not include the subsequent pricing of Viasat’s 7.5% senior unsecured issue, which came to market at a substantial discount to par to yield over 15%. According to LCD, this marked the second highest unsecured new issue bond yield since the Great Financial Crisis.
Securing Funds
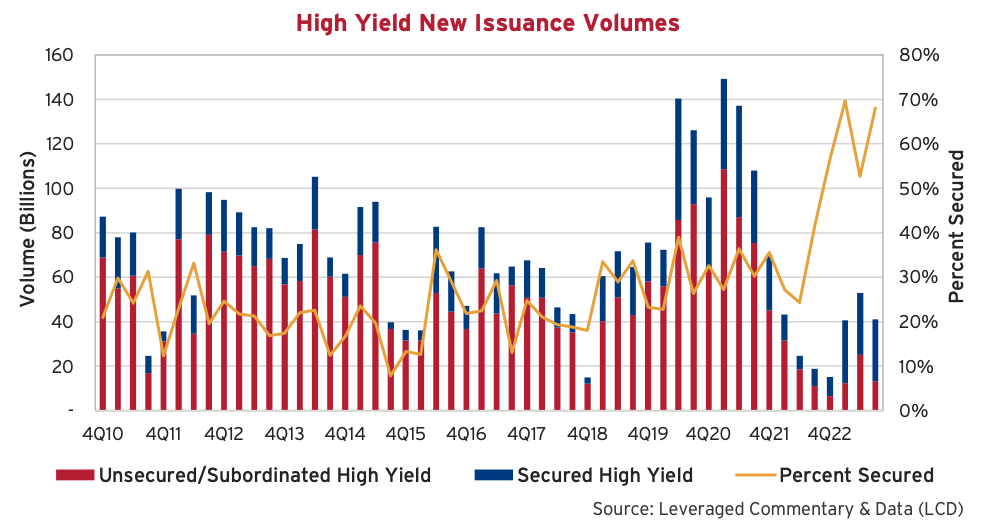
More and more high yield issuers are turning to secured deals to minimize the impact of higher coupons. For some lower quality issuers, they are doing so by necessity. The chart below plots quarterly new issuance volumes broken down by secured and unsecured issuance. It also expresses secured volumes as a percentage of total issuance to demonstrate the sharp rise to unprecedented levels. The high yield market has never recorded a year with more than 50% in secured issuance.
Rate of Conversion
Whereas high yield issuers have turned to offering up security to lower their coupon costs, we are now seeing an increasing trend of high grade issuers offering equity upside to lower theirs.
“Investment-grade borrowers have sold $12bn of convertible bonds so far this year, more than 30 per cent of total issuance, according to data from Bank of America — the highest share in at least a decade and three times the average rate. Highly rated companies sold just $2bn of so-called converts in 2022, or 7 per cent of the overall market.” Source: Harriet Clarfelt and Nicholas Megaw. Top-rated US companies turn to convertible bonds as rising rates bite. Financial Times, September 26, 2023
As financial conditions tighten and issuers are forced back to the market at higher rates, we will not be surprised if these trends continue. As lenders, we spend our days looking at price and terms. If borrowers want to avoid higher prices, making terms more attractive for lenders is a good start.
Colder Weather
The cruel bond summer has turned to fall and with it comes crisp air, falling leaves and pictures of apple picking and bonfires posted to Instagram. For the bond markets, positive returns hang in the balance in this final quarter of the year amidst sustained uncertainty in yields. Thus far in October, credit spreads have been resilient despite a backdrop of negative economic and geopolitical events. From an investment standpoint, we remain patient. Elevated funding costs and a tighter new issue market for more speculative issuers will inevitably lead to value opportunities. Until then, our investment focus continues to point towards quality and liquidity to shelter from the colder weather ahead. In the words of Zac Brown, “Maybe tomorrow will be better, Can I call you then?”.