

Rejoicing Markets
The financial markets in 2021 continued to rejoice in the plentiful supply, if not oversupply, of money. As the table below shows, all the conventional money produced by central banks proved popular with investors, even the digital ones, and ended up powering the financial markets to another very strong year. The stock market had what might have been considered a great year in previous times, but the real price pop came from digital currencies with Dogecoin, the favourite of the digitally cool crowd, up 1,702.8%. This was followed by Bitcoin at 59.8%.
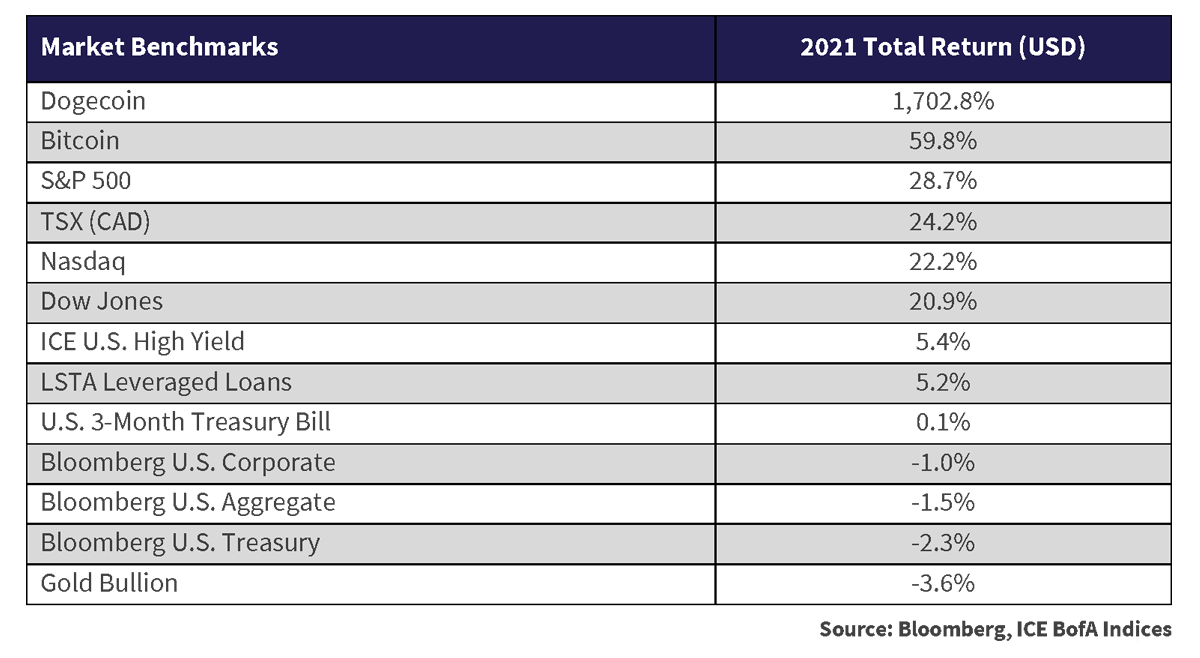
We find it interesting that Bitcoin, created to protect against the inflationary predations of governments with their “Fiat Currencies”, has soared on the wings of excess central bank production of that very thing. Its crypto cousins have done even better in the mania for all things digital made possible by central bankers running their presses overtime. The riskier and more speculative an “asset class,” the more elevated its return was last year. The 28.7% return of the S&P 500 Index and the 22.2% of the tech laden Nasdaq seem a tad pedestrian and passe compared to the riches created by the crypto financial mania. The joke was actually on the investors in the so-called “safer” asset classes last year when Dogecoin, Bitcoin and stocks left them well behind in the asset class derby.
Safe and Sorry
Cash, the normal place of refuge in market setbacks, returned virtually nothing, with a .1% return on U.S. T-Bills when the virtual world was on fire and making its proponents wealthy. Bonds were not a place of safety, but one of the only places where you could lose money. The only bonds that showed a positive return for 2021 were the riskiest, with high yield bonds turning in a 5.4% return. Investment grade corporate bonds were negative, at -1.0%, as their yield and the bid for risk offset the general rise in bond yields. Returns were negative for the normally safe Treasury bonds in the U.S., at -2.3% on rising government bond yields. Gold bullion, supposedly a safe haven in turbulent times, was -3.6% as speculators fled actual gold in their rush to stake claims in the gold mines of the digital world.
The Omicron Grinch that Saved Christmas Yields
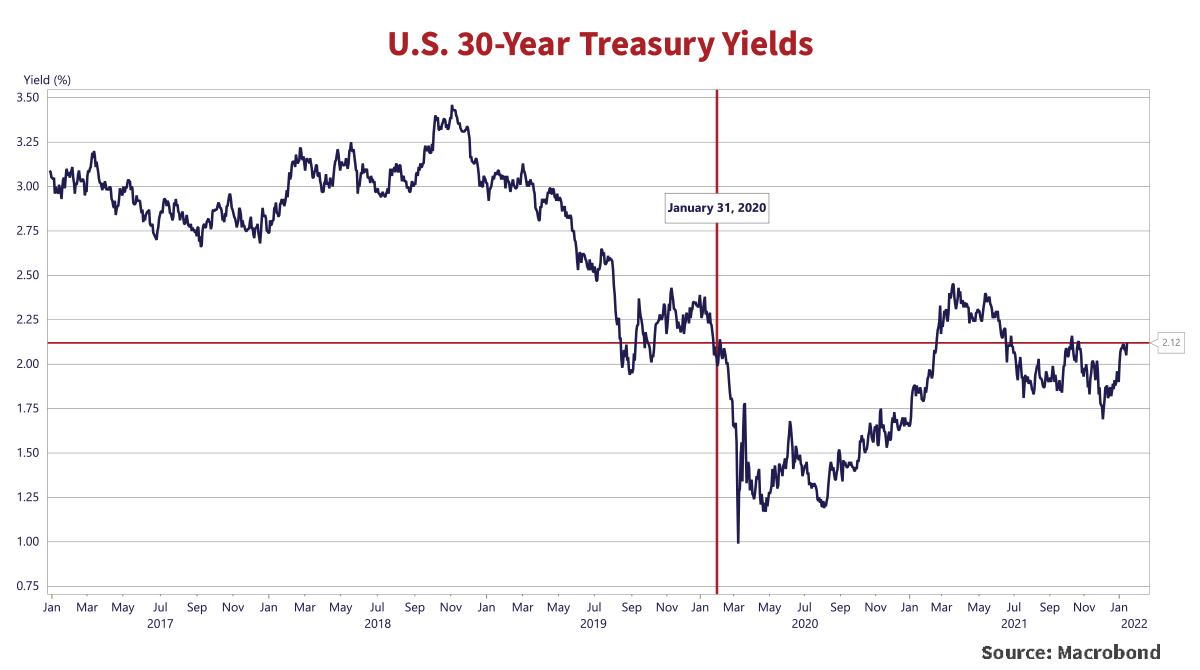
Things might have been much worse for bonds without the Omicron Grinch that saved Christmas yields. The chart below shows that the long Treasury yield had risen to the 2% level in the summer, as COVID-19 fears faded and a consensus formed around a “normalization” of interest rates. News of the virulent Omicron strain of COVID from South Africa surfaced the last week of November and put fear back into the bond market. The closing yield for the long Treasury on November 23rd was 2.02%, but it dropped to 1.82% by November 26th on Omicron fears. The low yield came on December 3rd at 1.68%.
A drop of .34% in yield doesn’t sound like much, but for a long-term bond, that translates to more than a 6% increase in price when yields were at their lowest in December. By year end, at the December 31st early market close, yields had risen back to 1.9%. That was still much lower than the 2.45% yield of the spring of 2021 when vaccines were rolling out and things were getting back to normal, but enough to limit the damage to the bond market in the U.S. to the acceptable level of the -2.3% for government bonds in the table above. On the other hand, when so-called “safe assets” lose any money for investors, there is consternation and a feeling of betrayal at the loss.
Yielding to the Pre-COVID Future?
Things are not looking too good for bond investors so far in early 2022, as the Omicron drop in yields and rally in bond prices has sharply reversed. Long Treasury yields have risen from their Omicron panic low yield of 1.68% on December 3rd to the current 2.11%, a rise of .43%. The -1.3% return of the Bloomberg U.S. Aggregate Bond Index year-to-date in 2022 is already over 80% of its total damage of -1.5% in 2021. As the chart above shows, the closing yield of 2.12% on January 14th, 2022 is now above the 1.99% at the end of January 2020, just before the COVID pandemic started.
These COVID market-sentiment shifts have caused some of the largest one week increases in the long Treasury yield in recent times. As the table below shows, the first week of 2022 saw a .21% increase in the 30-year Treasury yield, as investors looked at the portents of higher inflation and moved past their Omicron fears. It did not help that Fed officials were telegraphing that they thought their incredible monetary policy ease was no longer required, given the portents of a strong and recovered economy.
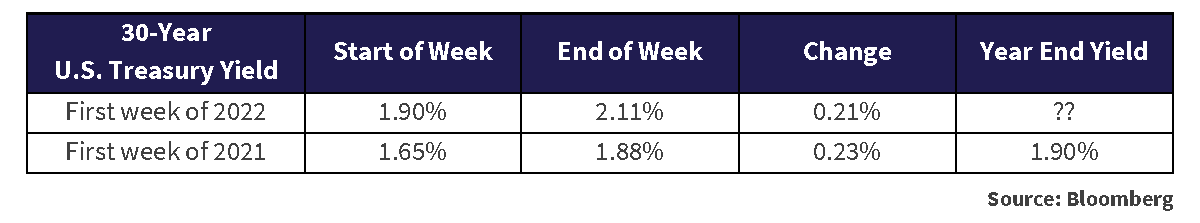
A continued rise in yields is not assured. The 30-year Treasury yield did much the same thing last year in the first week of 2021, up .23%, about the same as this year’s increase. By year end 2021, however, due to the Omicron rally in “safe” bond prices and resulting drop in yields, the 30-year Treasury rates only went up an additional 2bps for the rest of the year.
The real question for the financial markets is when the Fed and other central banks will raise interest rates and make money scarcer. They certainly have broadcasted their intention to do so, but the move of central bankers from the backrooms to centre stage stardom complicates matters, as we talked about in our December Market Observer. Their popularity will wane with the financial stricture necessary to restore normalcy to interest rates and deal with inflation that might not prove to be “transitory.”
Carter’s Political Non-Starter
Jimmy Carter paid the political price for Fed Chair Paul Volcker’s high interest rates in 1980. Volcker pushed up rates and caused a severe recession that finally defeated inflation. Carter thought this was in the national interest but then lost the 1980 Presidential election to Ronald Reagan.
Today’s crop of politicians put their personal interests and election success well ahead of anything else. That means we’re not hopeful that the politicized central bankers of our current era will have the gumption to act independently and “remove the punchbowl” as their forebears did. The current polarized political situation in the U.S. has many politicians adhering to bizarre conspiracies and “beliefs” that conflict with evident truths to garner voter affection, so we don’t think there will be much political support for a strong dose of monetary discipline if it hurts at the polls.
Dwarf Fiscal Stars
The current plan was to stop Quantitative Easing (QE), the buying of government and corporate bonds put in place during the pandemic to ease credit and fund government borrowing. The money borrowed this time around dwarfs prior fiscal stimulation outside of wartime. It now looks to us like the Fed is recognizing that perhaps the COVID economic situation was not as dire as it feared, and its response was outsized for the problem of a medical emergency. It seems that it didn’t need to be extended for so long, especially given the unexpected and powerful fiscal stimulus delivered by politicians not shy about borrowing to reward their populist followers.
Bond Seniors
As we’ve pointed out in some of our earlier tomes on the subject, yields have been declining for almost the entirety of our investment careers. That’s a long time since some of us are now bona fide senior citizens. The danger in this is the cavalier attitude of many in the bond market, who are too young and inexperienced to seriously consider the risk that one day yields might rise on a sustained basis.
A friend of Canso recently asked us, with genuine concern, why a very large Canadian bond mutual fund managed by another portfolio manager had a very long duration of nearly 8 years. He wondered at the wisdom of this from a client risk point of view. Duration is the measure of the interest rate sensitivity of this fund and means that it will go up and down about 8% in price for each 1% change in the prevailing bond market yield. This seemed to our friend to be a rather risky thing from a retail unit holder point of view, considering that he believed, as we do, that interest rates are inevitably headed up. The issue here is what an economist would call “agency,” where an “agent” has a different interest than the owner of an asset, in this case the unit holders of this bond mutual fund.
Bonus Points of Duration
The FTSE Canadian Bond Universe Index started 2022 with a duration of 8.4 years and is probably the performance benchmark for this fund. That means the portfolio managers involved with this fund are assessed and given bonuses in comparison to this benchmark, so they have different interests than the unit holders of the fund. Most managers have a slightly shorter duration of 8 years. This means their fund will only fall about 8% if there is a 1% rise in yields, outperforming their benchmark by 0.4%.
That might not seem to be sufficient protection for our friend, but it is a fairly major statement by this bond manager. Most bond portfolio managers hug the market duration benchmark quite closely, since their career and compensation depend on staying close in performance to their benchmark. As we’ve said repeatedly in our previous newsletters, any bond manager who shortened their portfolio duration substantially over the last 40 years has probably suffered for it, both monetarily and career wise. They and their peers have learned to keep close to their benchmark duration. Over the longer term, only .25% in return separates the top 25% of bond managers from the median managers, so making a wrong call on duration can lead to disastrous performance.
Giant Steps from Central Bankers
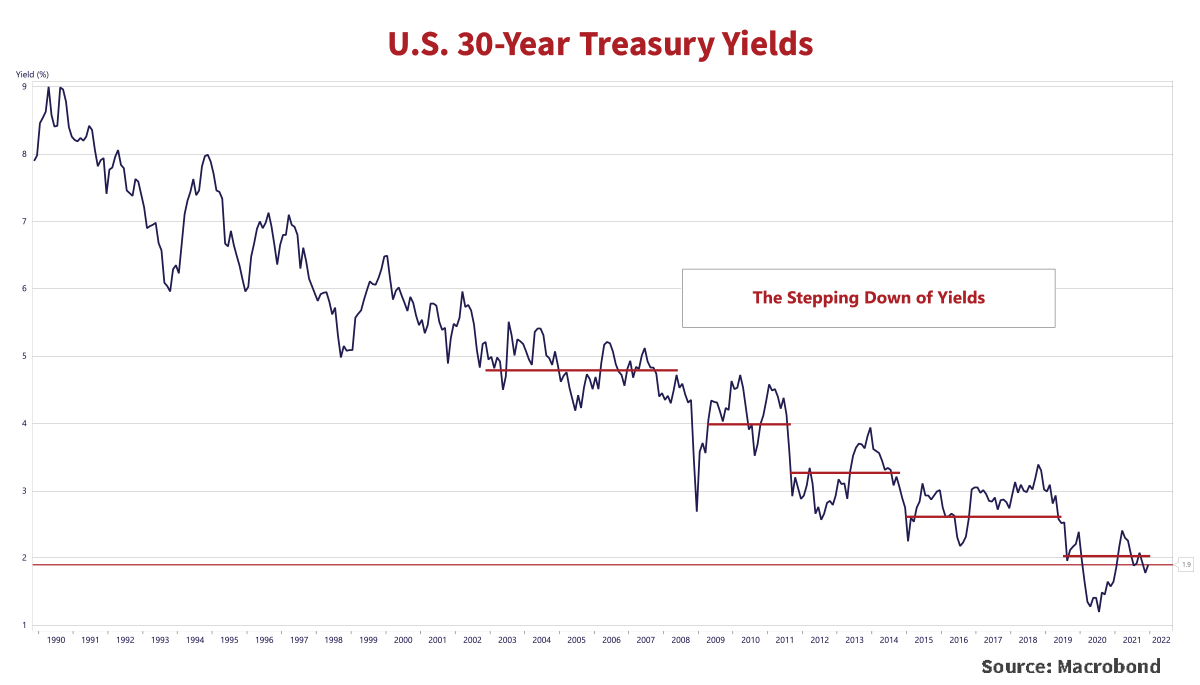
The chart below shows the long U.S. Treasury yield since 1990, when the “inflation targeting” regime of monetarist central banks became popular. Long yields fell consistently from 1990 to 2000. Yields have stepped down since then with each episode of our central bank superheroes fighting financial Armageddon. The long Treasury yield held in the 2000s at 4.5%, then dropped to 4% after the Credit Crisis of 2008, but then stepped down to 3.5% with the QE response of central banks to the Euro Debt crisis. There wasn’t even a financial crisis in 2019 when the Powell Fed surrendered to Donald Trump’s Twitter attacks and took long yields back down to 3% for no apparent reason except the approaching 2020 Presidential election. An actual crisis with the COVID pandemic took long Treasury yields below 1% in the early stages of the panic. The close on March 9th at .997% during the COVID market panic likely set a record low yield, but who knows what will happen in the next crisis.
Monetary Best Before Date?
The real question for us and other bond investors is: Why are we holding any fixed-rate bonds with yields so much below prevailing inflation? The Federal Reserve and other central banks have done well in convincing the bond market that inflation will be “transitory”. With now even the Fed questioning the wisdom of its massive monetary stimulation when government deficit financed spending is in high gear, easy money looks like it is past its Best Before Date. As “economist” Bob Dylan might say, “monetary times, they are a-changing.”
The Highest Inflation in 40 Years!
The U.S. annual CPI for 2021, reported on January 12th, 2022, was 7.0%, year-over-year to December 31st. The Washington Post headline said it all:
“December prices rise 7 percent compared with a year ago, as 2021 inflation reaches highest in 40 years
Officials within the Fed and Biden administration expect high inflation will persist through much of 2022”
If the unnamed “Officials within the Fed and Biden administration” are concerned about the highest annual inflation in 40 years, they certainly aren’t saying it. The bond market wasn’t concerned as it shrugged off the seemingly bad news that inflation was 3.5 times the Fed target of 2%. The 30-year Treasury ended January 12th up only .03% in yield, starting the day at 2.07% and ending at 2.10%.
Yield to History
To get a historical perspective, we need to look at the 10-year Treasury bond since the U.S. Treasury only started to issue 25-year Treasuries in 1974 and replaced it with the 30-year in 1977. It is fascinating that the U.S. government lengthened the term of its debt issuance in the very high inflation 1970s. Could it be the attractiveness of paying off debt in hugely depreciated U.S. dollars?? Inflation above 10% makes a fixed debt fall in real value very quickly as the nominal cashflows in an economy compound upwards in rapid fashion.
The chart below shows the historical yield back to 1950 on a 10-year U.S. bond versus 12-month year-over-year U.S. CPI. It shows only 2 periods when the CPI was so much higher than the 10-year yield. Frankly, it is the 4-year period from the Oil Embargo in 1973 to 1977 that is an eerie historical parallel, and that concerns us greatly. Very loose monetary and fiscal policy were used then, as now, to deal with an exogenous macroeconomic shock. It worked then to soften the economic damage of soaring oil prices as it has during the COVID pandemic. The problem was, as we’ve said often in these pages, that more money is always politically more popular than less money. Tightening monetary policy after a crisis has passed is a very difficult thing to do.
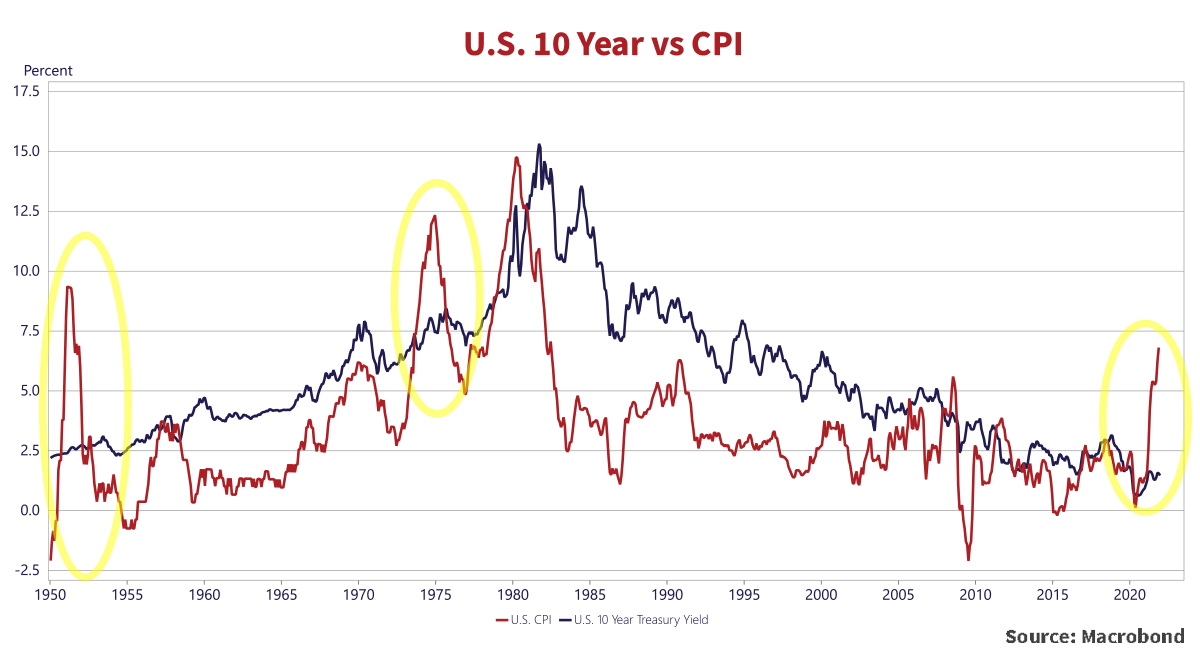
We now have a similar situation and set-up. The pandemic was met with the most powerful fiscal stimulus outside of wartime, which was very politically popular, even with Donald Trump’s formerly fiscally responsible Republican colleagues. President Biden has continued Trump’s spending ways and the political polls show high support for it to continue. The “Progressives” of the Democratic Party are demanding even more government spending largesse. They are showing their obvious displeasure with the few Democrats who do not support further stimulus and the massive spending initiatives incorporated in the Biden Administration’s legislative agenda.
We have said many times in these pages that it is a difficult thing to forecast the course of interest rates and bond market yields. We prefer to assess the value of securities, and that is what most of our clients pay us to do. They give us our target durations, since they have their own investment policy needs. We then add value for them by buying cheap corporate bonds, which we have done well.
Hopefully Transitory, Not Compensatory
On the other hand, we do have some bond portfolios where we are mandated to alter duration. We are short of our duration benchmarks in these and are moving more defensively. We get there by a straightforward bottom-up analysis, rather than trying to predict unpredictable economic factors. We’ve pointed out many times in these pages that interest rates are the price of money and they are not just low, they are very negative if inflation is taken into account. Those holding fixed-rate bonds had better hope that inflation falls, since the current “real” yields on bonds (yield to maturity less inflation) are running at very negative levels. Even if inflation proves “transitory” and miraculously drops to the 2% target of the Federal Reserve, with bond yields at .5% for the 1-year Treasury note and 2.09% for the 30-year, investors aren’t getting adequately compensated for their fixed stream of coupon payments.
Withered Fixed-Rate Bonds
When compensation is inadequate and the probabilities are against us, we prefer to not risk our money. As we have said before, the persistent low level of bond yields due to continued central bank ultra-easy monetary policy is increasingly leading to investors questioning the value of bonds as part of their portfolio. We tend to agree. To us at Canso, we prefer near term and more likely cash flows to those way out in the very uncertain future. Bonds these days offer very low interest rates that are well below prevailing inflation and promise principal repayments in depreciated future dollars.
There is an alternative to “fixed-income” securities, which are bonds with fixed coupon payments as their suggests, called floating-rate bonds. Floating-rate bonds pay a coupon which “float” or change with prevailing market interest rates. They’re still bonds but promise to pay interest that moves up and down with the market rate that they are based on. If you think interest rates are destined to fall forever or have liabilities that you need to match in term, then fixed-rate bonds should be your choice. If you just require income and don’t want to lock yourself to a fixed payment stream when inflation and interest rates might finally be increasing after 40 years, floating-rate is a great choice.
Cold on Hot Markets
In the market panic in March 2020, nobody was buying and everyone was selling, so we found a lot of great deals. Now we have the opposite. Things are as hot as we’ve ever seen for “risk assets.” The investors who were paralyzed by fear in 2020 have now bid everything up in value. The speculator’s favourite is now anything “Crypto” or “Digital.” As we’ve said in past newsletters, we are not convinced that digital currency and coins are really a “Store of Value” in a traditional financial sense.
A Parody Makes Good
As CoinDesk.com explains on its website, Dogecoin, which appreciated 1,702.8% last year, was created as a joke to mock the mania in digital “Coins.” One would think that CoinDesk would have toned down the reality of this investment on their website, considering that they make their money from digital coins. Surprisingly, they didn’t sugar-coat the unbelievable tale of a joke that became worth billions:
Let’s see: “a parody cryptocurrency,” which was “never designed to have any real-world utility” doesn’t sound like a real “store of value” to us, even with the full faith and credit of the digital investment community behind it. The joke seems to be on the unfortunate creator of Dogecoin who didn’t keep any, as the meme investing crowd bid up Dogecoin’s price into the financial stratosphere, as we commented in our December edition. What’s not to complain about if you’re in the business of manufacturing financial products, particularly the digital currency variety?? No matter how tenuous the claim on actual or potential cashflows, eager investors have been rushing in. As poet Alexander Pope said a long time ago, “Fools rush in where Angels fear to tread.”
Beauty is in the Eye of the (Beeple) Holder
The current financial mania includes some of the most nonsensical investment idiocy we have ever seen in our investment careers. When money and capital are too plentiful, then investors join the herd and buy anything they can get their hands on. Below we present $91.8 million worth of digital artwork.
This black rectangle with three white orbs is a Non-Fungible Token (NFT) entitled Pak’s The Merge.

It sold for U.S.$91.8 million on December 2nd, 2021, breaking the previous NFT price record of Beeple’s Everydays: the First 500 Days which sold for U.S.$69.3 million in October of 2020.
We understand that very wealthy people buy lots of things for their beauty, the pride of ownership and probably to display their wealth. Large amounts of money are spent on art auctions, and our tastes run towards tangible physical art, so we can understand when Leonardo DaVinci’s Salvator Mundi sold for U.S.$450.3 million in 2017. We would hazard a guess that the speculative mania in all things digital is at work here with NFTs. It might be that the group of people who acquired The Merge find its beauty overwhelming, but we believe that there’s a large amount of greed involved here. Then again, if you’ve made billions on a joke digital currency like Dogecoin, you just might believe in the value of NFTs.
Digital Bread
Our Canso Spidey-Sense starts to tingle when acquaintances start telling us they’re putting significant sums of money in crypto, buying digital land in the Metaverse, and dabbling in NFTs. A colleague’s relative boasted about his recent purchase of a stable of crypto racing horses, including a stud producing offspring that are netting him a handsome profit. When there’s so much money being made so quickly with so little effort for the fortunate involved, the rest of society watches with envy until they can no longer resist. At that point, it becomes a full-blown financial mania. August people and institutions feel the need to be involved, lest they lose their high societal status.
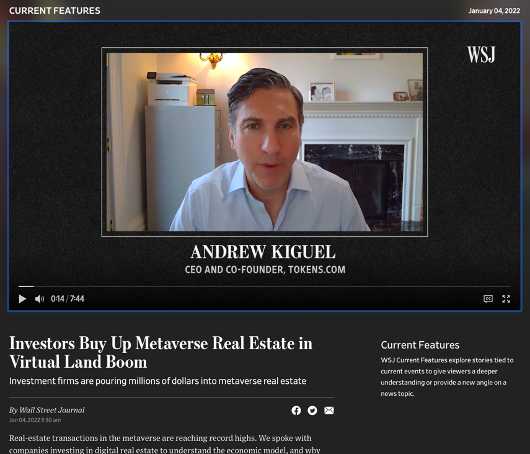
So, they too opine about the good and great fortunes available. The screenshot of the Wall Street Journal video is evidence of this happening. Andrew Kiguel, notably the CEO and Co-Founder of Tokens.com, waxes eloquently and expertly that buying land in the Metaverse is like “buying land in New York 250 years ago”.
We beg to differ with Mr. Kiguel. Something that is physically scarce and can’t be replicated has innate value. Actual beachfront in the Caribbean can’t be replicated easily in Edmonton, Alberta. The West Edmonton Mall is a reasonable physical substitute on a frigid winter day after a lot of sunk building costs and energy expenditure. Digital worlds are certainly valuable to those who want to use them, but the potential competitors are as infinitely available as the infinite internet capacity to host them. When something more attractive is “developed,” we believe there will be a lot of digital ghost towns in the Metaverse. Digital success can be fleeting. The fate of Napster, AOL and Yahoo come to mind.
Canso’s Digital Backbone
You’re probably thinking that Canso is old, ossified and out of step with the digital miracle around us. We beg to differ. Canso has been a great supporter of technology and things digital for many years. Our portfolio management system, Toogood Evolution, has been in the cloud since 1997, before there was a cloud. We are a co-owner of PortfolioHiWay, the first full service digital IIROC investment dealer in Canada and have directly invested in many successful digital companies.
This is not happenstance. Our founder and CIO, John Carswell, has had a long-term interest and involvement in technology. He was one of the creators in 1996 of the Financial Pipeline, a financial education website, before the dot.com internet boom. It is one of the oldest continuing websites on the internet and John did much of the original HTML programming. He was invited to give a presentation to the Association for Investment Marketing and Servicing in 1998 on the “Implications of the Internet” and told his audience that the internet would forever change the business of portfolio management, as it has.
Digital Speculations are Not Different
As we told you above, we have taken advantage of digital innovation for many years at Canso and it forms the core and the future of our business. As our clients well know, we have made many successful investments in technology companies. On the other hand, we recognize the makings of a financial bubble forming when we see one. As students of financial history, we know that new technologies lead to financial mania, where the promise of untold riches leads inevitably to financial disaster for many.
Slowly the promise of new technology becomes a societal mass hysteria, where believers trumpet their financial successes, and the few remaining skeptics are forced into silent submission at the risk of being shunned by their peers and betters. There is little difference between Mr. Kiguel promoting land purchase in the Metaverse in 2022 and John Law promoting the untold riches of the new French colony in Mississippi over 300 years ago in 1720. Both are very new and exciting ideas and worlds that capture societal imagination.
Both rely on the issuance of an excess of the fiat currency of their time. John Law created paper money and the Banque Royal, the world’s first central bank, to allow the soaring stock price of the Mississippi Company shares and to finance France’s debts. Mr. Kiguel is relying on the monetary largesse of Law’s central bank descendant, the Powell Federal Reserve, continuing to cheapen their U.S. dollars to power Kiguel’s Metaverse holdings to untold riches for him in the real world.
We are not good company at a dinner party at a peak in the financial cycle. It is hard not to comment that these digital speculations are following the worn path of historical financial speculations. The current digital and crypto mania will end badly, like the Dutch Tulip Bulbs, France’s Mississippi Company stock, the British South Seas Company stock, the Roaring Twenties stock boom, the dot.com stock Bubble and the Credit Crisis. Financial asset value appreciation, as we’ve said many times in these pages before, creates more collateral value for lenders with money brimming in their tills. People making money on Toronto housing tend to use their “winnings” to buy more of what has done well and buy more houses. Lenders are only too happy to oblige their greed.
Drunk on Rising Financial Assets
Rising financial asset prices creates more paper wealth and investors become more besotted with their chosen investment. The same holds true for those investors currently making money in digital coins and NFTs. They literally cannot believe that the prices will ever fall. Financial success also engenders actual physiological changes to investors who are making easy money. They are driven to assume even more risk since they are literally drunk from the testosterone levels generated by their success, as Dr. John Coates found in his research. This increased risk-taking leads to further investment in what has already risen in price, leading to a dangerous feedback loop that will only be ended by crashing prices and liquidation of whatever has gone up the most. The self-sustaining crypto loop seems ripe for a fall to us, when normal money becomes dearer.
When “Cash is Trash” and money and credit flow freely, financial speculations run rampant. The real question is: When cash and credit become scarcer, will things change? We believe that things are already changing. As the charts above show, bond yields are rising as the market consensus and media narrative now seem to be shifting back to how quickly central banks will tighten monetary policy to deal with what seems now to be persistent and not “transitory” inflation.
Yield to Dividend Stocks
We do admit to being confused at the relative valuation of stocks and bonds. We believe that “risk” is having your money available when you need it. A bond locks in a yield well below current inflation and even below the Fed’s target of 2%. After more than 40 years of declining interest rates, capital gains from falling bond yields lured many into the bond market despite paltry yields. The future is not looking promising for a bond investor.
Absent a capital gain, the current yields offered in the bond market aren’t attractive with the risk of higher inflation hanging over the bond market. According to the monetarists, the necessary precondition for higher inflation is excess money, and we have that in spades. Higher inflation is already here with the year-over-year U.S. CPI at 7.0% for December. As we said earlier, the historical parallel to the start of the Oil Shock in 1973 makes one wonder if we will be waiting in vain for inflation to moderate as our fathers and mothers did in the 1970s.
There is some good news. There are still market wallflowers that are overlooked. It appears to us that the dividend yield on stocks is currently very attractive compared to bonds. The chart below shows the 10-year Treasury yield versus the dividend yield of the S&P 500 for the last 150 years.
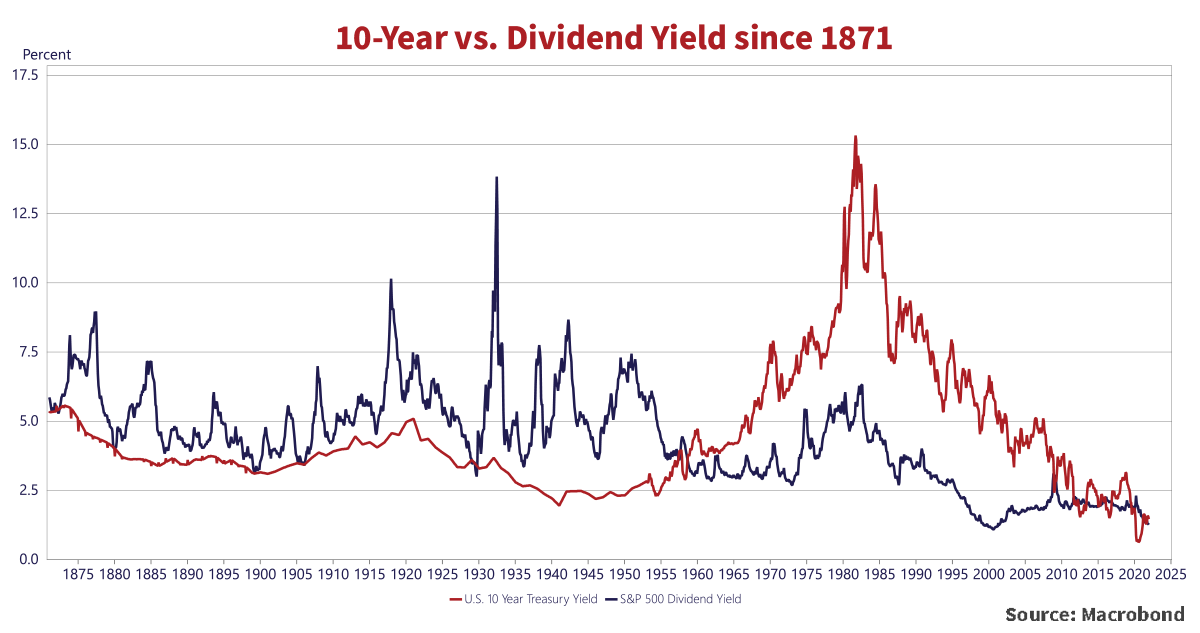
As the chart above shows, from 1871 to 1959, the dividend yield of the stocks in the S&P was above that of the 10-year Treasury note. This reflected investor perceptions that stock income was riskier than bond income, especially in the period after the Great Depression of the 1930s. Dividend yields have mostly been below bond yields since 1959, as investors sought the rising cash flows of stocks compared to the fixed cash flows of bonds. The “emergency” low bond yields during the serial QE programs since the Euro Debt Crisis gave dividend yields an advantage over bonds in 2012 and 2016. This was again the case during the COVID pandemic in 2020 when bond yields fell and dividend yields rose.
This has us wondering why investors don’t prefer the secure common dividend of an issuer at a higher yield than its bonds, as happened during the pandemic markets and still is now the case for many stocks. A bond or a stock issued by a solid and solvent issuer will have the cash flows available to pay both their bond interest and dividends. There are also dividend tax credits available that increase the attractiveness for taxable investors. It very well could be that high dividend common stocks become the “income asset class” for investors, if bond yields stay at or below dividend yields for some time.
Buying Back to the Future
Companies used to pay out their earnings in dividends, but they now also return cash to their shareholders by buying back their stock. We show this on the chart below, which compares the dividend yield of the S&P 500 to the dividend and buyback yield. We include this chart because it is an interesting statement on corporate bond issuers and their dividend and stock buy-back policies.
The red line is the Earnings Yield of the S&P, the net earnings of all issuers in the index divided by their cumulative stock prices. It’s what the market earns in yield terms. The blue line is the Dividend Yield, which shows the payout in total dividends divided by the cumulative stock prices. The grey line adds in the effects of stock buybacks by the issuers in the index.
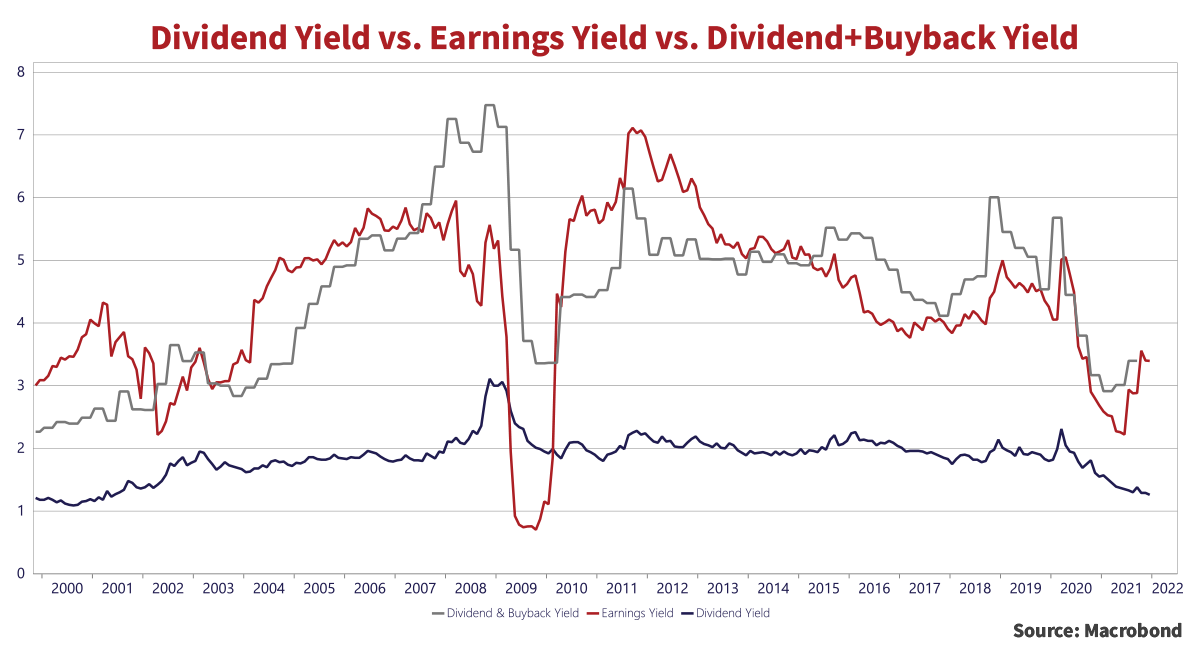
Clearly the Dividend Yield is much lower than the Earnings Yield, suggesting how much safety there is in dividends. On the other hand, the Dividend Yield and Stock Buyback line was generally less than the Earnings Yield until just before the Credit Crisis in 2007. The grey line above the red line suggests that companies were adding debt to buy back more shares than they could with their earnings alone. The Earnings Yield dropped below the Dividend Yield from 2009 to 2010, indicating that companies maintained their dividends using debt. Since 2015, issuers have increased their leverage and added debt to fund their share buybacks. That’s not good for bondholders!!
Passing Over Promotions
The bond market is now looking to the Fed to raise interest rates to make sure inflation is actually “transitory.” That’s the good news. The bad news is that the Fed has never successfully managed to raise rates and attain the chimeric “soft landing” that it so desires. This time will be no different. Rising yields will not be good for the price of financial assets, especially those with little backing them. A great idea with no operations and no viable business plan is a “promotion” and usually is a way for the promoter involved to make money from the unsuspecting.
Judging the popularity of meme stocks and digital coins is not what we do. We look at real issuers and the securities that have access to their cash flows. People are making large amounts of money in very popular and risky investments, at least on paper. Taking the last trade price and multiplying it by the outstanding amount of a digital currency like Dogecoin makes it “worth” billions. That sets the financial speculation machine at a fever pitch.
This engenders even worse risk-taking by those who have been “winning” in the current market manias. Our craft is the analysis of the actual and potential cashflows of our investments. We think that when money and credit grow scarcer, the veritable “stuff” will hit the fan as levered speculators try to sell out of their risky investments and get their hands on cold hard cash. As always, there won’t be enough to go around.
Most financial booms over history have been powered upwards by the vast potential of new technology, like the promise of today’s “Crypto” boom. Some technology stocks from the Roaring Twenties stock boom like Radio Corporation of America (RCA), which went from $1.50 to $549 at its peak in 1929 before the stock market crash, never regained their market highs. Today is not much different than the excitement of 1929 or the dot.com stock boom in 1999. Buying eToys.com or Pets.com in 2000 would have lost you almost all your money. Valuations on stocks were then also so high that it took a very long time to make your money back on even a great company like Microsoft, which was just entering its period of market dominance and strongly rising cash flows. An investor buying Microsoft on December 31st, 1999, would have waited almost 16 years until October 2016 to get back to the price she paid in the heady excitement of the dot.com markets.
Invaluable Will Become UnValuable
Some of the digital assets and associated companies that people are now piling into might stand the test of time, like RCA, and they still might be around 10 or 15 years from now. That is no guarantee that they will make any money or provide a decent return. This time around, much of the speculation has been in the digital coins, NFTs and other even more ridiculous things lacking cashflows like a stable of digital racehorse studs and land in digital Nirvana. We think many investors are going to learn the hard lesson that no matter what you think something is worth, when you are forced to sell, it is worth what a buyer wants to pay.
Things that the digital believers now “believe” to be invaluable will be actually unvaluable if there’s no greater fool around to buy them. Will someone be buying digital racehorse studs during the next financial market sell-off?? We doubt it, but it is testament to how much central banks have cheapened money that they are worth anything at all.