

It’s been quite a while since the end of the 3rd Quarter of 2022, and we’ve been watching the markets and waiting for things to settle down.
And settle down they did not.
That means that we’re glad that we waited to go to press. Things are very different now than they were just over 2 months ago. Anything we could have written for the first month and a half of the quarter would now seem hopelessly out of date.
Peaky Blinded
The chart below of long Canada and Treasury yields shows just how much things have changed. At September 30th, long Canadas yielded 3.1% and long Treasuries yielded 3.7%. It was strongly upwards in yields for almost 2 months as inflation fears grew until the 3rd week of October. Long Canadas and Treasuries peaked at 3.7% and 4.5%, respectively, up 0.6% for long Canadas and 0.7% for Treasuries.
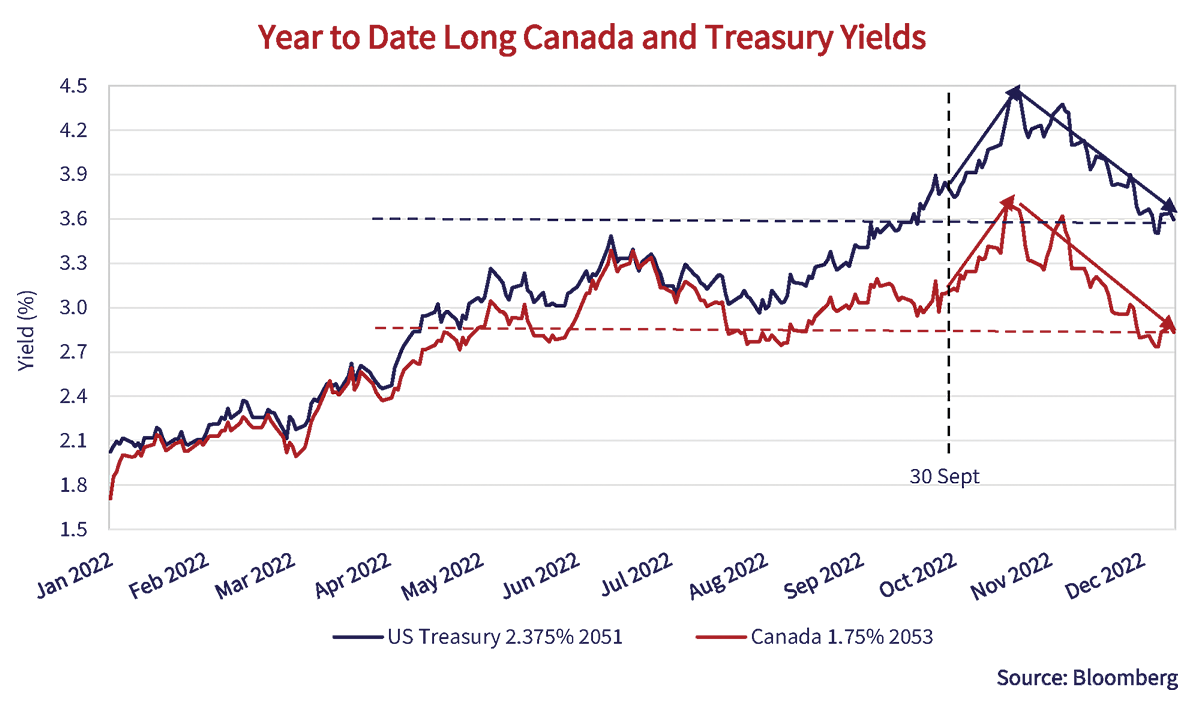
Once it seemed that the harsh medicine of tighter monetary policy and higher interest rates might be working to slow the economy and inflation, bond yield hopes sprung eternal.
Manic Mundane Rally
This manic bond market rally met little supply or selling. Anyone who needed out was already long gone. Bond prices soared and yields dropped precipitously. The current 2.8% yields for long Canadas and 3.6% for Treasuries are now net down more than they were up earlier in the quarter. That doesn’t seem huge, but long duration bonds move over 20% for each 1% change in yields. The price chart below shows just how wild a ride it has been.
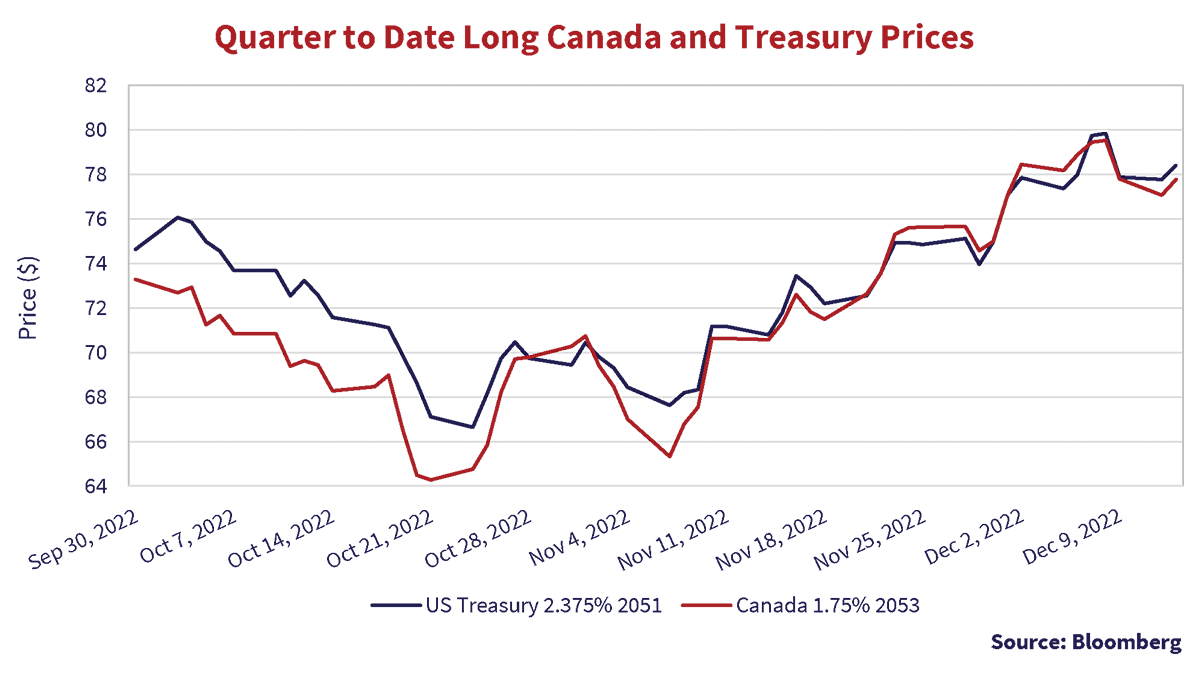
The long Canada bond started the 4th Quarter of 2022 at $73.27 on September 30th, 2022 and hit a low of $64.27 on October 21st, down 12.3%. It then soared to the current $77.77, up 21.0%, that puts its price up 6.1% for the quarter thus far. The long Treasury was $74.63 on September 30th and fell 10.7% to $66.63 before climbing 17.7% to the current $78.41, up 5.1% for the quarter to date.
Pain Without Gain
Clearly bond investors believe the Bank of Canada and the Federal Reserve have done enough to get inflation back under control at their 2% target. On the other hand, in a year where bond investors are suffering the worst rise in yields and drop in prices since the 1970s, it might be that the “Pain Without Potential Gain” was a worse fate for bond managers than taking their lumps and continuing to stick close to their bond index benchmarks. If a unitholder is down 15% in the mutual fund you manage and decides to sell out, that’s their problem. If you take the worst bond market performance in 40 years and then sell out of bonds and go to cash to lock in the loss as a portfolio manager, that’s your career gone.
So nobody was selling bonds and only buyers dominated the market. As we say to our staff, you might believe you’ve predicted things exactly right, but that’s just your opinion if Mr. Market disagrees with you. Sell offs like we’ve seen in the financial markets this year often end in powerful rallies, as those who positioned well cover their shorts or buy back into the market in question.
Professor Bid-Ask
Professor Bid-Ask was once again a harsh teacher. Sellers hit the bids on the way down, causing “gapping” down in prices. Despite all the tooth gnashing and concern about “liquidity” from market makers in the bond market, major selling pressure meets few buyers. Traders don’t ever hold things that are falling in value so, when the last sellers are panicked out of their positions, things can turn violently down in price on little volume.
Shopping and Lifting
Likewise, on the way up in price, a trader asked to offer a security without an underlying inventory position will build in a substantial premium to protect their exposure. When the market turns from people hitting bids, the bottom is found by offers being lifted on little selling. The “P&L” on their book is what traders’ bonuses depend on. That gaps prices upwards after the seemingly one-way elevator in prices down and traders and investors scramble to cover their shorts and “get invested”.
There is very little trading at a market top or bottom. An astute investor soon learns that they can never pick the top or bottom and accumulates before the top or bottom is reached. It’s easy to say but very hard to do in practice. That’s why closet indexing is so popular. No gain for clients, but little career pain for the portfolio manager.
Irrational Expectations??
So, what is the bond market expecting for inflation? That’s a very good question and the answer is actually quite simple to discover due to the development of inflation-linked bonds which we covered more extensively in our Market Position Report, W(h)ither Inflation and Bond Yields. If the bond market is “efficient”, then the spread, or difference, between nominal (conventional) bonds and inflation-linked bonds should approximate the market’s maximum inflation expectations or “Break Even Spread” (BES).
The BES Bet
The chart below shows the BES between the Canadian Real Return Bond (RRB) Index and the Long Canada Index.
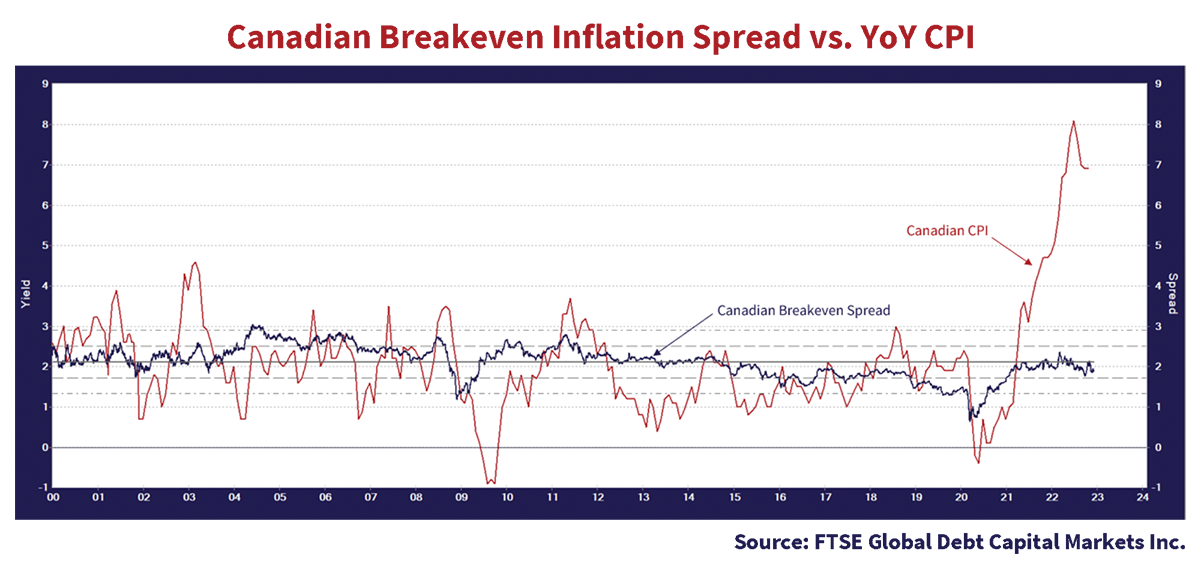
As you can tell from the chart above, the year-over-year CPI moves around quite a bit but has averaged just over 2% since 2000. The BES held pretty steady at this level until it fell with the actual CPI during the unprecedented monetary easing, beginning with the Euro Debt Crisis. It didn’t pick up with the actual CPI which moved higher after 2017. It plunged during the initial stages of the pandemic and then returned to just below 2% as inflation soared above 7%.
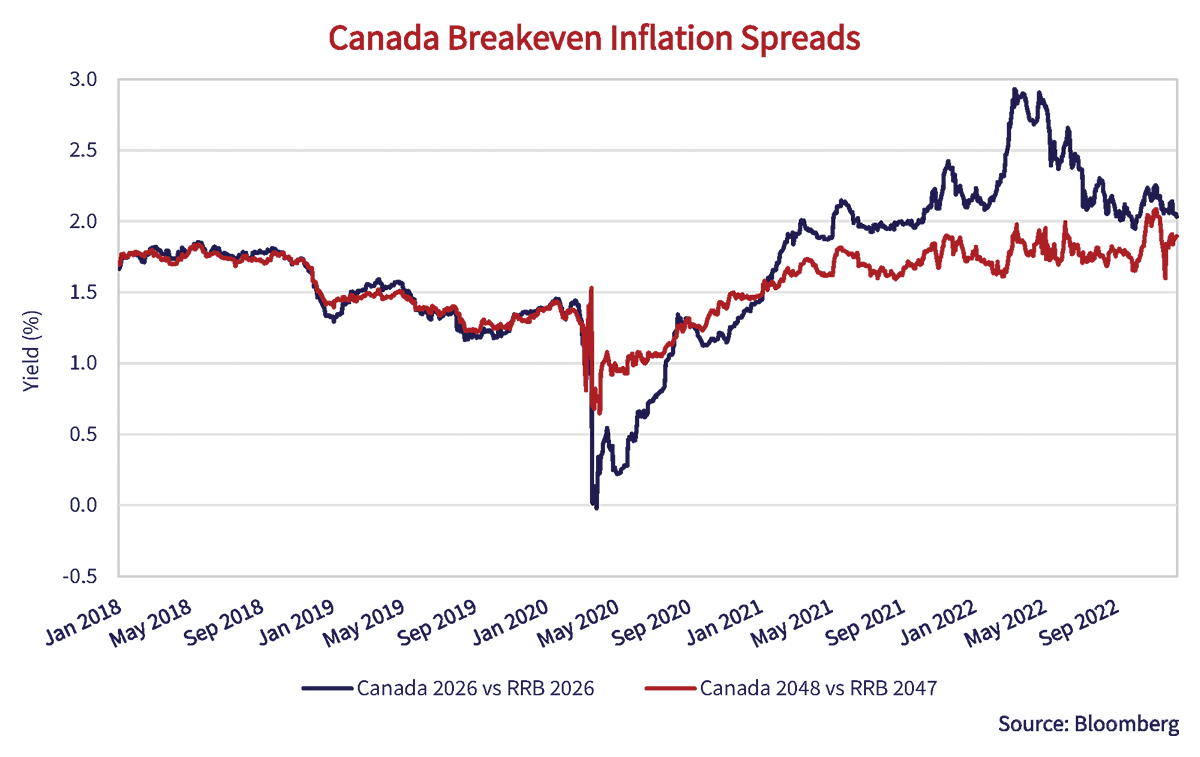
The current predicted inflation from the BES is 1.9% over 30 years, comparing long Canadas to long RRBs. The 2026 Canada to RRB pairing produces predicted inflation until 2026 of 2.0%. Note that the 2026 BES tracked the longer BES before the pandemic but has departed since the 2nd Quarter of 2020, falling below it in the early stages of the pandemic market and soaring far above to almost 3% during the inflation scare of June 2022, before converging recently.
Not an Ample Sample
So, the markets and the BES are currently predicting a maximum CPI inflation of 1.9 to 2.0%. The problem for the markets is that they have gotten far ahead of themselves in terms of long Canada yields. At the current long Canada yield of 2.8%, the long end of the Canadian bond market seems “priced for perfection” at only 0.9% above its BES predicted CPI. How does that compare to the historical record???
Not well!!
While 0.9% above inflation might seem ample, it is very low from a historical point of view. In fact, as inspection of the chart below shows, the “real yield” above inflation of the Canadian long bond has seldom been below 1%, except in periods of higher inflation like the 1970s. Inflation is not a fixed rate bondholder’s friend. During that period, bond investors waited a very long time for bond yields to fall. By the end, they were jadedly calling their bonds “Certificates of Confiscation”.
Getting Real on Yields
On average, the real yield (yield – CPI) since 1955 of a long Canada bond is 3%. To get there, CPI inflation would have to drop to almost zero at 0.2%, which doesn’t seem to be likely, short of a severe recession. It is not often in Canadian financial history that the long bond yield is less than inflation, or a negative real yield. It is also interesting to note that the current long bond real yield of -5% is the most negative since 1955, beating out even the very inflationary 1970s.
Bullish or Full of Bull?
So why are Canadian investors so bullish on long Canada bonds? They obviously believe inflation is headed back to the 2% target of the BOC, if the market and the BES are to be believed. It could be the fact that so many of them started their careers in the era of very aggressive monetary policy and loose money. Since 2010, the real yield on the long Canada (yield – CPI) has averaged 0.3% and it has averaged -0.3% since 2015!
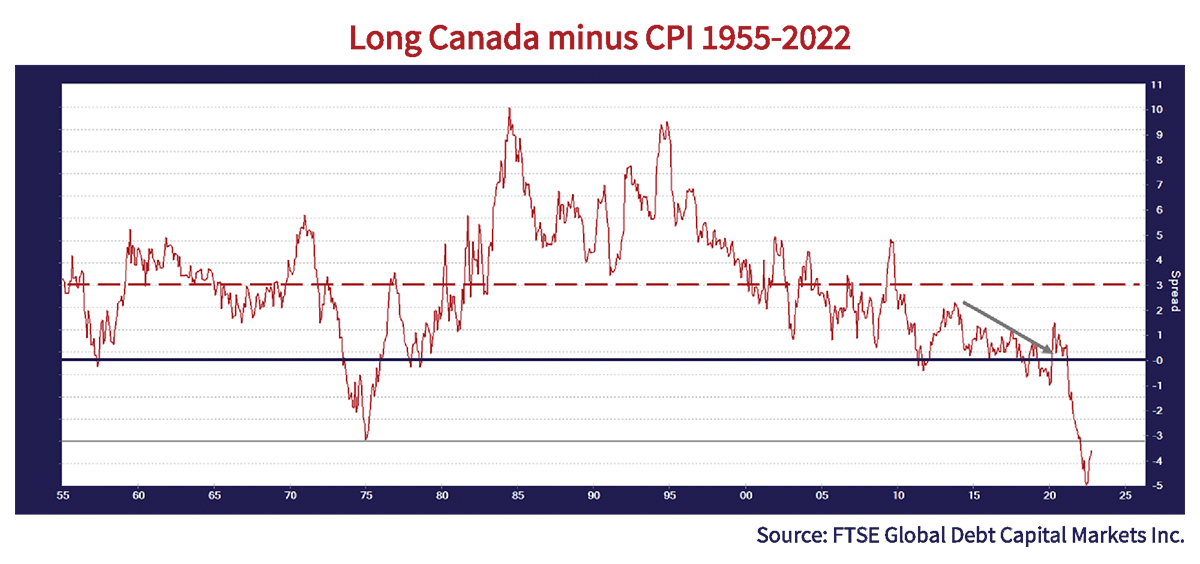
The grey arrow shows the trend down from 2015 to 2020, even before the pandemic, which is a result of the huge “Quantitative Easing” intervention of central banks into the bond markets in their haste to avoid any and all financial crises they could encounter. Did they do too much? That’s what we are about to find out.
We’ve Got History with Inflation
We published our extensive Canso Position Report on inflation in September, but we think it’s appropriate to look at the historical record once again, which we show below. The average year-over-year CPI since 1946 has been 3.75%, but it has averaged exactly the 2% Bank of Canada inflation target since 1991 when the BOC adopted its inflation targeting regime. That is, until just recently, as the chart below shows in detail.
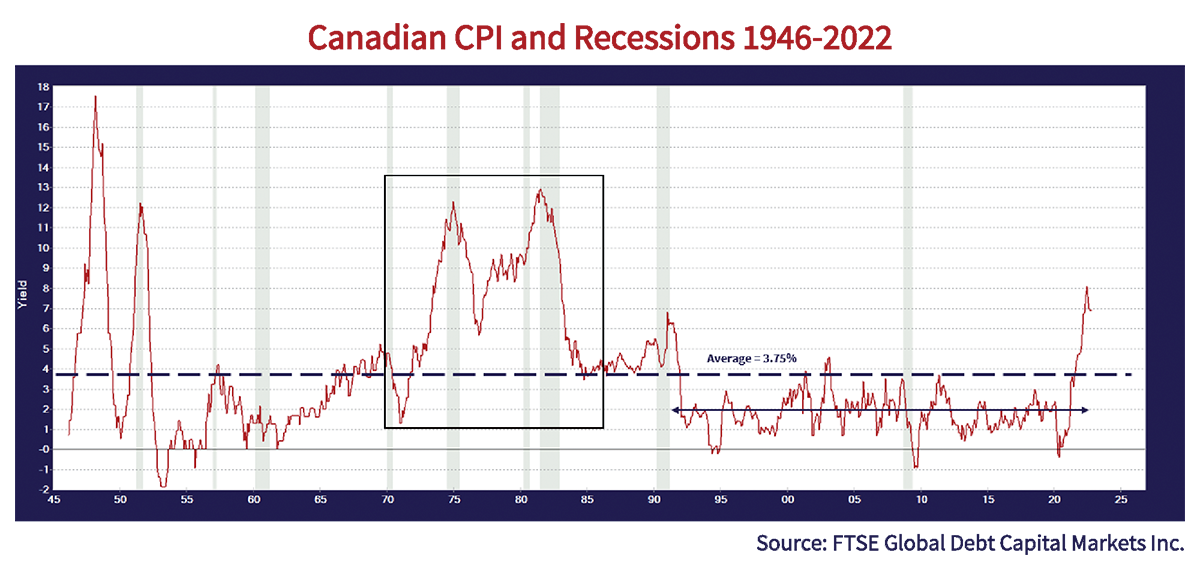
Yields Regressing in Recession
This chart very clearly shows that recessions, shown in grey, decrease inflation. For example, Canadian CPI was 12% in 1975 and fell to 6% after that recession. The problem for the Bank of Canada is shown in the black square. Inflation subsequently jumped from 6% to the peak of over 12% before the even more severe recession of 1980 lowered it to 4%. This is the period that central bankers now worry about. After declaring a premature victory in 1976 after the “temporary price shock” of the 1973 Oil Embargo, monetary authorities around the world lost control of inflation. That sounds a trifle ominous to us and central bankers, it seems.
The Core of the Inflation Issue
The question is whether we are in a “wage and price spiral”. The Canadian bond market clearly thinks we are not, despite the current CPI at 6.9%. At Canso, we are not so sure. That means it is worth a look at the data, which is a cause for concern in the chart of CPI below.
The overall and core CPI were running at or about 2% in early 2019, before the pandemic. We have also plotted average hourly wages, which moved up from 2% to 4% in the spring of 2019, perhaps presaging the acute labour shortages that we are now experiencing. The pandemic saw soaring wages in excess of 10% year-over-year. That stratospheric jump was soon reversed and fell, finally turning negative in the spring of 2021.
The year-over-year CPI fell to 0% in May 2020 but rose back to 2% by March 2021. It was then that the problem started. Despite confidently declaring the rising CPI was due to “temporary” pandemic price shocks, the BOC embarrassingly saw a steep climb in the CPI to the current 6.9%.
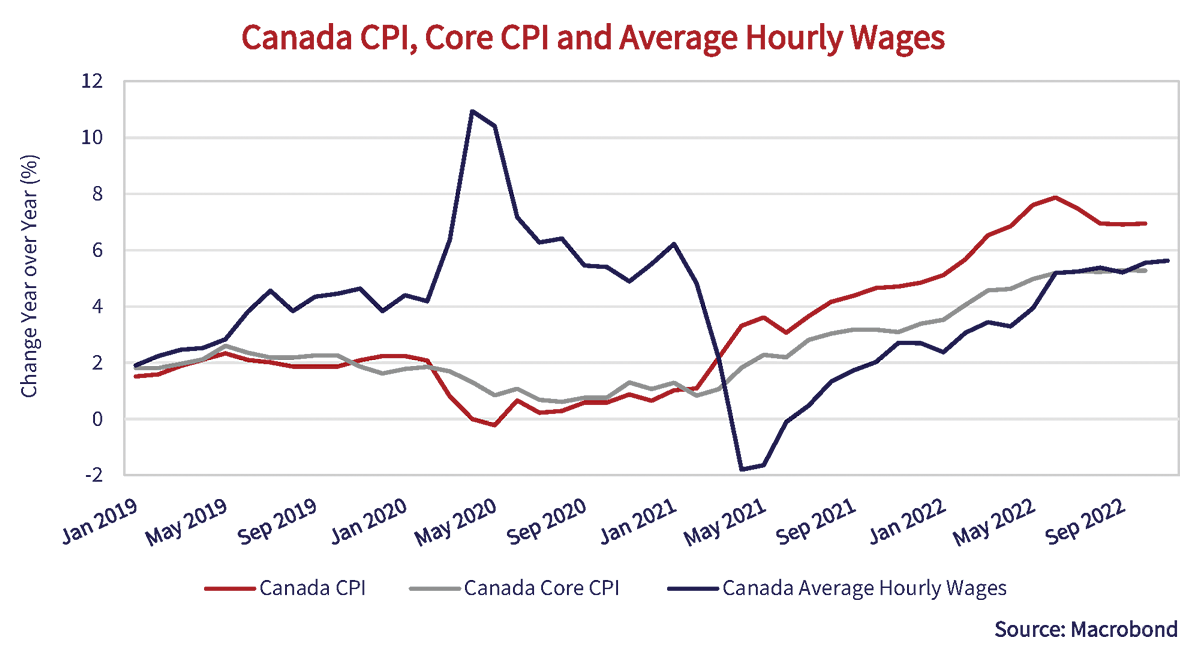
The Wages of Inflation Sin
What troubles us is the increase in the core CPI and wages, which have now climbed and settled at above 5%. That’s 3% above the BOC inflation target of 2%. Now wages and core CPI are stuck above 5%, with a slight easing of overall inflation, to the current 6.9%. That’s what worries the BOC.
The BOC knows things are slowing due to their interest rate increases, but ample money supply and continued strong demand meeting reduced labour supply is a recipe for strong wage increase. The wage expectation surveys in Canada and the United States support this with wage increase expectations in the 5% range as well. What of the doomsaying predictions that a recession is imminent, if not already here? We turn to corporate profits and credit spreads, which we find are powerful predictors of recession.
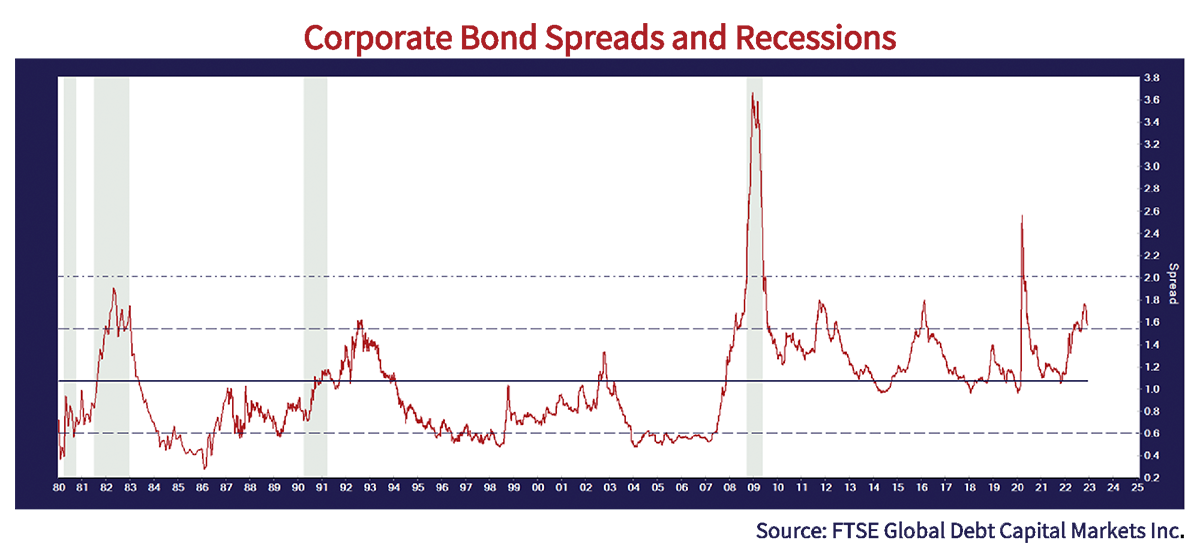
The chart above has the yield spread on corporate bonds at 1.6%, which has been seen during recessions. On the other hand, there have been 5 or 6 periods with corporate spreads at these levels without recession.
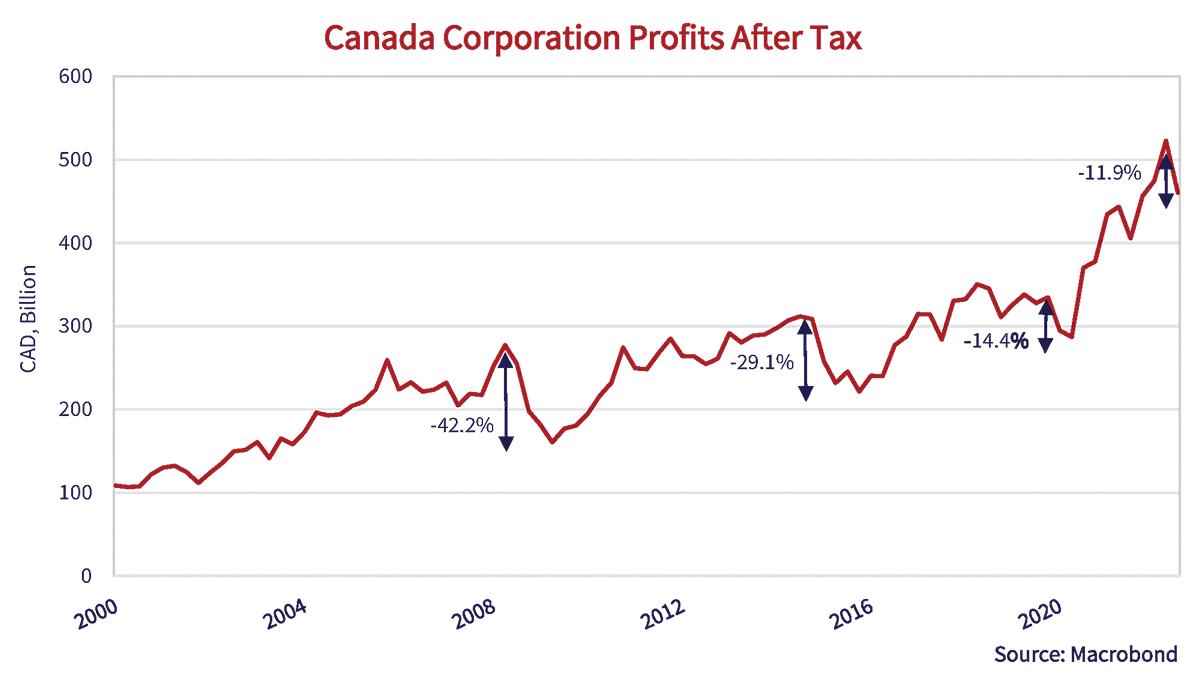
Corporate profits are mixed as well, as shown in the chart below. Companies producing strong profits can pay higher taxes. They can also afford to give their employees good compensation. The chart below shows that we’ve not yet experienced the type of fall in corporate profits associated with recessions. The severe recession after the Credit Crisis of 2008 and the weakness during the Euro Debt Crisis of 2015 saw drops of 30-40% in Canadian companies’ operating profits. Right now, we’re only seeing corporate profits down about 12%.
A Curve Ball
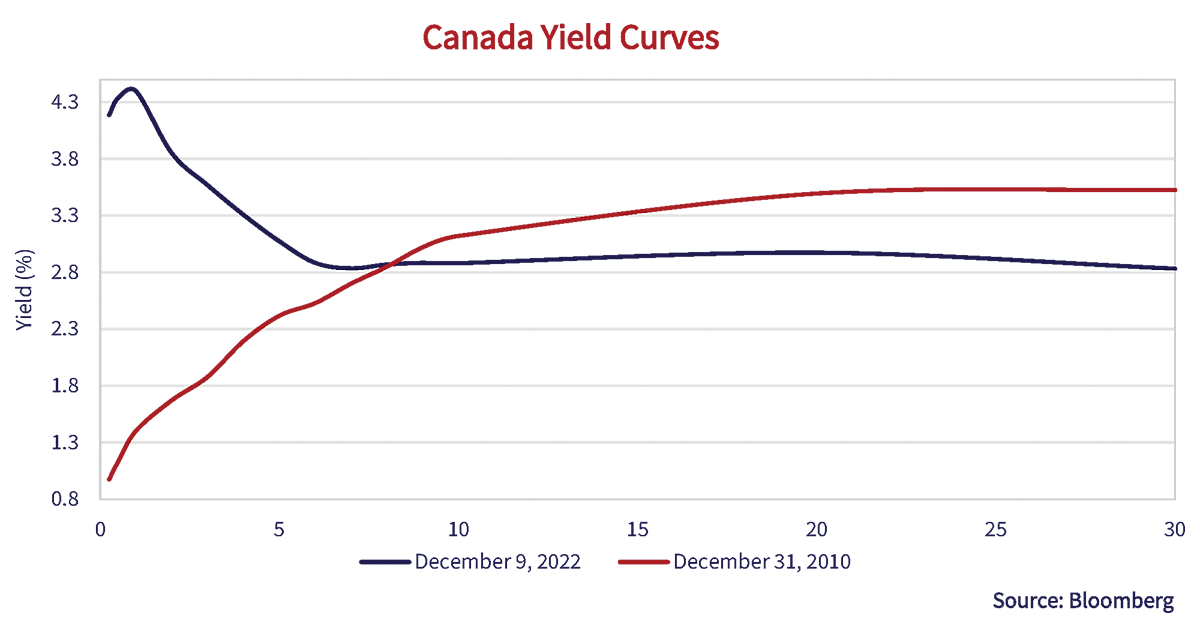
What’s a bond investor to do?? The Canadian yield curve chart below does indeed suggest that the longer end of the Canadian yield curve is overvalued. The current yield curve at December 9th, 2022 is shown in blue. It indeed is “inverted”, with short yields reflecting the BOC monetary tightening and long yields showing the investor hopes and dreams of the falling yields they have become so habituated to. They could receive a yield above 4% in 1-to-2-year maturity Canada bonds, but have chosen to give up 1% in yield and lock in just below 3% in longer maturity Canadas.
The New Abnormal Curve
For historical comparison, and the sheer joy of thinking differently than the consensus, we have also plotted the yield curve from December 31st, 2010. This was a period when the severe recession of after the Credit Crisis of 2008 had lowered inflation from 3.5% in August 2008 to -0.9% by July 2009. By December 2010, inflation was back to 2.4% and bond investors worried about the monetary ease of that period. Long Canada bond yields rose to 3.5%, 1.1% above the CPI of that time.
What this suggests to us is that bond investors, in their rush to not miss a rally, are exposed to the “normalization” of the yield curve. Investors should be looking to the shorter end of the Canadian yield curve for the best risk and return combination. It will take a very severe recession for inflation to drop substantially. The BOC is already moving to “Data Dependency” where it thinks it has done enough to slow the economy and inflation down and wants to wait and watch things.
Premature Declaration of Victory?
Hopefully inflation will fall, but it is not reasonable to think the BOC will reach its 2% target any time soon, looking at current core inflation and wage growth running near 5%. The BES shows that Canadian bond investors have already declared victory and impound 2% as inflation for the next 30 years!
To us, that seems a tad premature. The Canadian bond market’s faith in the Bank of Canada might have been misplaced when they believed its assurances that the higher inflation after the pandemic was “temporary”.
On the other hand, we might indeed be in a recession. The good news is that Canadian short-term interest rates and bond yields have moved from almost zero at the start of 2022 to above 4%. That means we are now reasonably paid to hold a shorter-term Canada bond. If we hold a 1-year Canada bond to maturity, we are now paid a handsome 4.3%. That compares to the paltry 0.76% on December 31st, 2021 and 0.16% on December 31st, 2020.
Our odds are on inflation staying higher than expected. With wages and core inflation running in the 5% area, we think inflation and rates could stay higher than 2% for quite a while. The disinflationary 1990s saw globalization disintermediate domestic production in favour of cheap Chinese exports. With “onshoring” and the growth of the service economy after the pandemic lockdowns, we think domestic labour has more bargaining power, especially given the retirement of Boomers from the workforce. That generation’s retirement has been accelerated by the pandemic. That means that wages could be sticky on the upside.
There’s No Stopping a Rallying Market
That’s all well and good, but when a market wants to rally, there’s no stopping it, even after the thrashing that bonds have taken in 2022. The U.S. bond market has just warmly received the November U.S. CPI numbers. The overall CPI was up 0.1% month-over-month on falling energy prices and the core rate had its smallest increase in quite a while at 0.2%. That annualizes to 1.2% for the overall CPI and 2.4% for the core CPI. The fly in the CPI soup was wages, which were up 1.2% for the quarter, which annualizes to 4.8%, and 5.1% year-over-year. This news seemed to offer the Fed an excuse to moderate their tightening program. Whether they will or won’t isn’t clear, but of course bond prices rose and bond yields fell.
All About the Monetary Base
What about everything else, you ask naively? Stocks, credit, profit estimates, M&A, Trump 2024, FTX/ Sam Bankman Fried, Elon Musk and Twitter?? Well, as the song goes, It’s All About that (monetary) Base, No Tightening. Nothing else really matters to the financial markets.
It’s all about monetary policy and central banking. If the central banks are truly serious about crushing inflation, they can do it, as the Fed did in 1981. On the other hand, as we know from the lateness of the central banks’ response to pandemic cost pressures and the non-temporary inflation we are now experiencing, central bankers might want to appear omnipotent, but they are only human.
That’s all we have for now.
We’ll leave you with a few punny questions for the holiday season.
Are you Fed up yet???
Looking forward to a taste of BOC Joy???
Happy Holidays and a Bond Happy New Year!!