

Visual Changes
You might have noticed the change to our Canso “Visual Capital”, as our experts on the subject call it, on our website and newsletter format. This is the fifth time in the 26-year history of Canso that we have updated our website and graphics. We still hold true to our Canso brand, oriented around our beloved namesake aircraft. Like the trusty Canso aircraft getting its crew and passengers through turbulence, storms, and even anti-aircraft fire, we are still believers in our understated approach. We get the job done in our not flashy but consistent manner. Like the Canso aircraft, that seemed obsolete many times in its service lifetime, we believe active management and fundamental research are the keys to investment success. Investment Fads like Passive, Alternatives and Crypto come and go, but our slow, steady, and disciplined ways combine with our very long-term focus to add substantial value to our client portfolios. Since all of our investment staff at Canso hold our financial assets within the Canso group, we’re obviously true believers.
Raging Debates, Moderating Inflation
We last left you in April with the comment: “The current debate rages around what is actually “tight” for monetary policy.” We really don’t have much new to report. That debate rages on and economic experts continue to postulate about when higher interest rates will finally bite and slow economic activity enough to lower inflation. The question is how high do interest rates need to go to slow inflation down. We can now report that actual inflation is dropping, which has been met with much market enthusiasm. This is despite the best efforts of central bankers to signal their continued resolve on fighting inflation.
Unlucky Central Bankers
To paraphrase Napoleon’s comment on his preference in Generals, it is better to be a lucky central banker than a smart one. The lucky central bankers before today’s got to heroically lower interest rates at every market and economic hiccup for 40 years. That was very popular with investors and consumers. It fell to today’s unlucky cast of central bankers to have to finally administer the tough love of tight money on a very obstreperous citizenry and their political masters. We’ve gone from costless capital to very costly capital in a very short period and that puts people in a foul mood.
Never-Never Inflation Land
The further question is, after the very long period of central bank Zero Interest Rate Policy (ZIRP) stupidity, whether and when will central banks actually lower interest rates? As we pointed out in our last Market Observer, Canadian bond investors have believed that inflation is actually at 2% for some time, despite the very ample evidence to the contrary. Their faith in their “2% inflation forever” forecast has not been shaken by the obvious fact that they have been very wrong. The absence of supportive facts seems to have made their longing for the happy days of very low interest rates even stronger. Like Wendy on her way to Never-Never Land, bond managers just have had to “Believe”!
Low Bond Yield Psychosis
We prefer to look at actual data to come to our conclusions about what represents value in the bond market. The experts have been predicting recession for a very long time, based on their observations of the dreaded “inverted yield curve”, where short term yields are much higher than long term yields. To us, the current low level of bond yields is the ultimate expression of bond managers’ “Back to the Future” mass psychosis. Rates would go down after the peak because they had always gone down, at least in most bond managers’ experience. We contrarily believed that there had been so much money created in the central bankers’ pandemic panic that it would take some time to sop up the excess money in the monetary system. So far, we have been right, but as they say about baseball, “It Ain’t Over ‘til It’s Over”. That makes us test our view against the evidence we gather.
With due deference to today’s unlucky central bankers, they did not expect all the money they created during the pandemic would actually cause inflation. Why would they, given recent monetary history? Central banks had printed money galore for years, with nary an inflationary consequence. Once the recalcitrant central bankers were grudgingly forced into action, they have been just as surprised by the lack of immediate response to their monetary tightening efforts as their believers in the bond market. Bank of Canada Governor Tiff Macklem gave voice to his surprise in an interview with the Globe and Mail after finally recognizing the pause in BOC tightening was premature:
“The Bank of Canada wasn’t supposed to be hiking interest rates this summer. Back in January, Governor Tiff Macklem and his team paused their monetary policy tightening, presuming that the barrage of rate hikes over the previous year would be enough to curb economic activity and bring inflation back under control.
That “conditional pause” lasted only two rate decisions. The bank restarted rate hikes in June and moved again this week, raising its key interest rate to 5 per cent, the highest level since April, 2001.
“It’s working,” Mr. Macklem said in an exclusive interview with The Globe and Mail on Wednesday, several hours after raising borrowing costs for the 10th time in a year and a half. “But it’s not working as quickly or as powerfully as we thought it would.”
The Bank of Canada, like many central banks around the world, is contending with a surprisingly resilient economy and stubborn inflation – two sides of the same coin. So far, consumers, employers and homebuyers are proving less sensitive to higher interest rates than previously imagined. That, in turn, means domestic inflationary pressures remain, even as headline consumer price index inflation has fallen rapidly, largely owing to the decline in global oil prices.” Source: Rendell, Mark. ‘It’s Not Working as Quickly or as Powerfully as We Thought’: Tiff Macklem Explains Why Boc Restarted Rate Hikes. The Globe and Mail, 14 July 2023.
Why would this time be different? One might expect that central bankers would be more resolute or have more knowledge and expertise than residential homeowners, but alas, they and homeowners were lulled into a mental stupor by the long period of low interest rates, brought to almost zero and kept there from 2011 to 2021.
Mortgaging the Future
We bring up the subject of mortgage rates since we have had more inquiries about where Canadian mortgage rates are going than any other question of late. To answer these questions, we prepared the histogram of 5-year Canada bond yields shown below. It divides monthly 5-year Canada yields since 1991 when 2% inflation targeting was adopted by the BOC into 1% observation brackets. For example, yields were between 3-4% for 55 months in the period. The clear winner is 1-2% yields for 79 months.
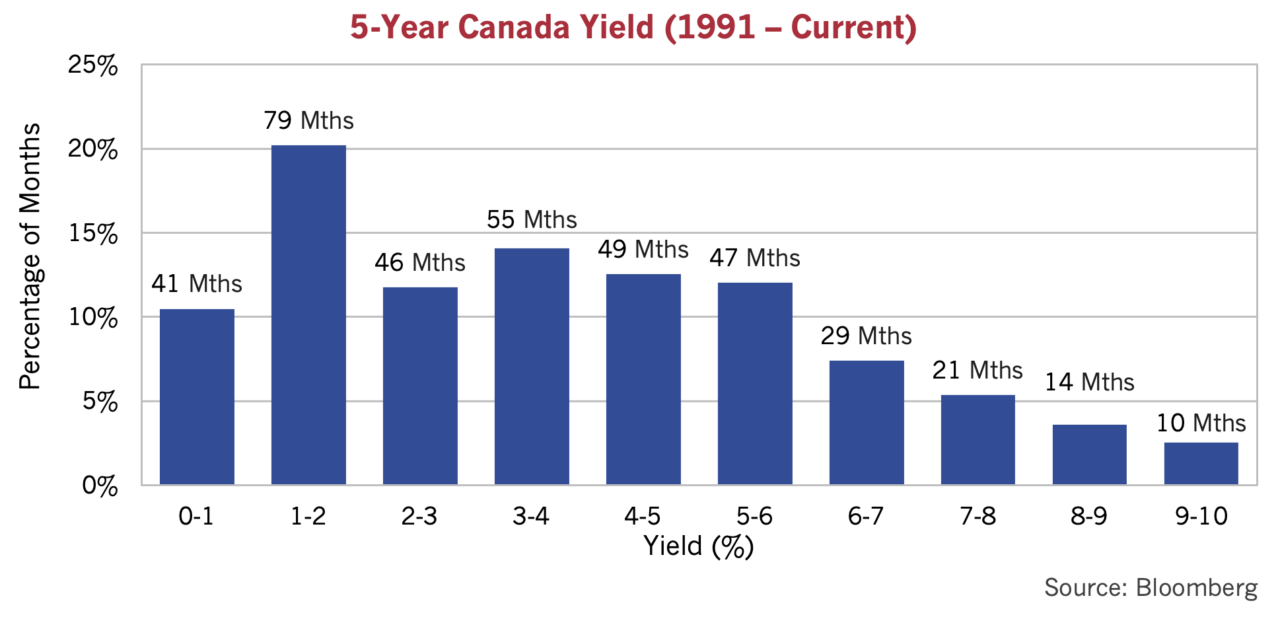
That’s why everyone is shocked at the current mortgage rates. Mortgage rates are typically 1-2% higher than 5-year Canada bond yields. Banks issue mortgages at the lower end of that range when they are competing for mortgages and the opposite is true when the mortgage market is less competitive. For example, the current 5-year Canada bond yield is 3.8% while the best Canadian major bank mortgage rate is 5.2%. That is 1.4% above a 5-year Canada bond yield, midway between the 1-2% extra lending spread banks normally charge on their mortgage loans.
Looking at the chart above, it is no wonder that Canadian homeowners and their mortgage brokers thought that “normal” for mortgage rates was much lower than the current rates over 5%. Those of us old enough remember when a 5% mortgage rate was a dream come true. After the 1.8% low mortgage rate of the pandemic, one can’t blame people for expecting an imminent fall from “unsustainably” high interest rate levels.
Thinking Slow
The human brain, as psychological studies show, falls prey to the phenomenon of “recency”, where more recent experiences dominate those farther in the past. We believe central bankers and homeowners suffer from this syndrome. Interest rates were low, so they’re going to stay low, processes the unthinking and very illogical human brain. We direct our readers to the wonderful book “Thinking, Fast and Slow” for more on how the human mind operates. It is anything but “logical”. But what if the recent past in interest rates was the exception, not the rule?
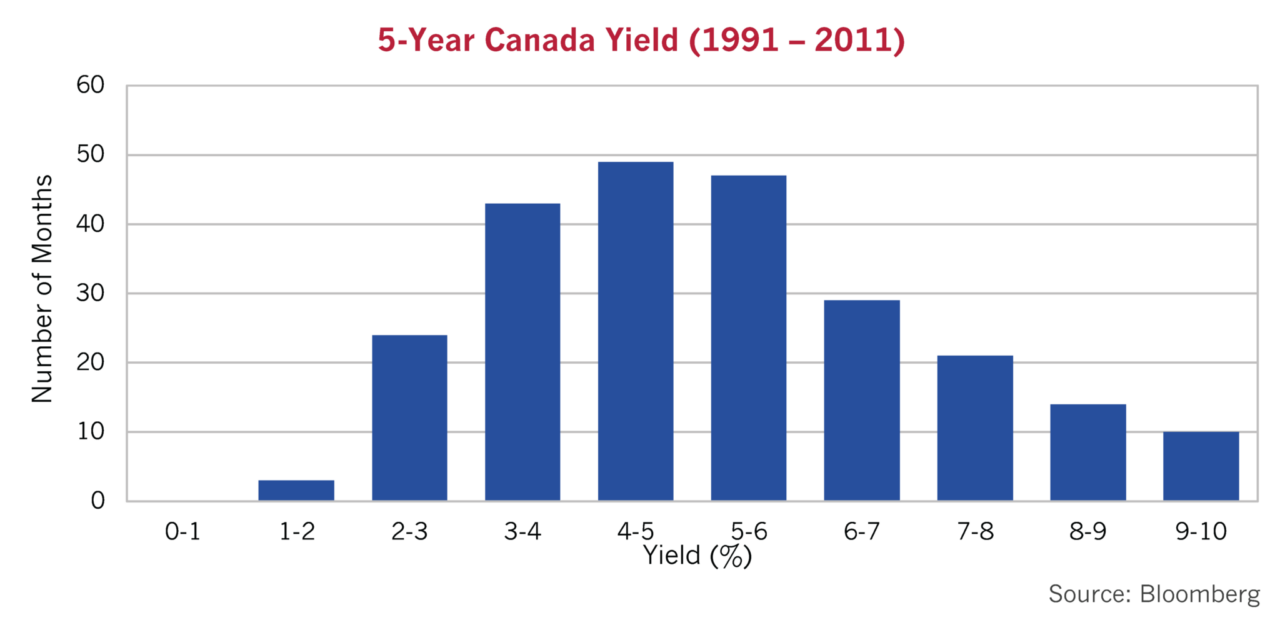
We’ve separated out the periods in the histograms below. The first chart is the 20 years from 1991 to 2011, and it seems “normally distributed”. Looking at this chart, yields from 4% to 6% are the “normal” ones clustered around the mean, following what one would expect from a random normal statistical distribution. We note that inflation has averaged 2% from 1991 to 2019, so given that inflation is far above that at present, and that the Bank of Canada wants to get to its target of 2%, the present 5-year Canada yield of 3.8% cannot really be considered abnormal in the context of this period.
Frequently Low Yields
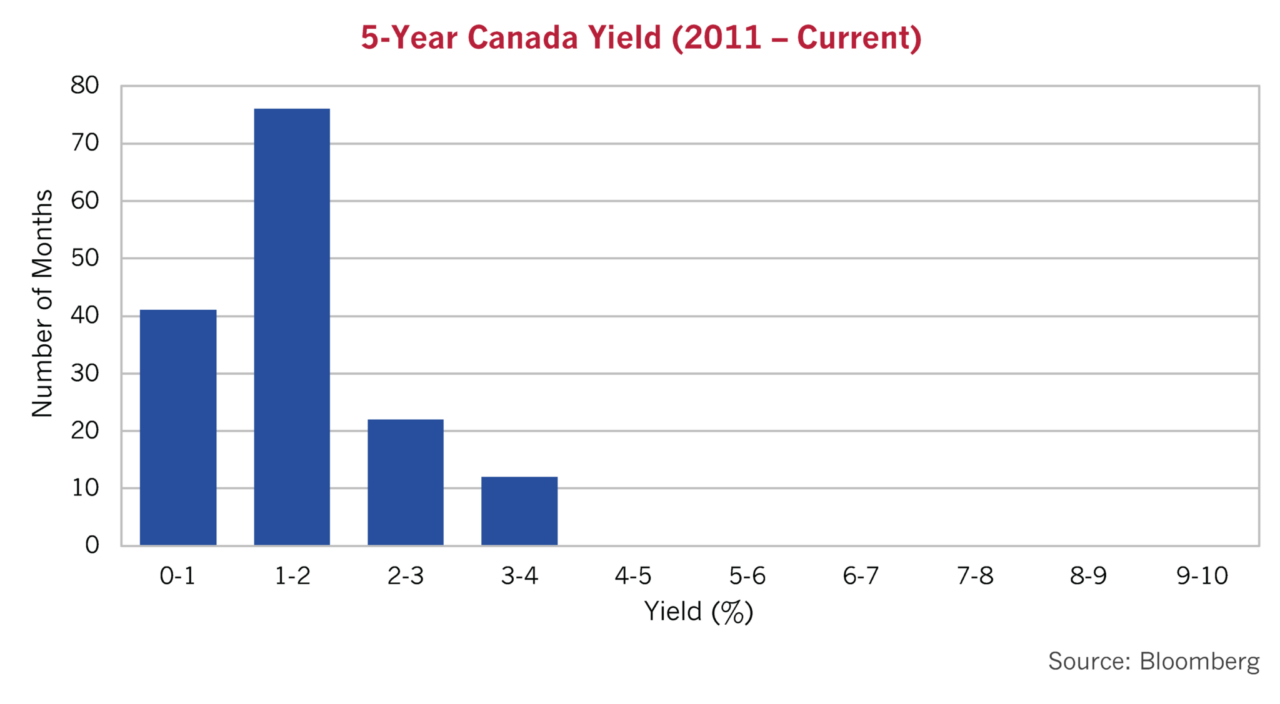
On the other hand, if we look at the period from 2011 to present, it is anything but normal. While 4-5% Canada yields were the most frequent in the 1991-2011 period, 1-2% was the most frequent monthly yield from 2011 to the present. There were no months at the 4% to 5% range over the entire 12-year period!
So, what does that mean for future interest rates. The consensus is expecting an imminent return to 2% inflation, since that is what the average investor is used to and wants. Besides, that’s the stated goal of central bankers. They “control” interest rates, so could they be wrong??
Making the Inflation Targeting Sausage
As we’ve told you in past editions, New Zealand was the first country to introduce “inflation targeting” in the early 1990s. It worked and the Kiwis saw their inflation rate plunge. Inflation targeting became popular with the cool economics crowd and Canada became the next country to adopt this novel monetary regime. As Tony Keller said in an Opinion Piece in the Globe and Mail, there was nothing magical or glorious about how 2% became the Bank of Canada’s holy inflation grail, it came out of the Ottawa political sausage factory:
“The 2-per-cent inflation target was not carried down from Mount Sinai, graven onto stone tablets by the finger of God. It came down from Ottawa, after negotiations, in the form of a joint statement from the Bank of Canada and the Department of Finance, printed on recycled paper.
Canada was the second country – New Zealand was first – to adopt inflation targeting as the core of its central bank’s mission, after governor John Crow and minister of finance Michael Wilson agreed in 1991 that the bank would have an explicit target for “reducing inflation and reaching price stability in Canada.”” Source: Keller, Tony. Opinion: The Bank of Canada Is Right to Shoot for Low Inflation. but Is 2 per Cent Too Low? The Globe and Mail, 13 July, 2023.
Inflation Down and Under
John Carswell, our CIO, visited the Reserve Bank of New Zealand in 1991 during his credit review for a Fletcher Challenge bond financing. He took the opportunity to discuss inflation targeting with the Deputy Governor of the RBNZ. When he got back to Canada, he told his then investment colleagues that inflation was going to go down and stay down. They didn’t believe him. As evidenced by the Break Even Spread (BES) between RRBs and their nominal Canada equivalent, they were not alone. It took until 1998 for the bond market’s lofty inflation expectations to drop to 2%. This led to extraordinary real returns on long nominal Canadas as real interest rates were locked in at very high levels.
A Moving Price Stability Target
Is 2% a good target?? (Hint: higher is better than lower for borrowers!!) The initial goal of the Bank of Canada was “price stability” i.e., 0% inflation, but it morphed to 2%.
“The inflation target was set at 3 per cent by the end of 1992, then 2.5 per cent by mid-1994 and 2 per cent by the end of 1995. “Thereafter,” said the joint statement from the government and the bank, “the objective would be further reductions in inflation until price stability is achieved.”” Source: Keller, Tony. Opinion: The Bank of Canada Is Right to Shoot for Low Inflation. but Is 2 per Cent Too Low? The Globe and Mail, 13 July, 2023.
It’s pretty clear this statement contemplated further reductions below 2%. The original goal under John Crow was “price stability” or 0% inflation. The idea was that inflation uncertainty was a cost to consumers and complete price stability would reduce costs as everyone would know what prices would be. Unfortunately, it turned out that in a debt-based economy, a “Spoonful of inflation sugar helps the debt medicine go down” for borrowers which included the Federal government itself. There was little controversy when the 0% price stability target faded into oblivion and the BOC stopped at 2%, which is now accepted as “price stability”.
A HIT Squad?
Now, as the Globe Opinion piece argues, the debate of what the inflation target should be is being broached, as we thought it might be. Is 4% a better target than 2%?? This debate should prove interesting. We have always said that more money is much more popular than less money. Now it seems the intellectual framework for expansive monetary policy could be shifting from Modern Monetary Theory (MMT), that postulated that there would never be any inflation despite huge increases in money supply, to Higher Inflation Theory (HIT). The HIT squad will probably suggest that a steady 4% inflation rate is better for society than 2%. On the other hand, a 4% inflation target wouldn’t be very popular with Canadian bond investors who are now rushing to lock in 3.3% yields for 30 years. They would be the ones taking the HIT on their government bonds.
Absolutely Not Certain
In the short term, what are we to think about the prospects for inflation? Well, all we can say is that we are absolutely certain that nobody has any idea of next year’s inflation, especially central bankers. They are likely to do what they always do, overcorrect and under correct as the pressure to look intelligent and do something becomes overwhelming.
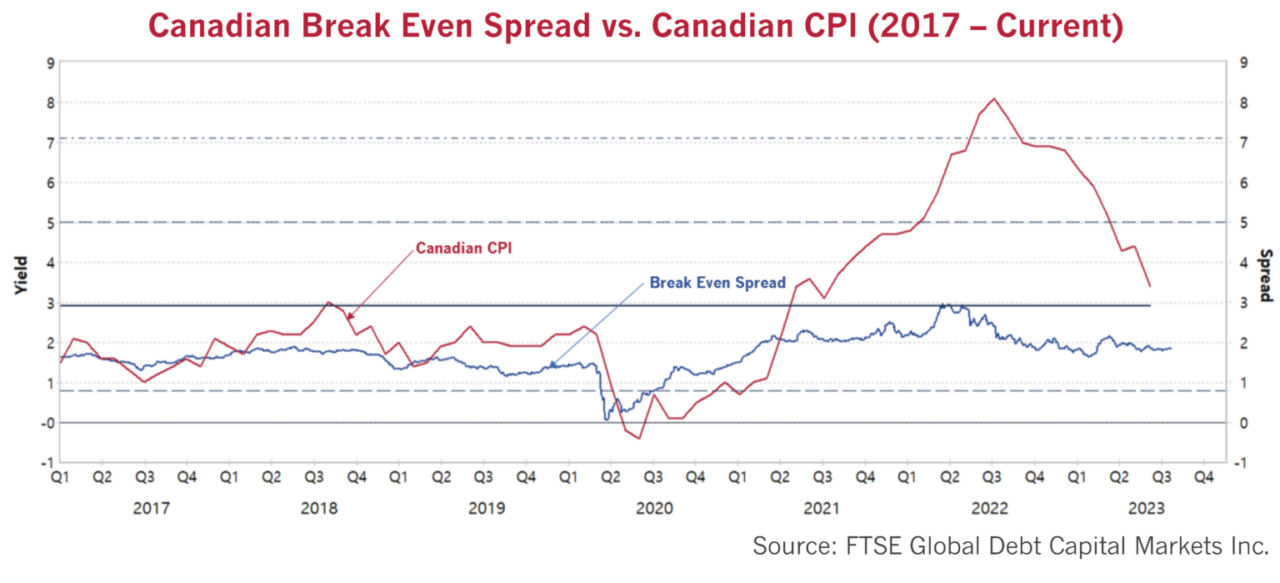
The bond market is not much better. We direct your attention to the chart below of the Canadian BES which shows the difference between the Canada RRB 4.25%/ 2021 and the Canada 9.75%/ 2021 from 1991 to 2001. If the bond market is efficient, this should approximate experienced inflation. The chart shows it did not, courtesy of the recency bias of the bond managers of that period.
The BES, the blue line stayed well above the red line, the actual CPI, from 1992 to 1999. The bond market believed inflation would be 3-5% from 1992 to 1997, when it actually averaged 1.5%.
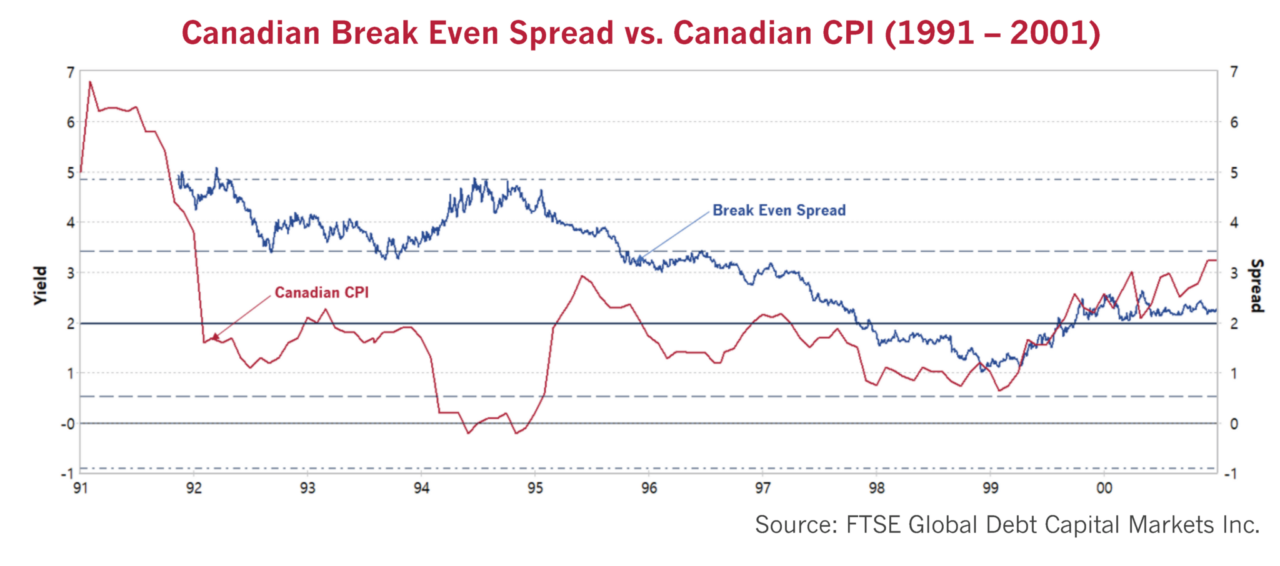
It took quite a long period for bond managers and the bond market to believe that inflation would average the 2% target of the BOC. Once they did, their inflation forecast coincided with 2% and still does to this day. (Interested readers are directed to our April 2023 Market Observer and our September 2022 Canso Position Report (Px) – W(h)ither Inflation and Bond Yields for a more fulsome discussion of historical inflation and BES inflation forecasts.)
Populist Bond Managers
On the chart below, the blue BES line and the red actual CPI line were quite close from 2017 to 2021 but then departed dramatically. Actual CPI inflation soared to 8.5% while the predicted BES inflation peaked at just above 3%. We’ve used the 2026 RRB, currently with only 3 years until maturity, as one would think shorter term bonds would more properly reflect immediate inflation expectations. What should we make of this? As we’ve said, recency meant psychologically that bond managers expected inflation to very quickly move down as interest rates rose.
We call that the “Command and Control” theory of interest rates. Like populist voters around the world, bond managers want their Strongman central bank to run things the way they personally want them. The thought that the Fearless Leaders at the central banks don’t actually “control” interest rates cause their bond market followers immense psychographic pain. Rather than struggle with the thought that somebody somewhere wasn’t controlling bond yields and the financial markets, they defaulted to blind obedience to central bank forecasts.
Ingrained Inflation Toe Nailed
This is not a new phenomenon; it is pretty much what happened during the last inflationary period in the 1970s. Economists at that time predicted falling inflation from rising interest rates and slowing economies, but failed to see how ingrained inflation had become. Like now, there was great belief in the ability of central banks to “command and control” inflation through monetary policy. “Keynesian” became a dirty word for strict monetarists who asserted it was only money supply that mattered, summed up by Milton Friedman as “Only Money Matters”.
As we’ve pointed out many times on these pages, the recent monetary policy fashion of MMT was literally insane from a monetarist and even Keynesian point of view. It really was the exact opposite of the lessons of the 1970s, resolving that “Money Doesn’t Matter”. It seems the world central banks fell prey to this flimsy veneer for rampant money supply expansion under all circumstances.
Born Again Monetarist Moment
The problem now is that the central bankers, after seeing inflation soar to what they considered unimaginable levels with their MMT dalliances, have now experienced a born-again monetarist moment. That makes things very hard to forecast going forward, as central banks attempt to manage inflation down. The central bankers know they blew it with letting money supply expand too much and for too long. That makes it more likely that they will do the opposite in their fervour to contain inflation, they will keep policy too tight for too long.
Now that inflation is dropping, experts are lining up to once again give the last rites to high inflation. The problem is that the experience of the 1970s demonstrates that once inflation becomes ingrained in prices and wage settlements, things get interesting. It takes a lot of monetary tightening to overcome that. This time around, there is a substantial overhang of money supply created during the pandemic that needs to be sopped up. Of course, the experts who didn’t see a problem with all that money creation at that time are now lining up to say that central banks have done enough with their rate increases.
A Graphic Inflation Tail??
The Federal Reserve and other central banks know that their predecessors in the 1970s loosened monetary policy too early because inflation had fallen substantially, only to see it soar later. Fed research papers have recently pointed those lessons out to the new generation of central bankers. As always, we turn to some hard evidence to back up our seemingly wild claims.
The graph below shows U.S. year-over-year CPI for the two periods of the highly inflationary 1970s and our current bout of high inflation. The dark blue line starts in 1971 and the light blue line starts in 2019. The U.S. CPI dropped from 5% in 1971 at the end of the war in Vietnam to 3% in 1972, just before the Arab Oil Embargo in 1973. It soared to 12% in 1975 and then dropped to 5% in 1977, a year of wage and price controls. The Fed loosened monetary policy due to falling inflation and then saw it soar to 15% before Paul Volcker got a handle on it with his very tough love rate hikes that well and truly stopped the inflationary spiral.
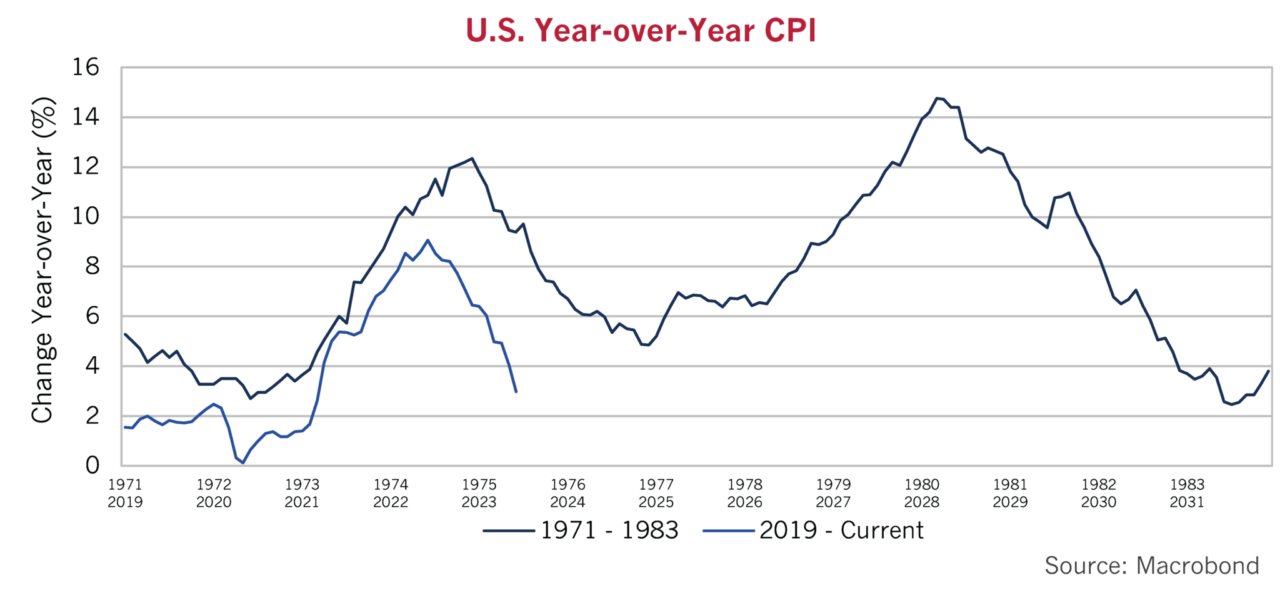
Prescient CPI Parallels
The chart looks more than a little prescient to us as both periods show the same 9% increase. The CPI jumped 9% from the 3% bottom in 1972 to the first peak of 12% in 1975. The light blue line shows that CPI jumped from the low of 0% in 2020 to the high of 9% in 2022. The graph also shows a very similar drop so far in CPI inflation after the peak. The joy over the rapid drop in inflation in 1975 was celebrated by the investors and economists of the period, much as the current drop is being celebrated.
The 1975 Fed joined in the celebration by loosening monetary policy, and this created a much larger problem later on. U.S. CPI has now dropped from the 9% peak to the current 3%, but is the 6% drop enough for the 2023 Fed to declare victory and loosen things up? We’re sure that even the 1975 Fed thought so when inflation approached 6%, but its victory was short lived as inflation began another upwards march. Today’s 2023 Fed seems to be listening to its research, recognizing the risk of easing too soon. The impatient financial markets are taking every sign of lower inflation as a declared victory. We are not so sure that U.S. inflation is well and truly gone.
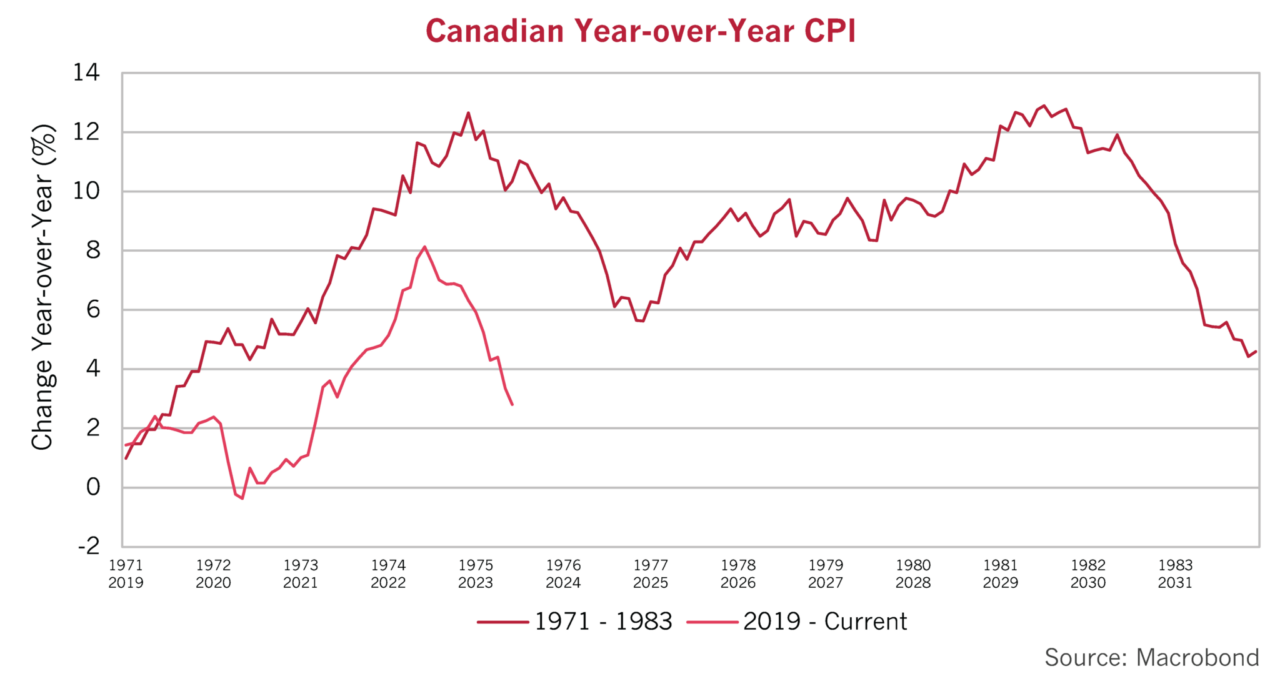
Canadian CPI Drop Kicks
The Canadian chart for the same period shows an increase from 5% in 1972 to 12% in 1975, an increase of 7%. The current period increase since the low in 2020 of 0% to the peak of 8% in 2022 is a higher 8%. The Canadian CPI dropped 7% from its 12.6% peak to 5.6% during that first burst of inflation. The 1975 BOC, like the 1975 Fed, prematurely declared victory and loosened monetary policy as well. That turned out just as badly as in the U.S. with Canadian inflation peaking in 1981 at 13%. Canadian CPI has now fallen 5.3% from its peak and the clamour for easing monetary policy is once again rising.
So, will the current period end the same way as the 1970s?? It really depends on when the 2023 Fed and the 2023 BOC relent. Just like the 1970s, the pressure is on central banks to stop the economic pain of high interest rates. Many so-called “strategists” have been predicting imminent recession for at least a year because of the grievous financial damage already inflicted by the huge jump in interest rates.
Not Zapping It Altogether
The problem is that the economic damage of high interest rates is not even. Interest rates are the price of capital and economic agents used to zero cost capital are obviously not happy. That does not mean that money or credit are scarce, or that we are in the final innings of tightening. It’s hard to believe that money is scarce in Canada when Canadian house buyers are once again in bidding wars. Even the U.S. housing market is looking up, according to the Washington Post:
“The housing market is looking up for Donnie Evans. The Dallas-area builder can finish houses six weeks faster than he could during the pandemic, thanks to mended supply chains for materials from tiles to garage doors. There’s plenty of buyer demand for his homes, which range in price from about $250,000 to $850,000, even as the 30-year fixed mortgage rate hovers near 7 percent, more than twice what it was just 18 months ago.
“We’re not in a recession,” Evans said. “We’re in a slowdown, somewhat. But I don’t think a recession would be the correct word for it at all.”
That’s the growing message from home builders, real estate agents and economists who say last year’s housing market recession — which many feared would linger as the Federal Reserve fought to raise interest rates and crush inflation — has already turned around. Supply chains are easing up, boosting builder confidence and helping construction crews finish homes more quickly. High mortgage rates are cooling demand but not zapping it altogether. Now that the frenzied bidding wars of the pandemic are over, there are more homes available at any given time, which gives buyers some options. And after dropping in the latter half of 2022, prices are slowly stabilizing, in another shift away from the pandemic’s warped markets.” Source: Siegel, Rachel. “The Housing Market Recession Is Already Ending.” The Washington Post, 17 July, 2023.
Pain and Gain
Yes, mortgage rates are above 7% in the U.S., but those homeowners with fixed rate mortgages, especially with 25-year terms in the U.S., are not suffering the same as their floating rate neighbours. As we said in our April Market Observer, savers are finally now making money on their interest-bearing accounts, so they’re happy as well. A 5-year GIC in Canada has gone from near zero in 2020 to currently just above 5%. For someone with $1 million in the bank, that’s $50,000 per year. Our American neighbours still have money in the bank and are spending it:
“Despite a year when inflation pushed prices to new heights, Americans are still better off now than before the pandemic, with nearly 10 to 15 percent more in their bank accounts than in 2019, new checking and savings account data shows.
However, households are rapidly spending down that extra cash they’d socked away during the pandemic. Median account balances are at their lowest levels in roughly three years and have dropped as much as 41 percent from their peak in April 2021, when Americans were flush with government stimulus money and tax returns, according to a JPMorgan Chase Institute analysis of the bank accounts of 9 million Chase customers.
Taken together, the data helps explain the big mystery behind how the U.S. economy has managed to avoid a recession that many economists had forecast: Consumers, supported by a strong labor market, have been able to keep spending despite inflation and a sharp rise in borrowing costs.” Source: Bhattarai, Abha. “Americans Are Still Better off, with More in the Bank than before the Pandemic.” The Washington Post, 17 July, 2023.
How much money has to be removed for things to slow down? Probably more than expected, given the massive monetary stimulus during the pandemic. As we’ve said in our other newsletters, it’s also hard to believe that things are tough when the stock markets and high yield bond markets are producing strong returns. We continue to think that the end game for monetary policy will be for more resolve and therefore more tightening than the experts and markets expect.
The Core Problem
How much?? That all depends on the former Super Star central bankers, now revealed to be frail humans, who wield the levers of monetary policy. The good news is that it’s early innings compared to the 1970s. The bad news is that 2023’s central bankers do not want to go down in infamy as the monetary fools who stopped tightening too early and caused an even bigger inflation problem.
The chart below of Canadian CPI shows the problem for central bankers. We have plotted the Overall CPI and the Core CPI below. Core CPI excludes volatile Food and Energy, reflecting the thinking that it better reflects underlying inflationary pressures. The financial market and economic consensus seem to be focused on the latest June monthly report that shows 0.1% monthly Overall and 0.1% monthly Core CPI.
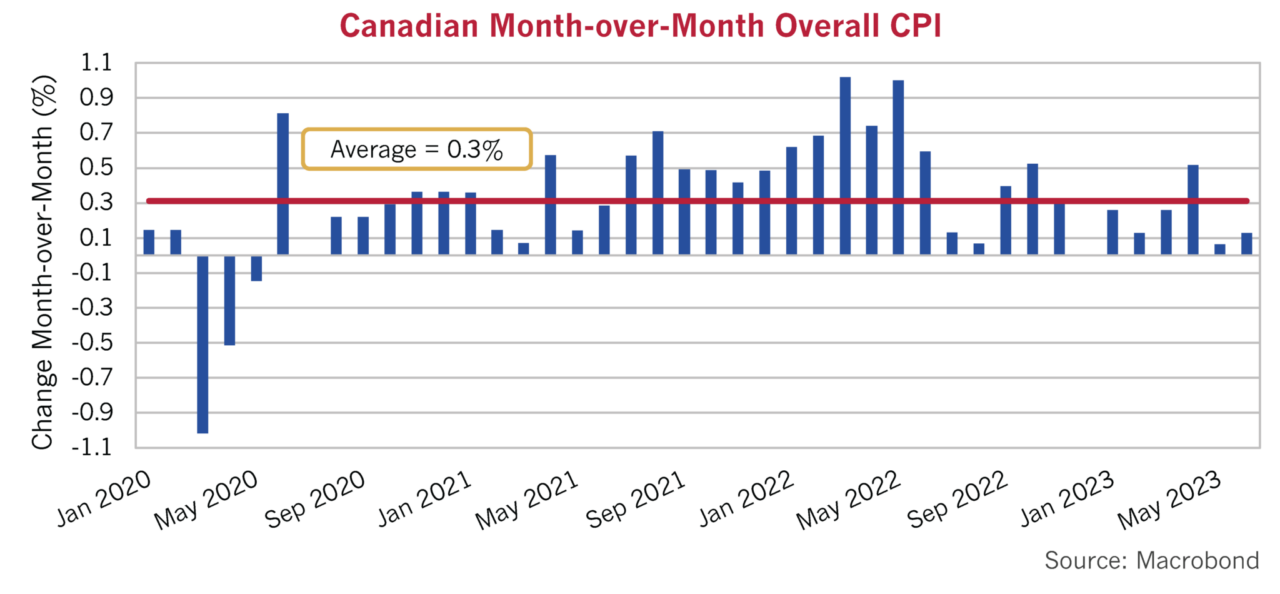
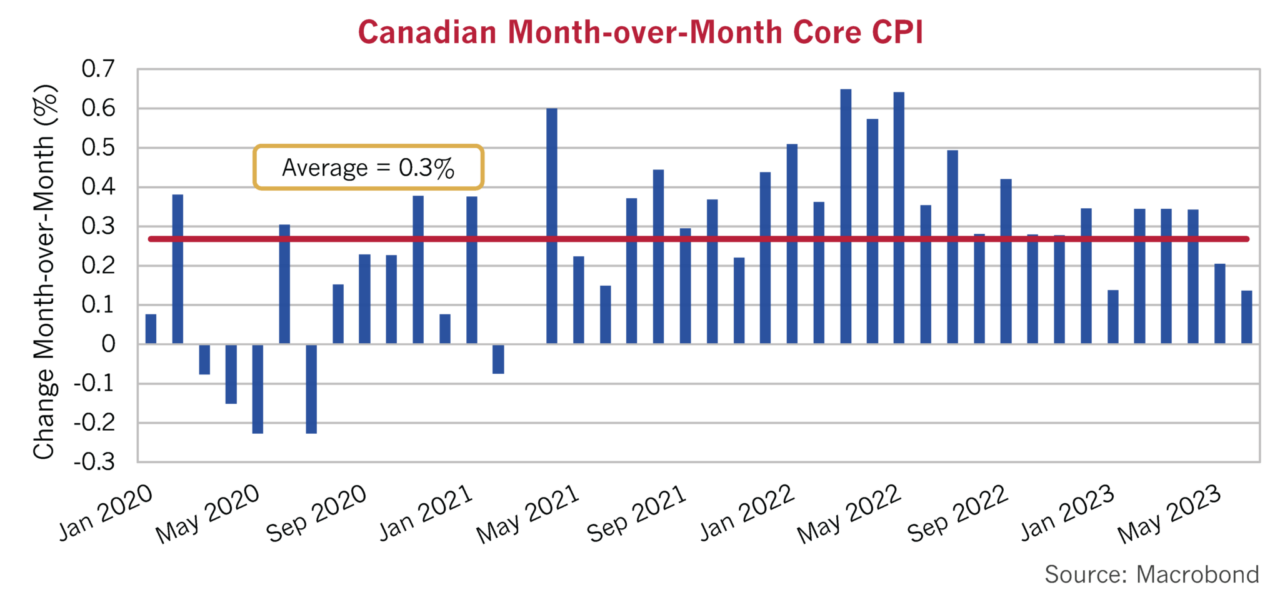
One month does not make a trend, but that’s what the market seizes on to predict the very elusive “turning points”. Even including the deflationary period during the pandemic, the Overall and Core CPI have averaged 0.3% since December 2019. Annualizing that monthly number puts them at 3.6%, clearly much higher than the 2% BOC target. Excluding the pandemic-influenced 2020 gives a higher Overall CPI at 0.4% which annualizes out to 4.8%. If June is not the start of a trend and the long-awaited turning point for inflation, it clearly is going to take further tightening to get inflation down to 2%.
Money Supply’s Harsh Lesson
To conclude, it seems to us that central bankers have learned a very harsh lesson that money does indeed matter, as Monetarist theory predicts. That means the risk, as always, is that our central bankers will overcorrect, so we think the chances of often predicted but seldom achieved “Soft Landing” are low. The stock and credit markets don’t agree with the government bond market that we’re already in recession. Even if inflation miraculously drops immediately to 2%, most of the bond market already have yields at the appropriate range.
The Monetary End Game
The end game of tight monetary policy is not pretty for the economy and the financial markets. That’s why we are becoming more conservative in our portfolios. As we pointed out in our recent July 2023 Corporate Bond Letter, the yield of a long Canadian corporate bond is less than the yield of a T-Bill. The long corporate bond has both credit and interest rate risk. The T-Bill has the risk of missing a bond market rally by not locking in its yield now. When investors are more worried about missing upside than the downside risk, it’s time to batten down the hatches and prepare for heavy weather. As we said in April, it’s very hard to watch a party from the sidelines, but that’s the discipline we need to have to truly be contrarian and take advantage of the inevitable sell off to come.