

Are We Clear? Crystal.
If less is more, then Jerome Powell nailed it in his August 26th speech to the few souls gathered in Jackson Hole, Wyoming, and the millions more virtually eavesdropping around the world. Market participants looking for the slightest bit of equivocation were disappointed as Chairman Powell stated, in the clearest possible terms, he and his colleagues were committed to bringing inflation back to the Fed’s 2% target.
And so, on it goes. Central bankers from Sydney to Ottawa, Frankfurt to Washington, confirming, then reconfirming, commitments to wrestle inflation under control. Market participants looking for signs of weakening resolve or fraying nerves that could derail them from that objective. The result, financial markets lurching from central bank announcement to economic release, and then on to the next.
My Head Gets So Confused
Remember it was just 9 months ago central bankers were on the sidelines. Credit market indicators belied what was to come in 2022. The Bank of Canada overnight rate stood at 0.25%, 30-year Government of Canada bonds yielded 1.68%, and the all-in yield on the U.S. High Yield Index just 4.3%. Fast forward to today. The overnight rate stands at 3.25%, the long bond yields 3.20%, and the U.S. High Yield Index is 9.5%. After over a decade of central bank manipulation, the initial stages of interest rate policy normalization erased trillions of dollars of bond market value in just nine short months.
The last time overnight rates were so high, Katy Perry had just launched her debut smash single I Kissed A Girl in April of 2008. At that time, Canadian long bonds yielded 4.12%. The trailing 12-month Canadian Consumer Price Index measured a modest 1.4%, well under the Bank of Canada’s 2.0% inflation target and a sharp contrast versus today’s red hot 7.0% CPI reading.
Bad Connection
Liz Truss, the U.K.’s latest in the revolving Prime Minister office, certainly misread the audience when her Chancellor of the Exchequer delivered the first mini-budget of her new government. The package of tax cuts and spending measures seemingly caught everyone, including the Bank of England, off guard. Gilt yields skyrocketed, the pound plummeted and the knives quickly came out. The Bank of England quickly intervened buying bonds and sterling in an attempt to stabilize the market.
On the heels of the U.K.’s own goal, rumours abounded that Credit Suisse was in financial difficulty and as we publish this newsletter, it is not exactly clear they aren’t. Percolating to the surface are more concerns that the negative returns in the public markets will eventually require downward valuation on the trillions of private equity and private debt holdings held by investors around the world.
Bank of Nova Scotia (BNS) surprised the business community by choosing Scott Thomson, one of its board members, to be the bank’s next chief executive. Thomson is the chief executive of construction equipment dealer, Finning International Inc. The decision to appoint someone from outside the banking industry to lead Canada’s third largest bank is unusual. Thomson has some experience of banking through his stint at Goldman Sachs and sitting on the board of BNS for six years. Perhaps his experience working in Latin America, where Finning is a major dealer of Caterpillar equipment, notably to the copper industry in Chile, will prove valuable to the bank.
The Bottom Line
The charts below summarize financial market returns for the third quarter and year-to-date 2022. Simply put, there was no obvious place to hide as all asset classes suffered. The carnage in fixed income markets is the worst seen in most of our lifetimes.
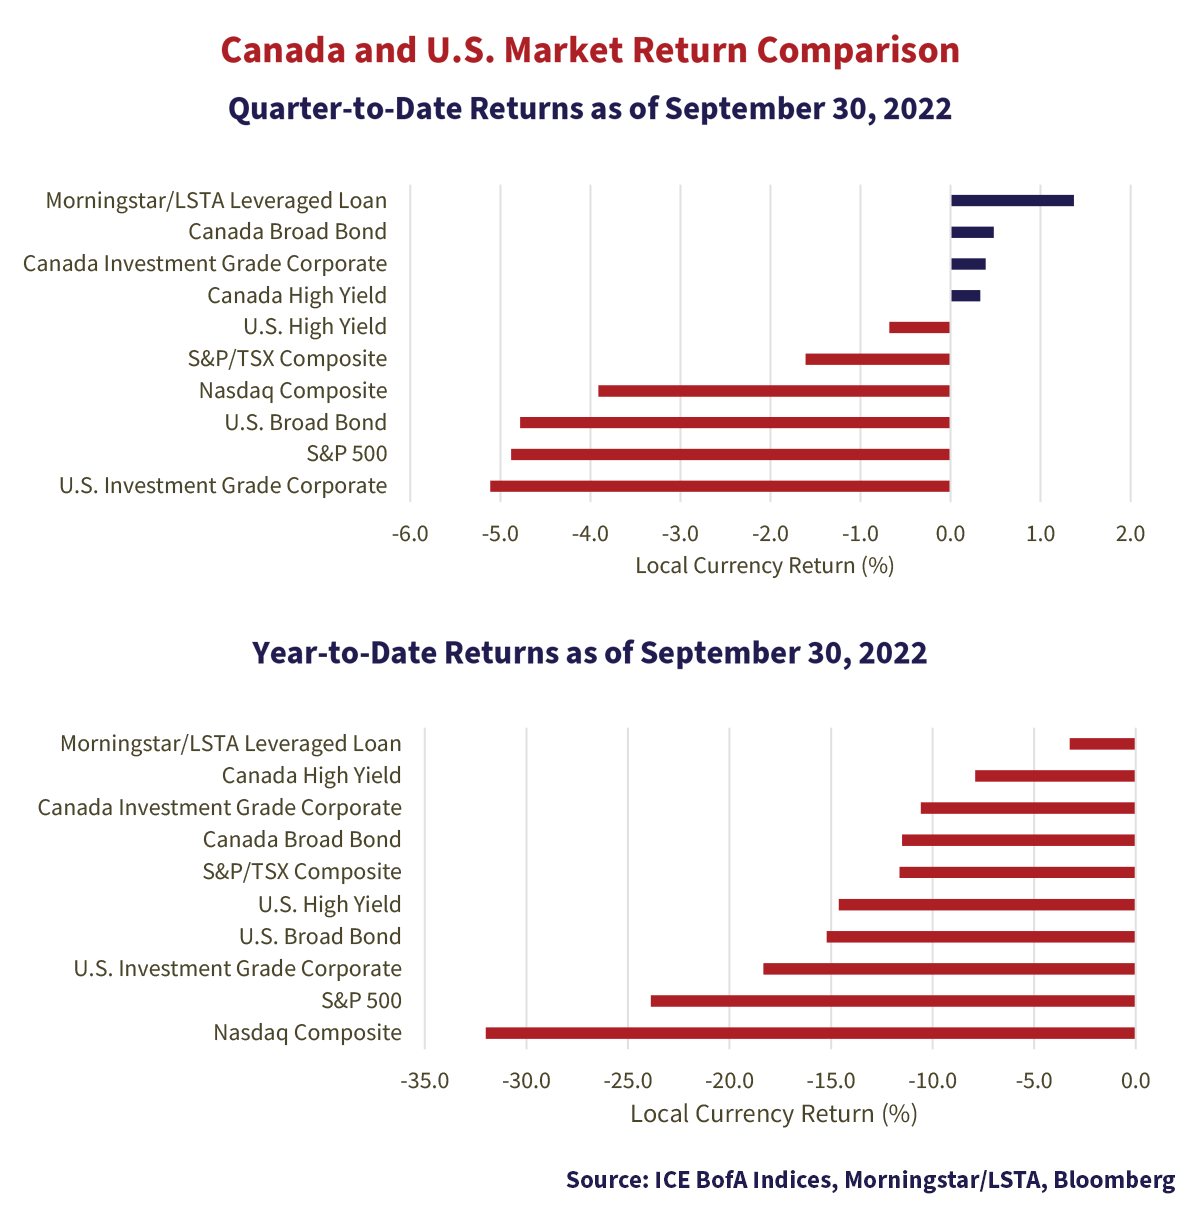
Leveraged loans continued to be resilient and were once again at the top of the table. The Morningstar/LSTA U.S. Leveraged Loan Index produced a 1.4% return in the third quarter, despite falling -2.3% in the month of September. Loan markets were generally supported by light issuance volumes and ongoing demand on the back of CLO origination. The month of September saw large outflows from loan funds and ETFs, a trend which has continued early in October.
Investors in high quality bond markets in Canada also found refuge amongst the wreckage in the third quarter. The ICE BofA Canada Broad and Canada Corporate Indexes both produced slightly positive returns. This in the wake of the Bank of Canada moving overnight rates 100bps higher in July and then an additional 75bps in September. Despite the move in short yields, longer term government bond yields in Canada finished the period largely unchanged. As a result, the Canadian Broad Bond Index returned 0.48% in the quarter with its short-term bond constituents falling -0.34%, offset by its mid- and long-term segments up 0.78% and 1.50%, respectively.
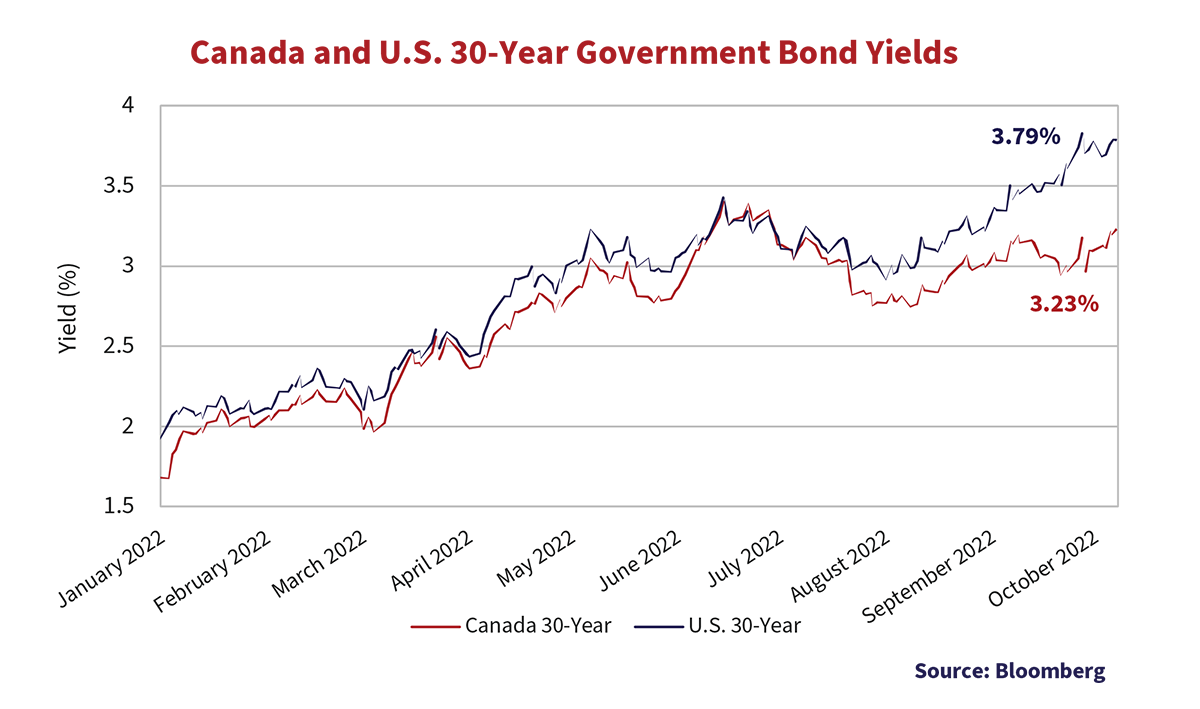
The experience of the U.S. high quality bond markets was markedly different as a result of surging U.S. Treasury yields across the curve. The graph below plots 30-year U.S. Treasury and Government of Canada bond yields in order to illustrate this divergence. Yields in the U.S. pushed sharply higher through September and finished the period at 3.79%, 56bps higher than the Government of Canada bond. As a result, the ICE BofA U.S. Broad Index significantly underperformed its Canadian counterpart with a -4.78% return.
We’ve Got Stronger Beer
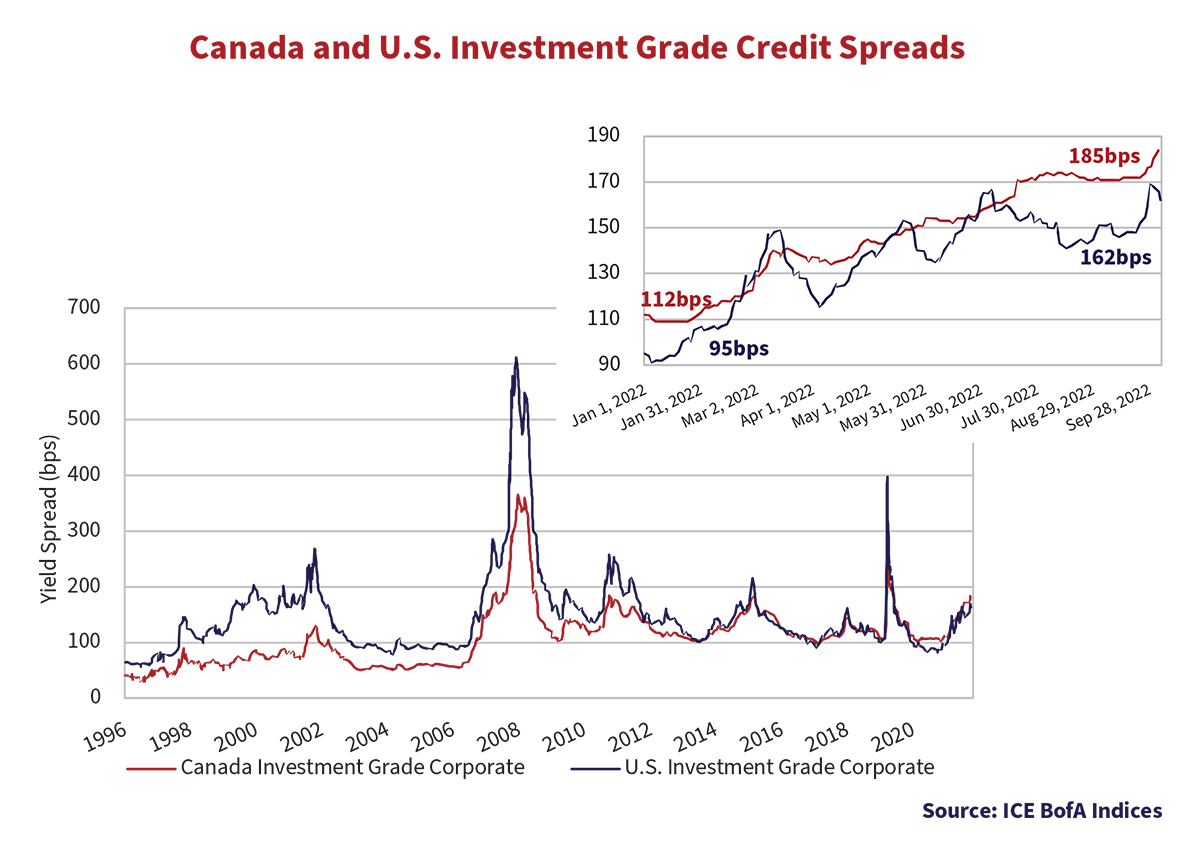
Investment grade credit spreads held up well in the wake of broader market volatility and outflows from the asset class. The graph below plots historical credit spreads in Canada and the U.S. In the most recent quarter, Canadian spreads finished 22bps wider after moving higher in September. Despite this, the ICE BofA Canada Corporate Index remained positive, returning investors 0.39% on the back of falling longer term bond yields. By contrast, rising U.S. Treasury yields across the curve coupled with a modest 5bps increase in credit spreads resulted in a negative 5.11% third quarter return for the ICE BofA U.S. Investment Grade Corporate Index.
Investment grade issuers in Canada continued to be opportunistic in the primary markets. Canadian banks were the most active, issuing across their capital stuctures. Away from financials, a number of corporates took advantage of favourable market conditions in August and early September, to bring new issues to market. Notable among these were longer tenored issues from Loblaws as well as Telus, who accessed the market to fund their acquistion of Lifeworks.
New issuance in the U.S. investment grade market followed a similar pattern. Issuers took advantage of strong market conditions with the markets absorbing significant new issuance in August. Things quieted down later in September as market sentiment turned and yields moved higher.
Tenderizing the Market
Borrowers across industries tapped the corporate bond market in the early days of the pandemic to bolster their cash reserves to protect from uncertainty. With falling bond prices and excess cash flows, now many are addressing the cost of carrying a higher cash balance and are reducing debt where possible. A popular method: debt tenders.
Delta Airlines has benefited from a strong recovery in domestic U.S. air travel. As a result, the company executed a $1.5 billion debt tender in July. Using excess cash, Delta was able to pay down high coupon debt prior to maturity, saving significant interest costs in the years ahead.
Suncor Energy reported adjusted funds from operations of over $4 billion in the first quarter of 2022, the highest in the history of the company. Not to be outdone, second quarter results surpassed this record by 30%. Following these good fortunes, the company came to the bond market with a $1.75 billion debt tender in September. Given the attractive pricing of the offering, bondholders were eager to put their hands up and participate. Strong investor uptake led Suncor to more than double the tender offer, buying back $3.6 billion of bonds in total.
Soliciting Consent
Rogers proposed acquisition of Shaw Communications continues to run into regulatory roadblocks. Complicating matters, Rogers issued over $10 billion of bonds in March 2022 with a “Special Mandatory Redemption” (SMR) clause attached. The SMR clause stated that if the deal with Shaw is not consummated by the end of 2022, the $10+ billion of bonds issued will be redeemed at 101 cents on the dollar.
The modest premium at issuance did not factor in the effect of rising interest rates. By August, longer-dated bonds were trading down in the low $90s-range making the 101 SMR clause quite attractive for bondholders, and quite punitive for the company. As a result, Rogers announced a consent solicitation in August to move the SMR date out a year. Rogers received consent from bondholders for the requested amendment, but will end up paying consent fees to bondholders in the hundreds of millions for the privilege.
When the Tingle Becomes a Chill
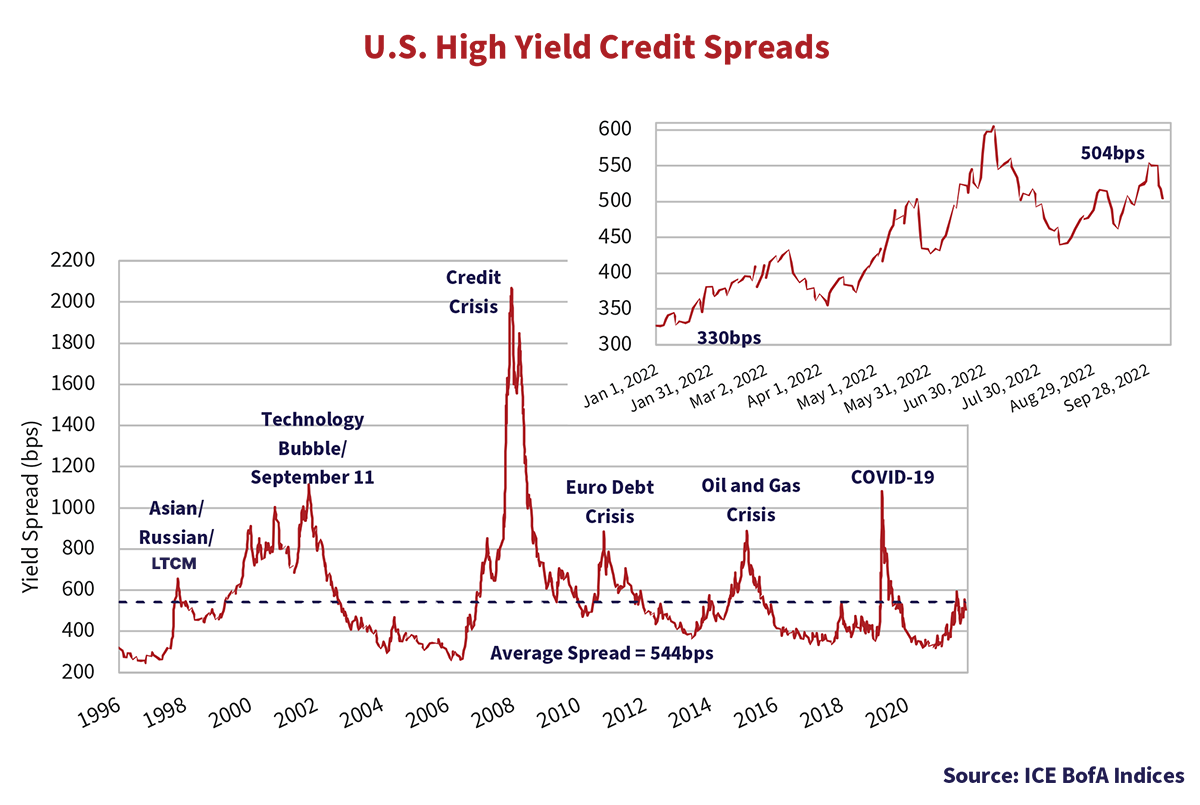
High yield credit markets plotted a volatile course during the third quarter. The graph below charts credit spreads of the ICE BofA U.S. High Yield Index. From 605bps in early July, spreads rallied in to a low of 443bps before climbing to 512bps by August month-end. Renewed attention on monetary policy coupled with recession concerns then pushed spreads to 550bps at quarter-end. At 550bps, high yield finished Q3 below this year’s wide mark of 605bps in early July, and 42bps tighter in the quarter. Tighter spreads did not offset the impact of higher government bond yields and the ICE BofA U.S. High Yield Index posted a -0.68% return for the quarter.
Volatile market conditions and the rise in yields continued to translate into limited new issuance. JP Morgan reported new issue activity at a paltry USD $18.9 billion in Q3, which represents one the lowest quarterly totals since the Great Financial Crisis. At quarter-end, the yield of the Index stood at a lofty 9.6%, versus 4.3% at the start of the year. Issuers needing to complete transactions face significantly higher funding costs and a skittish, often non-committal investor base. Q3 saw multiple new issues print with yields in excess of 10% and a large number of transactions pulled from the market.
Money Changes Everything
On January 31st, 2022, Vista Equity Partners and Evergreen Coast Capital Corporation (an affiliate of Elliott Investment Management) announced their intention to acquire Citrix Systems, Inc. in a transaction valued at $16.5 billion. Investment banks including Bank of America, Credit Suisse and Goldman Sachs agreed to lend nearly the entire puchase price.
Over the summer, the banks attempted to syndicate the debt but the credit markets had changed dramatically. Higher benchmark yields, wider credit spreads and a shift away from levered assets proved strong headwinds. In September, the company sold $4 billion of 6.5% March 31st, 2029 senior secured notes at a price of $83.56 to yield 10.0% and a $4.05 billion 6.5-year term loan at a price of $91 to yield 9.91%. At those prices, it is estimated the investment banks lost in excess of $500 million while continuing to hold exposure to the company.
Elsewhere, citing market conditions, Brightspeed pulled its proposed sale of both secured notes and a 1st lien term loan, which were rumoured to have been marketed at yields of 10% and 10.6%, respectively.
Save It for a Rainy Day
According to our friends at JP Morgan, default and distressed exchange volume in Q3 totaled $23.4 billion, up from $10.4 billion in Q2 and $8.6 billion in Q1. Q3’s total is the highest since the pandemic fueled $80.3 billion in Q2 2020. At 1.57% and 1.63%, U.S. high yield and leveraged loan default rates are trending modestly higher, but remain low on a historical basis. Default rates also continue to be low relative to times of credit market stress.
Over time there will be less money available to lower quality companies and, as the Citrix example demonstrates, the money that is available will be much more expensive. We expect this dynamic to lead to more corporate defaults. So while lower quality credit is looking more interesting, with high yield credit spreads hovering around their historic average and default rates still low, the stress being observed may just be the start.
Someone Told Me Long Ago, There’s a Calm Before the Storm
The market moves year-to-date, and the resultant losses to fixed income investors, are without precedent. In this market, we continue to see relative value in higher quality and highly liquid securities, which will be saleable in the worst of market scenarios. We also continue to concentrate research efforts on issuers new to Canso that may become interesting as credit markets continue to tighten. Our approach ensures that when the next shoe drops, and there is always a next shoe, we will be well positioned to take advantage on behalf of our investors.