

Best Day Ever!
Jeff Bezos declared the few short minutes aboard his New Shepard space capsule his “best day ever!” which is really saying something given he’s the world’s richest person and father of four children. Others recently enjoying good days included unseeded British teen Emma Raducanu who shocked the tennis world to win the U.S. Open over Canada’s own Leylah Fernandez, the United States golf team who destroyed Europe in the Ryder Cup, and American football, which returned to play in front of jam-packed stadiums. Daniel Craig enjoyed a much-delayed good day as his long-awaited last James Bond movie No Time to Die premiered to rave reviews on September 30th.
Manic Monday
In politics, Germany faced the future without Angela Merkel, France’s Macron fumed over lost submarine contracts, and President Biden sought to placate opponents over the Afghanistan withdrawal, immigration policies, infrastructure bills and debt ceilings. Prime Minister Trudeau retained power with another minority government. The Delta variant stretched certain health care systems to their limits as boosters and vaccine passports moved to the forefront of pandemic political discussions.
Can’t Stop the Feeling
Against an increasingly uncertain backdrop, the TSX and S&P500 inched higher in the third quarter. Recovering corporate earnings, cheap money, fiscal stimulus and summer tail winds prevailed over heightened volatility caused by the Delta variant, supply chain capacity constraints, labour shortages and murmurings of Fed tapering. Appetite for credit risk continued as investors sought yield in the most speculative corners of the debt markets.
The Bottom Line
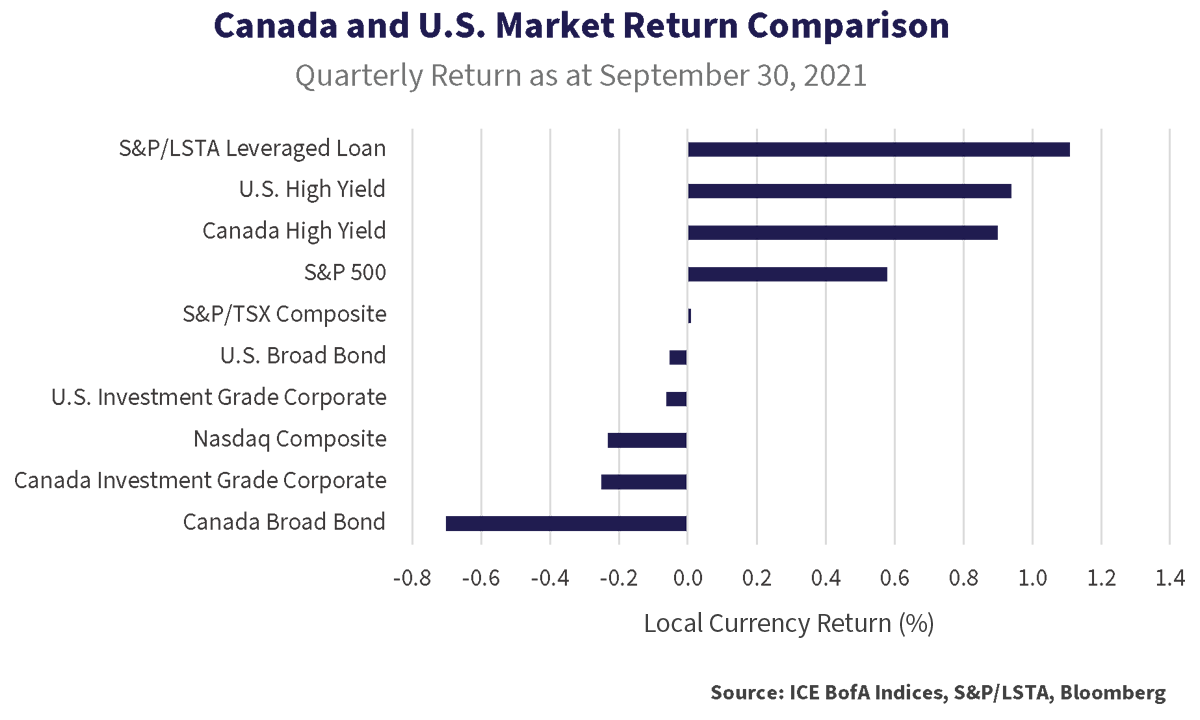
As September drew to a close, the pending default of Chinese real estate behemoth Evergrande sent ripples through risk markets. The Fed announcement of a potential timetable for tapering and future overnight rate increases as well as political brinksmanship over infrastructure and debt ceiling legislation drove longer term yields higher into quarter-end. The spike in government bond yields pushed higher quality bond markets negative for the quarter.
Leveraged loan and high yield markets proved resilient and generated the quarter’s best returns, outpacing U.S. and Canadian equity markets. The more duration sensitive broad market and investment grade corporate indices generated negative returns on the back of rising longer term government bond yields. As did the tech heavy Nasdaq.
Risky Business
Year to date, leveraged loan and high yield markets bested other fixed income markets, only outperformed by the major equity indexes. Duration sensitive broad market and corporate indices generated negative returns as the move higher in longer term yields overwhelmed modest tightening in credit spreads.

I Will Follow
The graph below tracks the returns of the ICE BofA Corporate Index in Canada and the U.S. After sharp drawdowns in the first quarter, both markets trended higher with the U.S. market moving into positive territory for the first time in July. The stay didn’t last long, as rising government bond yields led to falling prices to end the quarter.
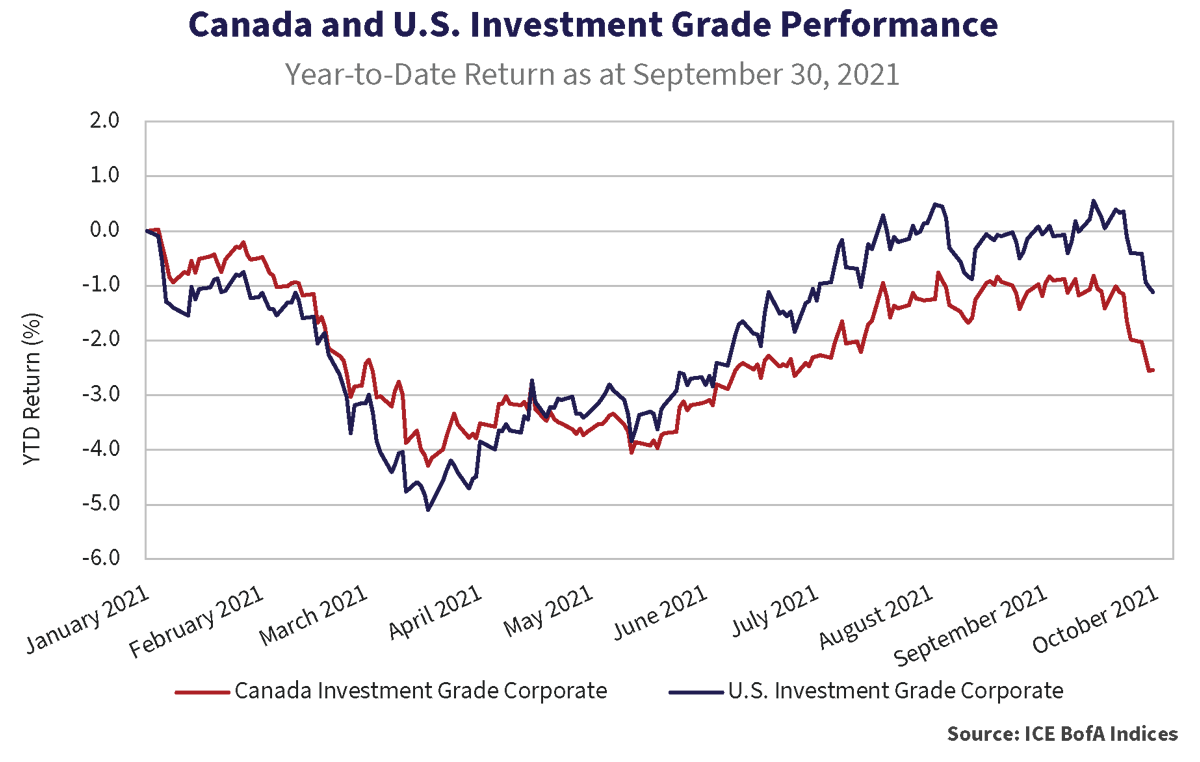
Volatility in government bond yields continued to drive returns in investment grade markets. Credit spreads in high quality bonds have been reasonably defensive through much of the market volatility in risk assets. Pressure on spreads from elevated levels of new issue activity throughout 2021 has been offset by maturities and refinancing activity, limiting net new supply into the markets.
It Didn’t Used to Be This Way
The graph below shows the credit spreads of the Canadian and U.S. investment grade markets. At an average spread of 84bps, the U.S. market continues to look expensive relative to its historic average spread of 148bps. It is also expensive compared to the Canadian market at 106bps, just inside its historic average.
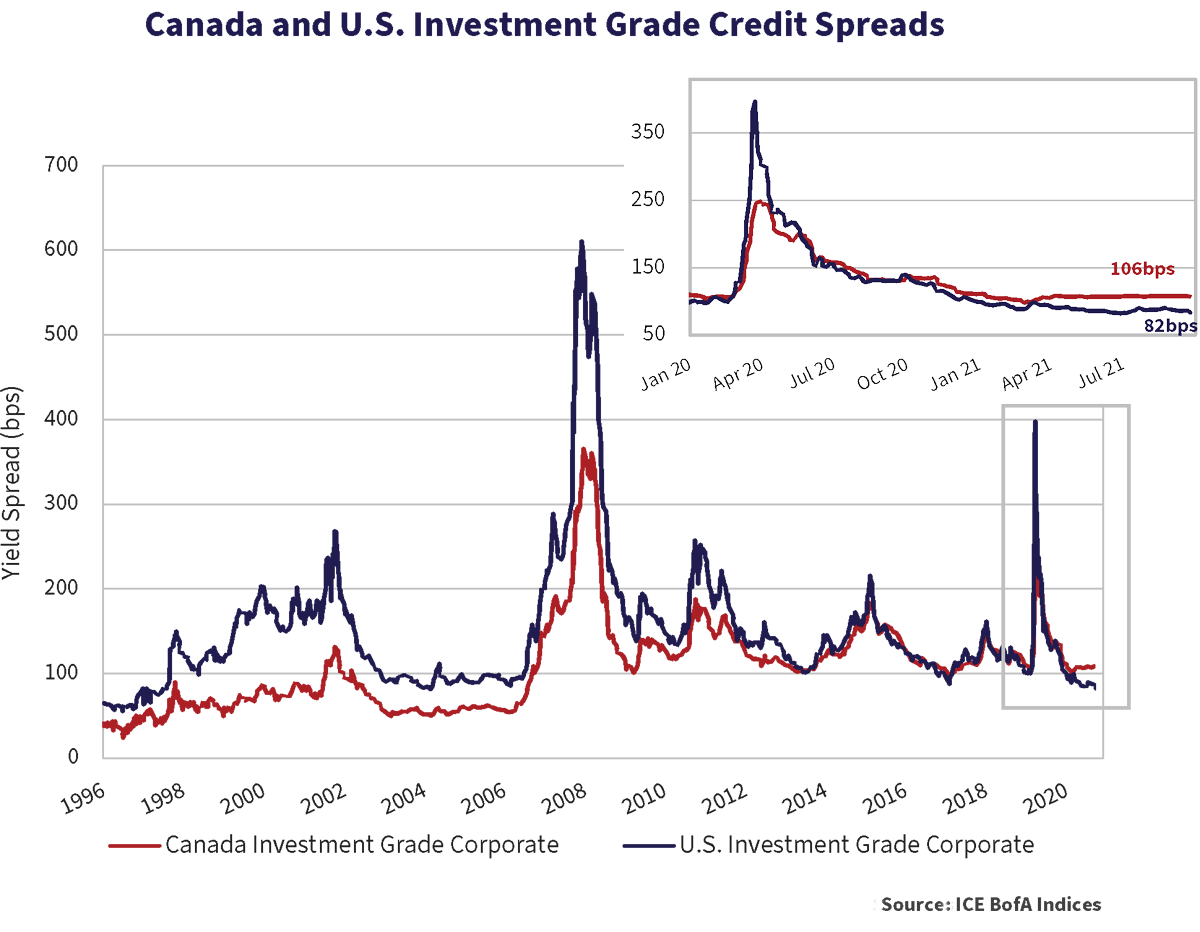
If government bond yields continue to push higher, we expect demand from yield buyers to push investment grade spreads tighter. However, with upside from spread narrowing limited, volatility in government bond yields will remain the key risk in high quality bond markets and will ultimately dictate if negative absolute returns persist through the end of 2021 and beyond.
ESG Targets: $1 Trillion
Investment grade markets continue to experience growth in ESG related issuance. With a year- to-date tally over U.S.$700 billion, underwriters expect ESG debt sales from governments and corporations to surpass U.S.$1 trillion in 2021, more than double 2020 issuance. This push was further led by Walmart Inc. who issued their first green-bond in September. The U.S.$2 billion bond broke the record as the largest green-bond issued by a U.S. corporation. The AA-rated 10- year bond was issued at a 50bps spread above Treasuries and the company will be required to invest the proceeds in “Eligible Green Investments” over the coming years.
Truly Outstanding
North of the border, Enbridge followed up their successful U.S. dollar sustainability-linked bond (SLB) issue in June by issuing their first SLB in Canada. Enbridge raised $1.1 billion from their 12-year offering priced slightly tighter than a normal Enbridge bond. This premium to a traditional Enbridge bond is known as a “greenium” and is indicative of the market’s preference for this type of issuance. Enbridge’s VP of Treasury labelled this deal “truly outstanding”. Desjardins Group issued its debut ESG bond in Canada as well, receiving a 4bp greenium for doing so. We continue to be surprised at investor’s willingness to pay up for these types of securities. After all, a company cannot behave one way for a certain class of security holder and another way for others. A company either has good character or not.
Is It Just Me or Does This Look Expensive?
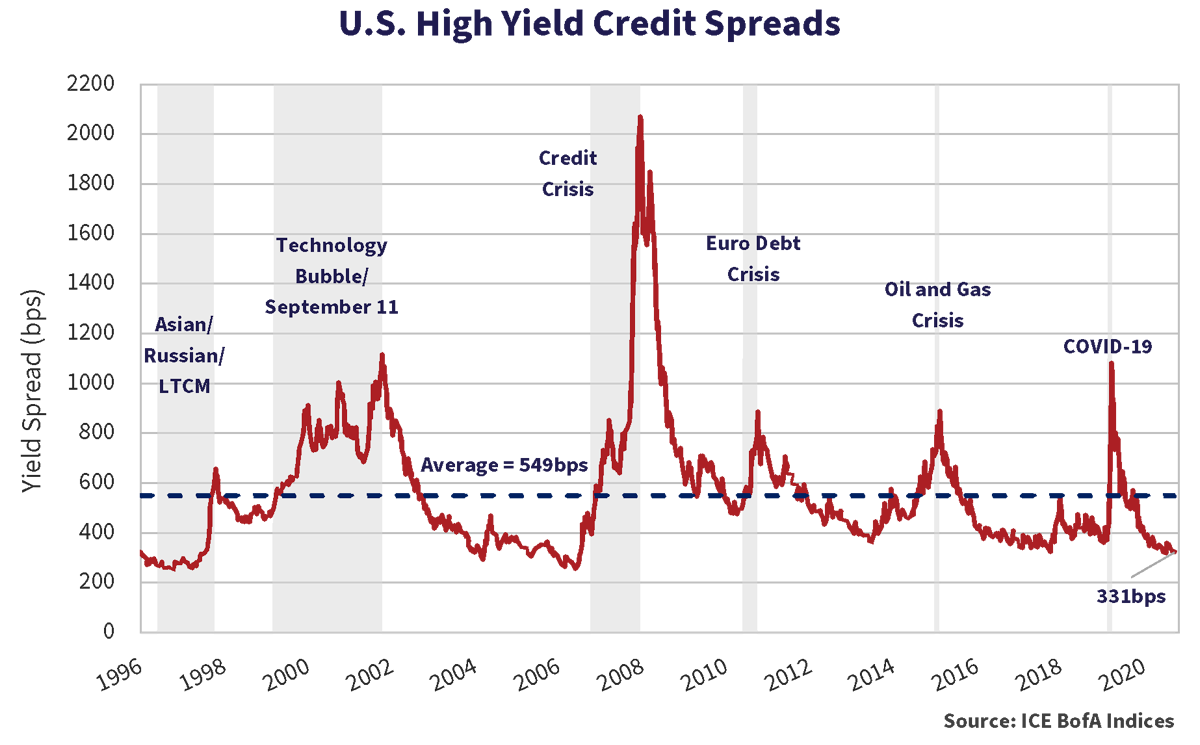
The U.S. high yield market was able to overcome some moderate spread volatility during the quarter and maintain a positive return. While spreads finished the quarter modestly wider, the graph of U.S. high yield credit spreads below illustrates spreads that remain through pre-pandemic levels and are not far from all time tights. At a current spread level of 331bps, high yield markets continue to be expensive.
Taking the High Out of High Yield
The combination of tightening credit spreads and low government bond yields has pushed the all-in yield of the U.S. high yield market to all time low levels. The yield of the ICE BofA U.S. High Yield Index finished the most recent quarter at 4.1% with a striking 56.6% of constituents having a yield below 4%.

Given the historically low yield environment, it is no surprise that companies continue to issue new debt into the markets to yield starved investors. J.P. Morgan has calculated year to date new issuance totals in the U.S. high yield market at U.S.$409.7 billion, which is up 17% since last year, and well on its way to surpassing the record annual issuance of U.S.$450 billion from last year.
Fly Like An Eagle
Issuers in pandemic related industries completed some notable refinancing transactions in the quarter. Royal Caribbean Cruises Ltd. issued bonds with a 5.5% coupon to partially refinance its 11.5% senior secured notes. Carnival Corp. & PLC sold a new issue with a 4% coupon to redeem its 11.5% coupon issue. Air Canada completed refinancing transactions in excess of $7.1 billion including $2 billion in first lien secured notes, the largest Canadian dollar high yield issue to date. The new Air Canada issue came with a coupon of 4.625% and is non-callable for 4.5 years.
The selloff in government bond yields and the seemingly never-ending reach for yield also continues to drive appetite for floating rate leveraged loans. J.P. Morgan’s tally of gross leverage loan issuance is up 110% year over year to U.S.$655.5 billion including U.S.$179.8 billion of repricings and U.S.$355.7 billion of paydowns. The net increase in supply was largely absorbed by strong CLO creation of U.S.$122.3 billion. The market continued to reward issuers with better pricing and more flexible covenant packages as over 90% of leveraged loan issuance in 2021 has been covenant-lite format.
SOFR, So Good
LIBOR’s use as a reference rate for floating rate transactions is coming to an end. Beginning next year, issuers will need to select alternative reference rates as LIBOR drifts into the sunset. Anticipating the change, there was a rush in Q3 to price LIBOR-based deals before the window closes.
But as borrowers and lenders look forward, September also brought the first syndicated leveraged loan deals based off LIBOR’s likely successor, SOFR (the Secured Overnight Financing Rate). Cargill and Continental Grain came to the market with a U.S.$750 million syndicated loan to help finance their acquisition of Sanderson Farms. In addition, Ford refinanced over U.S.$10 billion of syndicated revolving credit facilities using the alternative rate.
The Grande Seduction
Evergrande, one of China’s largest real estate development companies with 798 projects in 234 cities across China, missed a coupon payment on a U.S. dollar bond. The company’s high leverage, exposure to Chinese property markets, coupled with expensive forays into electric vehicles, health care, soccer teams and theme parks, are the focus of investor concerns over the company’s viability and potential knock-on effects in China and beyond. Concerns roiled Asian financial markets and gave pause to North American ones. Evergrande’s U.S. dollar bonds are quoted at ~20 cents on the dollar.
The situation appears to be largely a made in China problem and therefore one likely to be resolved by Chinese authorities. Nevertheless, Evergrande raises concerns over excessive leverage throughout the Chinese financial system and potential knock-on effects on global supply chains and markets.
Concerns over Evergrande and other Chinese real estate development companies made the ICE BofA Asia High Yield Corporate Bond Index the worst performing high yield market year to date. Chinese real state companies comprise 54.2% of the U.S.$178 billion face value of the index (47.4% of market value). Year to date the index return is negative 10.0%. This compares to the positive 4.7% return of the $1.6 trillion par value ICE BofA U.S. High Yield Index.
Don’t Bring Me Down
Excluding the earliest days of the pandemic, fixed income investors assuming the most speculative credit risk while eschewing duration risk, reaped the biggest financial rewards. Underpinned by aggressive monetary policy actions, unprecedented fiscal stimulus and, more recently, reopening economies, corporate cash flows should recover driving improved credit fundamentals. However, we estimate much of this support is already priced into credit market risk premiums.
Nothing vexes fixed income investors more than negative returns, even for short periods. In the current environment we remain cautious about duration and are patiently moving portfolios to higher quality credit. We are selectively participating in refinancing opportunities, notably for issuers hardest hit by the pandemic, where a combination of risk premium and capital structure priority provide adequate compensation.