

The World of Possibilities
There is hope for us all, if sports are our guide. Montreal made it to the Stanley Cup Finals. England hosted the Euro Cup and made it to the final. The 2020 summer Olympics will take place, albeit a year late, so it seems anything is possible.
The world is ever so gradually and tentatively opening up from our COVID lockdown nightmare. As we contemplate what to do with our post pandemic freedoms, who to see first and when to have the sheer joy of a beer on a patio or a meal in a restaurant, the financial markets continue on their very merry way. “Risk Markets” have been celebrating and soaring since the first wave after terrified governments quickly removed financial risk from the pandemic terrors. Central banks continue to accommodate, governments continue to spend and consumers continue to gird for a full and final release of all their enforced savings.
Doge-ing a Bullet
The financial market free fall of March 2020 is a nightmare long faded. The speed and magnitude of the U.S. Federal Reserve’s pandemic response is now seldom referenced but still impactful. The accidental DogeCoin millionaires might not understand that too easy monetary and fiscal policy has caused their fortunes but the huge surplus of quickly created money had to go somewhere!
The transition from absolute financial terror to euphoria started on March 23rd, 2020, when Fed officials announced the Corporate Credit Facility, consisting of support for both primary and secondary investment grade credit markets. Potential corporate demand in the aggregate of $750 billion, or 11% of the U.S. investment grade bond market at the time, was created with the stroke of a pen. The Fed recently announced its intention to unwind this program by gradually selling the corporate assets it acquired by the end of this year. The Credit Facility usage peaked at $47 billion in December of 2020, only 6% of its available financial firepower.
An undeniable signal to the financial markets was sent by the Fed’s willingness to underwrite the corporate bond market directly for the first time in its history. Credit spreads tightened and equity markets rose. The power of the Fed commitment gave market participants confidence to resume buying but has now morphed into perhaps the most speculative markets of all time. When DogeCoin, a digital currency created as a joke and named after a meme, is worth billions, you know money is too easily available and being wasted in the ultra-euphoric investment markets of today.
Canada was not quite as effusive in its fiscal and monetary support and stricter lockdowns mitigated growth. The Canadian financial “Big Easy” came through unleashed residential mortgage insurance and low interest rates. This combined with the Canadian propensity to pay absurd prices for their houses for an even hotter housing market than the pre-pandemic housing mania.
The Bottom Line
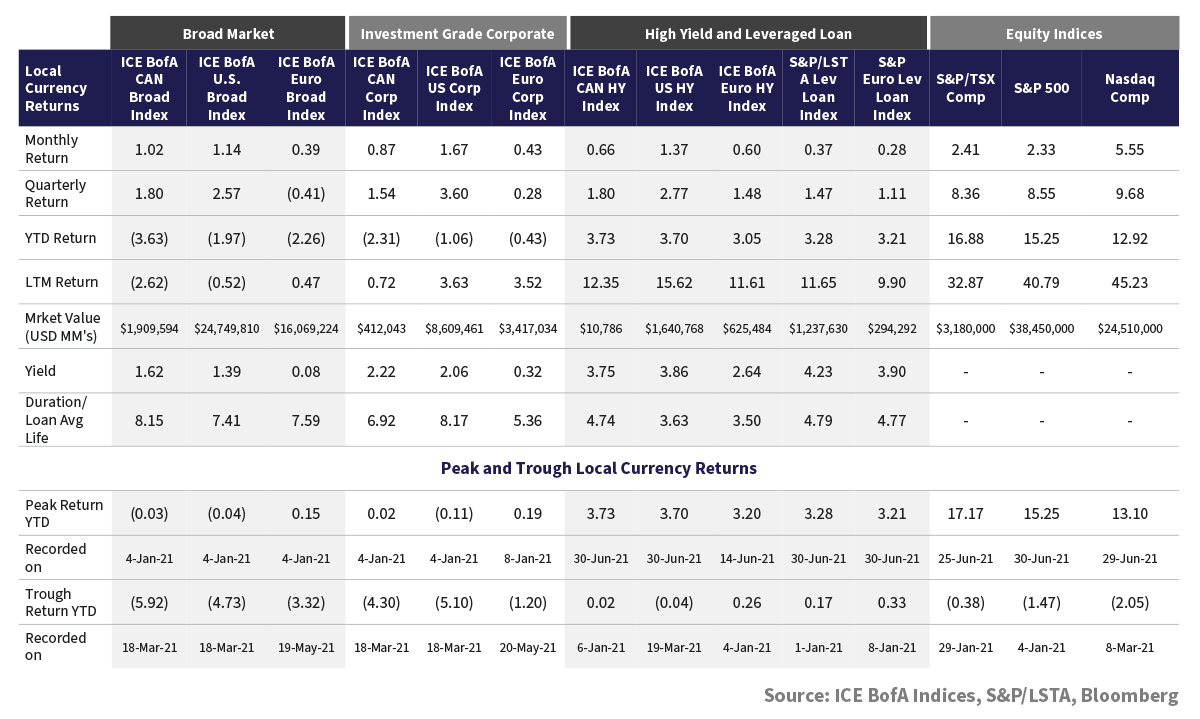
With money cheap, stimulus aplenty and favourable tailwinds, financial markets climbed higher in the second quarter. Major equity markets printed record highs. Appetite for risk extended into fixed income markets as investors continued the reach for yield. Returns were led by the lower quality segment of the market with strong returns in the U.S. high yield market. Higher quality bond markets rebounded on the back of falling government bond yields, following one of the worst single quarter drawdowns on record.
I Think I Can, I Think I Can
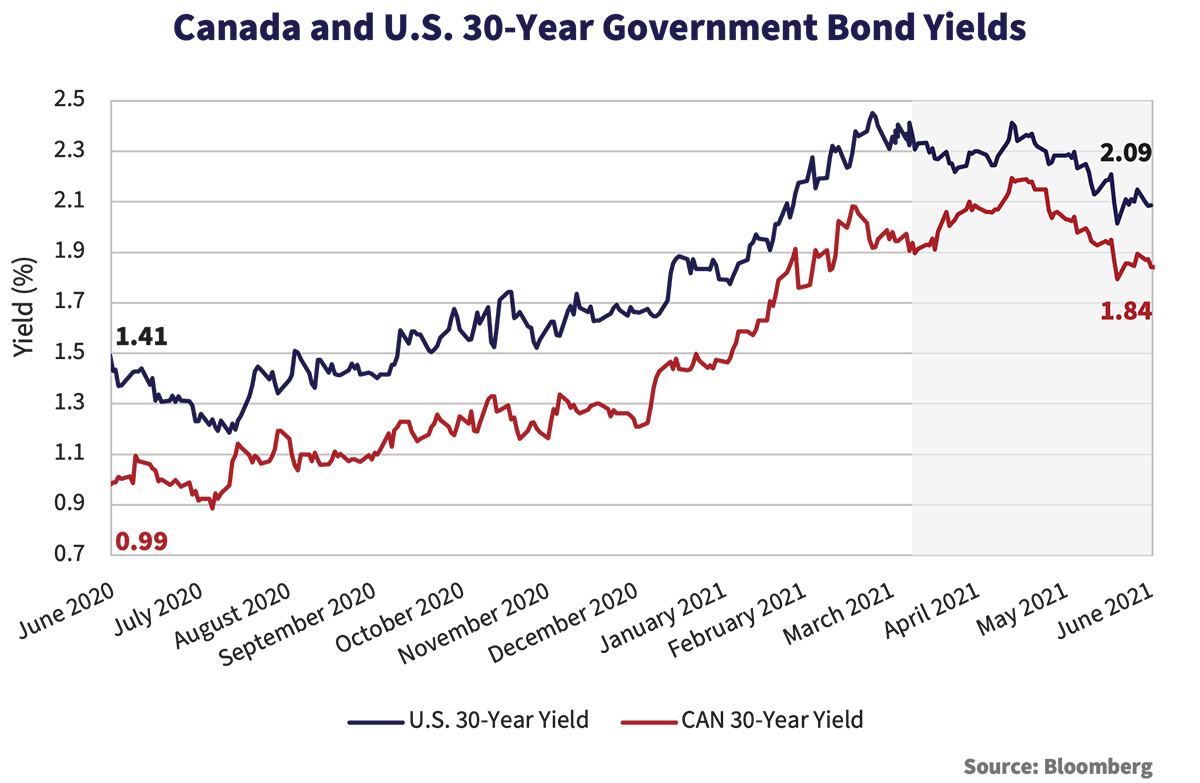
Yields trended higher off the pandemic lows into April as markets continued to price in higher growth and inflation expectations. Longer term yields dropped off in the latter part of the second quarter with investors spinning over the possible transitory effects of the recovery and prospects for enduring monetary support. Despite the late rally, long government bond yields remain markedly higher over the last year.
The graph below plots 30-year Government of Canada and U.S. Treasury yields over the last year. The 30-year Government of Canada yield started at 0.99% and one year later stood at 1.84%. In the U.S., yields began the last year at 1.41% and closed on June 30th at 2.09%. The result was negative absolute returns for the first half of the year. Year to date, investment grade corporates are down -2.31% in Canada and -1.06% in the U.S.
Steady As She Goes
Investment grade credit spreads in Canada were largely unchanged during the quarter. BBB rated issues very modestly outperformed higher quality. As the graph below illustrates, valuations remain reasonable with index spreads measuring 108bps, equal to the long-term average. Liability based investors continue to benefit from relatively attractive credit spreads on longer maturity bonds. Despite this, we believe the contraction in credit spreads on long term issues is unlikely to insulate from negative absolute returns if government bond yields resume their upward trajectory.

Tonight I’m Gonna Party Like It’s 1999
Credit spreads in the U.S. investment grade market continued to grind tighter through the second quarter. A 7bps contraction added to capital appreciation from falling government yields. The result was a strong 3.60% return relative to the 1.54% return in Canada.
As the graph below illustrates, U.S. investment grade credit looks increasingly overvalued. At just 82bps, U.S. high grade corporates trade, on average, 66bps inside of the long-term average. This is despite the weight in BBB rated issues reaching a record 51% of the index. BBB rated issues continued to outperform and look expensive relative to higher quality. Year to date, the strong performance in BBB issues nearly offset the impact of rising yields returning -0.38%, well ahead of the A rated segment at -1.71% and AA rated segment at -1.75%.

The Great White North
The Canadian investment grade market looks increasingly attractive relative to the U.S. Below we graph the difference in investment grade spreads between Canada and the U.S. Canadian spreads stand 26bps higher than the U.S., just below the all-time high differential reached late in June. Earlier this year, we observed that U.S. spreads have historically been higher due to the higher quality bias in Canada. The markets have traded in closer unison in recent years as the credit quality composition has converged. We are now reaching uncharted territory as the U.S. market outperforms.

New Kid in Town
In the last Newsletter we highlighted the growth potential of the new Limited Recourse Capital Note (LRCN) market in Canada. We also forecast LRCN spreads would continue to tighten. Both occurred in the second quarter.
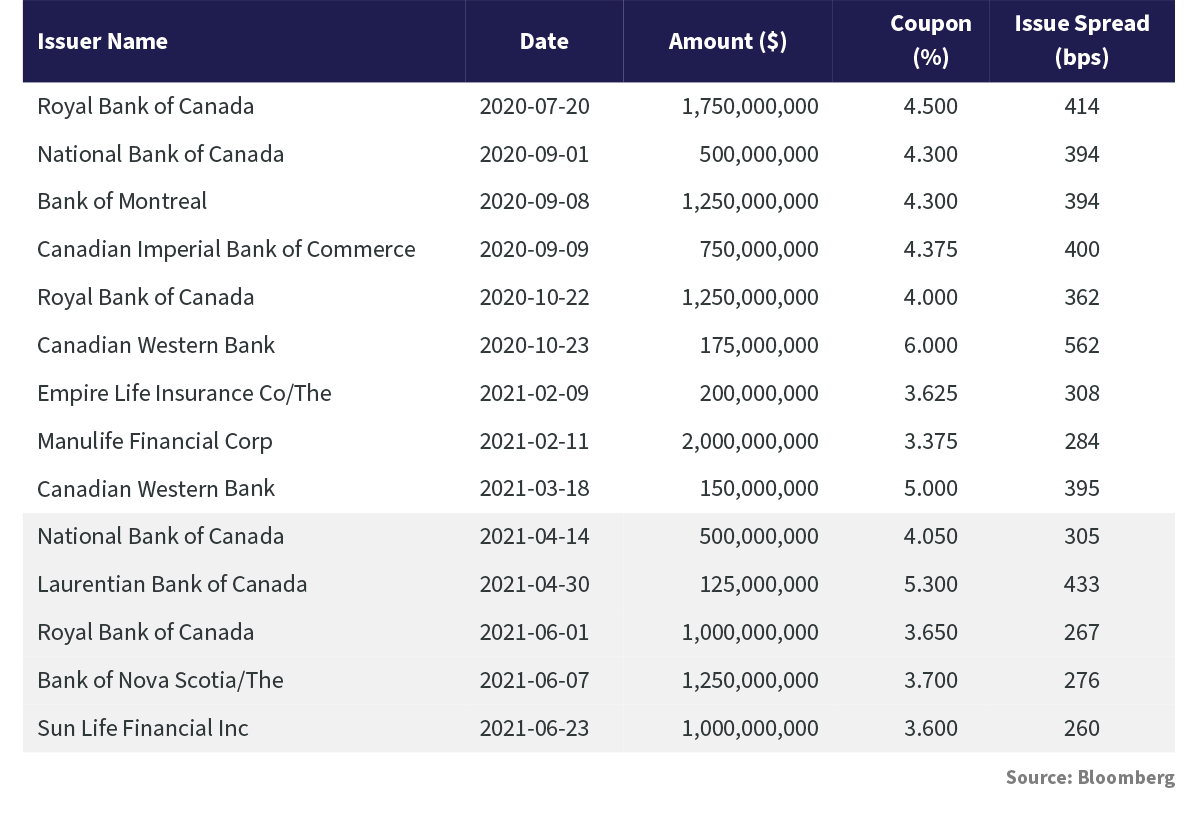
The LRCN market grew in the second quarter as $3.9 billion in new issues priced. This past quarter brought inaugural issues from Bank of Nova Scotia and Sun Life Financial. National Bank brought its second LRCN and Royal Bank its third. The LRCN market now totals close to $12 billion in size. The table below outlines all issues done to date.
On the back of new LRCN transactions, issuers redeemed more expensive traditional preferred shares. Bank of Nova Scotia, Canadian Western Bank and National Bank redeemed preferred shares in the period. In total, banks and insurance companies have redeemed over $5 billion in preferred share issues since the first LRCN issue came to market. This trend should continue as banks issue additional LRCNs and call preferred shares on reset dates. The chart below illustrates the impact of the growth of the LRCN market at the expense of traditional preferred share issuance by bank and insurance companies.

LRCN spreads continued to tighten from new issue levels. The first Royal Bank issue priced at a spread of 414bps over the 5-year Government of Canada yield in July of last year. In June of this year, Royal Bank priced a new issue LRCN at a spread of 267bps. This was 147bps tighter than their first issue, compared to spread tightening of only 34bps experienced by the overall corporate market in the same period. We expect investor demand for these securities to drive further convergence in credit spread relative to other priority debt within financial institution capital structures.
From ESG to SLB
Interest in, and issuance of, climate bonds, green bonds and impact bonds (to name just a few) has skyrocketed in the last few years. Interest is particularly strong in Europe but is gaining traction in North America. Issuers, investment management firms and underwriters are racing to create all types of products with feel good monikers to attract investors to the same.
The most recent iteration to hit the Canadian market are Sustainability Linked Bonds (SLB). These differ from green bonds as proceeds can be used for general corporate purposes and do not need to be tied specifically to green investments, although they can be. SLBs include a coupon step-up feature if certain E, S, or G, commitments are not achieved by the company. Monitoring of objectives is contracted out to a third-party firm.
In June, Telus Corporation issued Canada’s first SLB, a $750 million 10-year issue at a credit spread of 139bps. Telus committed to Scope 1 and 2 greenhouse gas (GHG) emission reductions of 46% by 2030. Failure to meet this target results in a coupon step-up of 1.0% in the final year. Investors rewarded Telus with a “greenium”, or discount to existing secondary levels, of 6bps.
Bell Canada and Enbridge Inc also raised capital approximately 5bps cheaper than a traditional bond financing through ESG-related issues. Bell Canada issued a $500 million green-bond in May while Enbridge Inc raised US$1 billion through their inaugural SLB issue in June.
Globally, there has been U.S.$40 billion of SLB issuance in the 1st half of 2021. As demand for ESG-related investments grows, the SLB market is expected to grow along with it. That companies are willing to set specific targets for improvement is laudable. However, in our view, if we like a company and believe in its “character” given the choice of paying up for a green or SLB bond, or earning extra yield for buying an equivalent security without a designation, we would choose the latter.
How Do You Sleep?
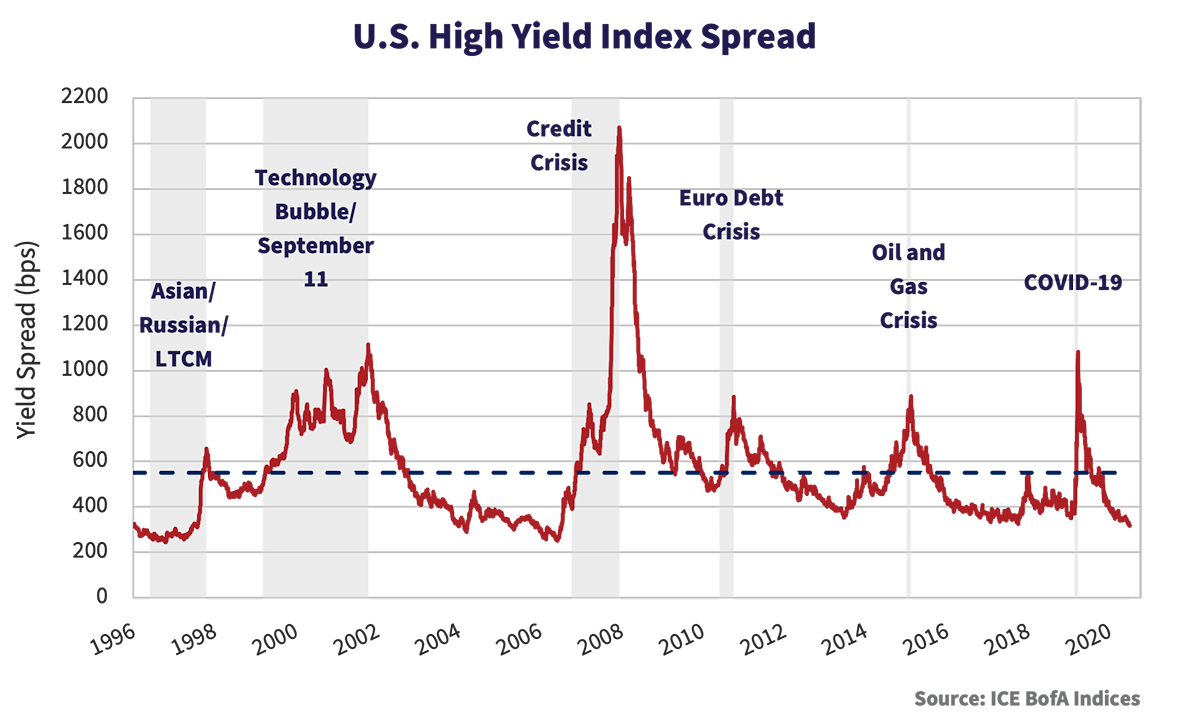
Credit spreads in the high yield market tightened further during the second quarter. Yield starved investors moved further down the spectrum to more speculative credit investments. As the graph below illustrates, valuations in high yield are well inside of the historic average and are now more expensive than prior to the COVID-19 sell off. The 3.86% nominal yield of the high yield market at the end June is well below the elevated levels of inflation in the market.
The CCC and lower category of the market continues to outperform the other segments of the high yield index. Year to date, CCC and lower rated bonds returned 9.51% compared to 3.32% for B rated issues and 2.68% for BB. The graph below plots the difference between CCC and lower and BB rated spreads. Since 1996, on average investors have received an extra 776bps in yield compensation for assuming the extra credit risk of owning a CCC rated security, while today that margin is just 241bps.

Mirror Mirror on the Wall, Who’s The Fairest of Them All
The answer depends on when you look and who you ask. The High Yield Energy and Production Index returned a near perfect 99% between March 23rd, 2020, the day of the Federal Reserve’s establishment of the Corporate Credit Facilities, and 2021. During the same period, the overall high yield index returned 34%. Timing really is everything.

I Just Can’t Get Enough
Investor demand for high yield drove secondary market performance and a robust new issue calendar in the first half of 2021. According to JP Morgan, U.S. high yield and leveraged loan new issue volumes totaled $299 billion and $495 billion respectively, both on pace to set annual records. Refinancings comprised the majority of new issue transactions as companies took advantage of substantially lower funding costs.
Strong credit markets, fueled by investors’ reach for yield, allowed all but a very few companies to avoid default, despite less than ideal economic conditions. According to JP Morgan, only $9.1 billion in high yield bonds and loans defaulted year to date versus $141 billion in all of 2020. JP Morgan recently reduced its estimate of high yield and leverage loan defaults to 0.65% for 2021 – well below the 3.6% and 3.1% long term averages for bond and loan markets respectively.
History Never Repeats (Until it Does)
Low yields and narrow risk premiums should concern fixed income investors. Easy money, inflationary pressures, and lax lending standards dictate a move to shorter duration, higher quality securities from longer term, lower quality credit.
History reminds us that credit spreads can remain narrow, interest rates low, and bonds expensive for longer periods of time than seem justified by fundamentals. Bubbles formed and sustained by easy Central Bank policy, overly generous government fiscal programs, and consumers’ desire to borrow to spend are hard, but not impossible to burst. When financial bubbles burst, they tend to do so in spectacular fashion.
A booming economy supports corporate cash flows and generally should be good for corporate credit but only to a point. When financial market expectations exceed the enthusiasm of English football fans you know something is more than slightly amiss. It is time to assume a more conservative posture.