

Against The Wind
We say “Goodbye” to 2022 or, more fittingly for investors, “Good Riddance”. Sharply rising inflation and interest rate increases dominated the headlines and headspace for investors this past year. The experiment of zero interest rates and central banker financial market heroics may finally be behind us.
Russia’s invasion and continued assault on Ukraine has shocked the world and financial markets. The implications for globalization and international trade, not to mention the humanitarian disaster, will be felt in the years, and likely decades, ahead.
Canada qualified for its first Men’s World Cup since 1986, the same year Argentina last lifted the trophy. The 2022 edition included a thrilling Final that saw Lionel Messi finally get his hands on the coveted prize.
Closing out the year, Twitter was very publicly taken private, Bob Iger returned to his family at Disney in time for the release of Avatar: The Way of the Water, while anyone who was trying to return to their family for Christmas hopefully didn’t book via Southwest.
Don’t Bank on It
The crypto dominoes began to fall in 2022 and Bitcoin’s value halved by mid-year. The value of Luna and Terra evaporated, seemingly overnight, leading to the collapse of hedge fund, Three Arrows Capital. Crypto lenders Voyageur Digital, Celsius Networks and BlockFi all filed for bankruptcy. And FTX founder and recently hailed “White Knight of Crypto”, Sam Bankman-Fried, was arrested and accused of one of the biggest financial frauds in history.
The Market Gods Gave Quarter
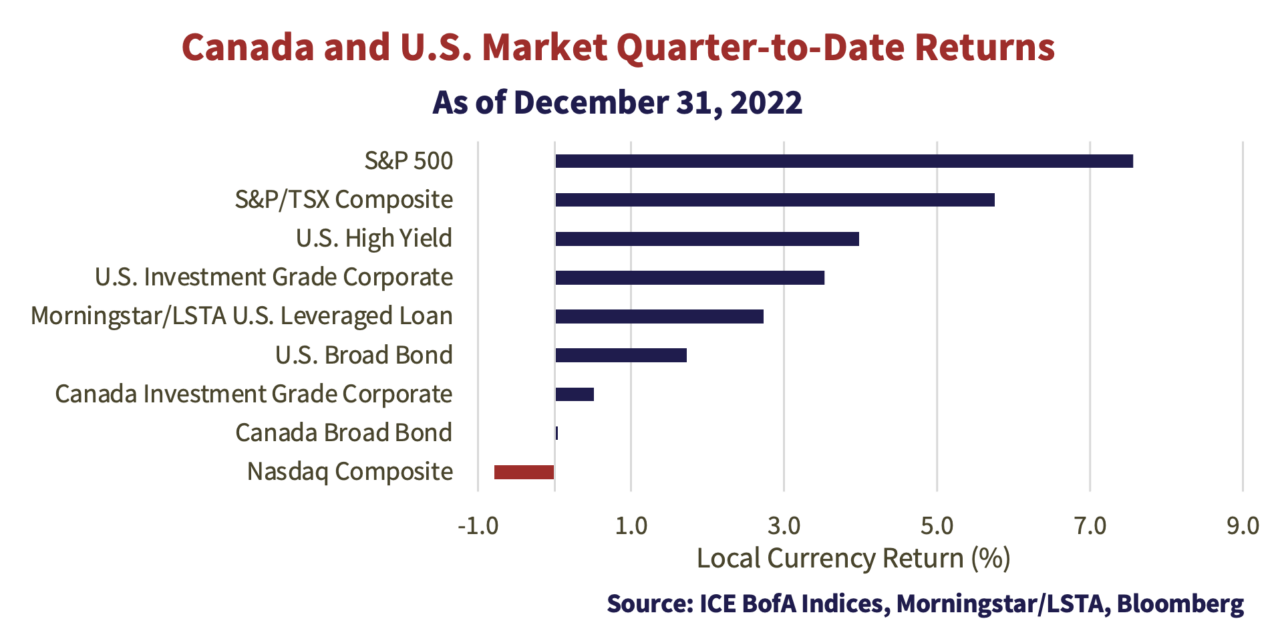
The fourth quarter brought some respite to an otherwise dreadful year. Equities led the charge, apart from the Nasdaq, which continues to be heavily impacted by the fall from grace of tech stocks. Fixed income markets shook off higher administered rates to slow down the pace of historic losses. Bond markets benefitted from shrinking risk premiums and the return of the “income” in fixed income. Investors seeking solace in bonds and cash had yields over 4% for the first time in many years. The U.S. high yield market was the leader with a 3.98% return and on down to the highest quality broad bond markets. The Canadian markets limped over the line without the same boost from corporate spreads narrowing as in the U.S.
Performance of the full year 2022 turns the warmth of the fourth quarter to chills. Bond markets experienced one of their worst years in the past century. U.S. equity markets entered bear market territory. Canadian equities, buoyed by commodities, avoided the worst of the declines. The standard asset mix 60/40 balanced fund investor experienced the worst annual return since the Great Depression.
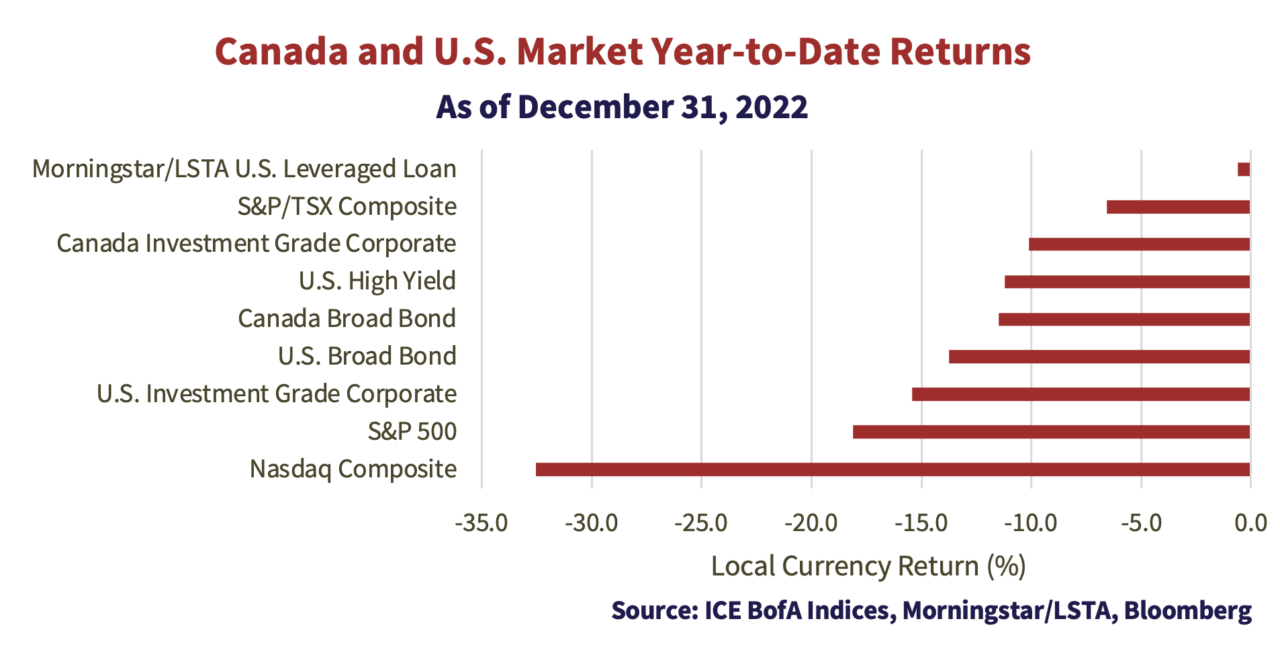
The Morningstar/LSTA U.S. Leveraged Loan market was a steady fixture at the top of the table this year. Leveraged loans were the best of the worst, finishing 2022 only “slightly” negative. The insatiable market thirst for rising yield manifested itself in demand for floating rate leveraged loans. Prices were supported by paltry new issue volumes and reasonable ongoing demand from CLOs. This saw floating rate leveraged loans outperforming fixed rate high yield bonds by the largest ever margin in 2022. The strong relative performance was underpinned by the 3% return of the higher quality BB issues, while the most speculative CCC loans fell -11% in the year.
In high quality bond markets, wider credit spreads contributed to negative returns this year, but the impact from credit paled in comparison to the impact of higher government bond yields. The best performing bonds had the shortest duration, which translates to the least interest rate sensitivity. Canadian investment grade credit spreads widened 25 basis points (bps) more than their U.S. counterparts, but their lower duration powered a meaningful outperformance.
500 Miles Away From Home
So just how bad was 2022 for corporate bonds?
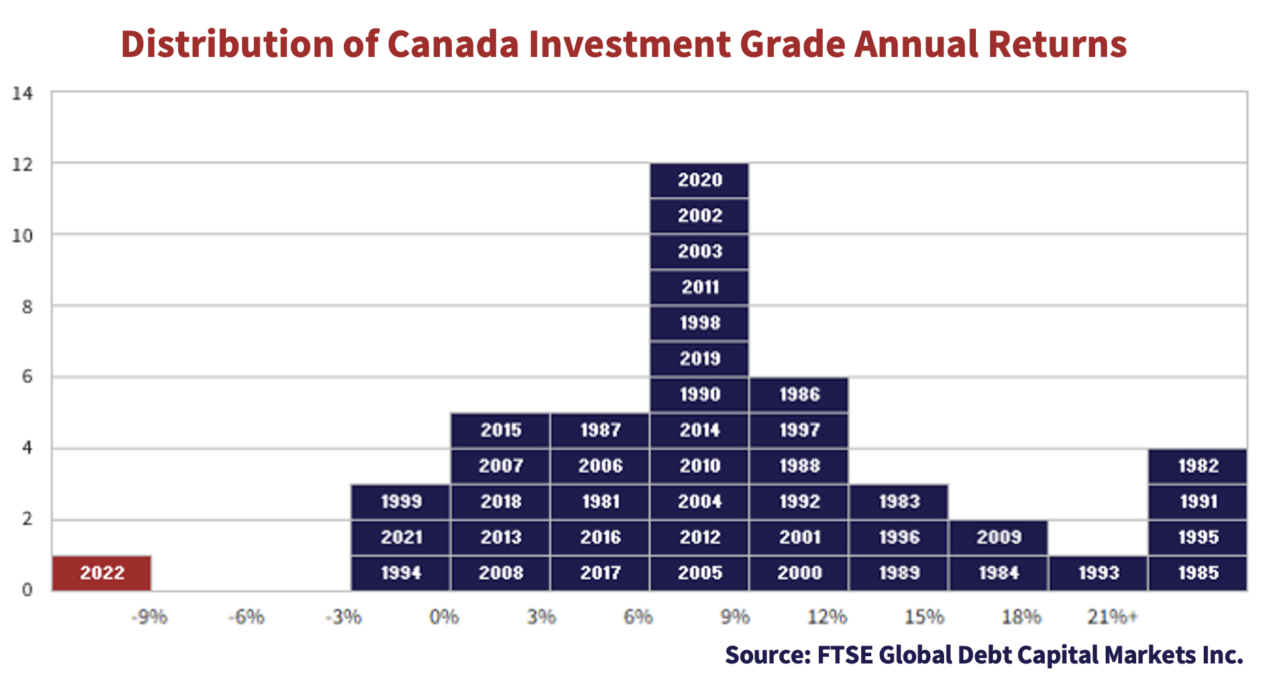
Very bad! Seeing that the FTSE Canada All Corporate Bond Index began in 1981, there is no comparable. The worst previous year in the Canadian corporate bond market was 1994 which saw the corporate bond market fall -3.0%. That looks modest compared to 2022’s -9.9% return. As you can see from the histogram below, 2022 is “off the chart”. Talk about a left tail!
Have You Ever Seen The Rain?
The below chart speaks directly to the experience of bond managers. If they started their careers in 1981 like the FTSE Canada All Corporate Bond Index, they are now in their 60s and have only known falling interest rates and yields for their whole careers. As the chart below shows, with the last 40 years highlighted in the green box, Canadian interest rates peaked in 1981. The Bank of Canada rate peaked at 21.2% in August 1981 and the long Canada peaked at 18.3% in September 1981.
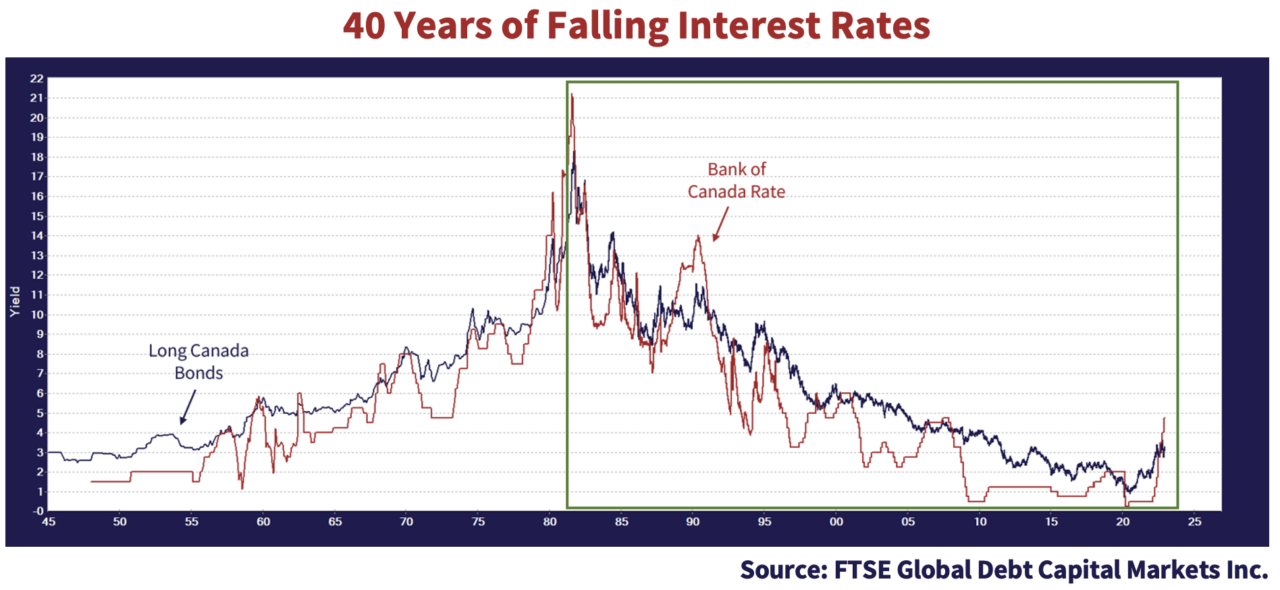
The recent rise in Canadian bond market yields is something that bond investors have seldom seen in their professional lifetimes, and never for a sustained period. After hitting generational lows from 2010 to 2020 when central bankers became enamored with ZIRP (Zero Interest Rate Policy) and QE (Quantitative Easing), there was nowhere to go but up for bond yields! As we’ve said many times, the very low level of bond yields made them very sensitive to rising rates, with little yield to offset the price loss pain. That’s why bond prices have been crushed.
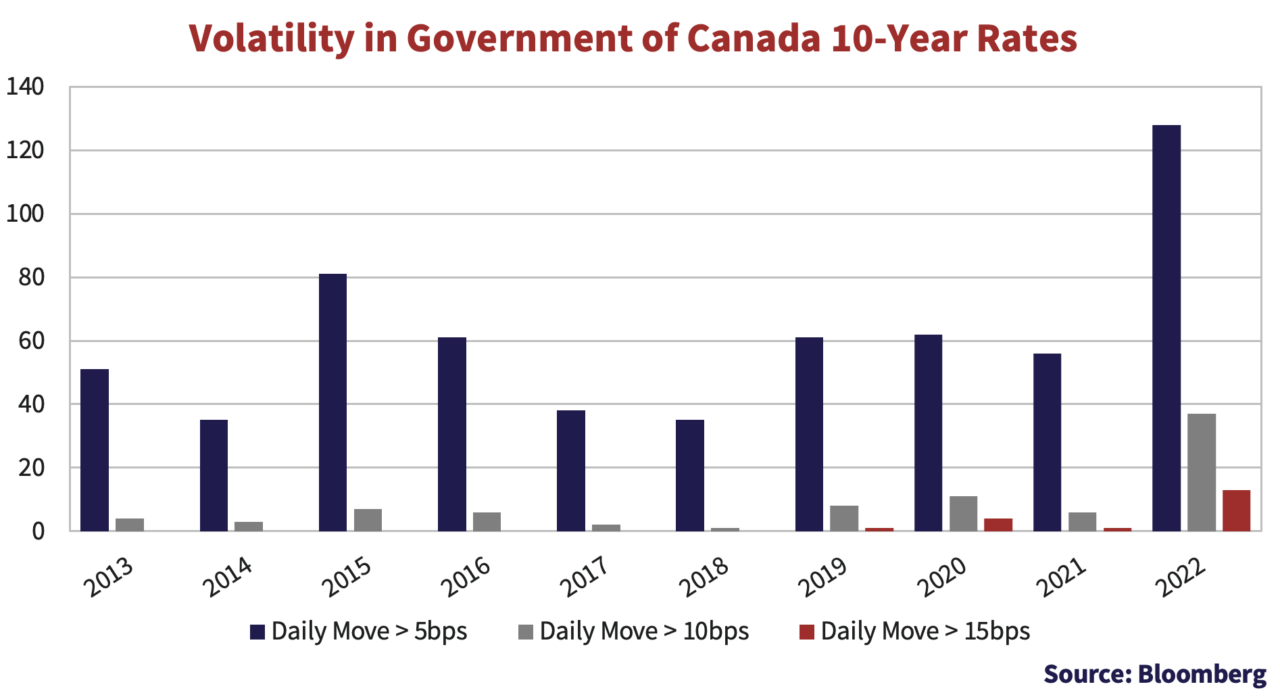
Delta Dawn
The lack of experience with a rising rate environment has made the bond market very volatile, as investors don’t know what to do in their new reality. It felt like each morning we fired up our computers this past year, rates were on the move. Bids would be hit one day. Offers would be lifted the next day. Fear of losses would be followed by fear of missing out. Uncertainty breeds volatility as investors become victims to the bid-ask spread. It was truly a market maker’s dream.
In the boring bond markets, a move of more than 5bps in a day is noteworthy. We looked at the 10-year Government of Canada bond, and on 128 separate trading days (nearly 50% of the total trading days in 2022), it moved up or down more than 5bps. This was more than any year in the past quarter century. Furthermore, the bond moved more than 15bps on 13 trading days in 2022 – more trading days than the previous 10 years combined!
How Do You Like Me Now?
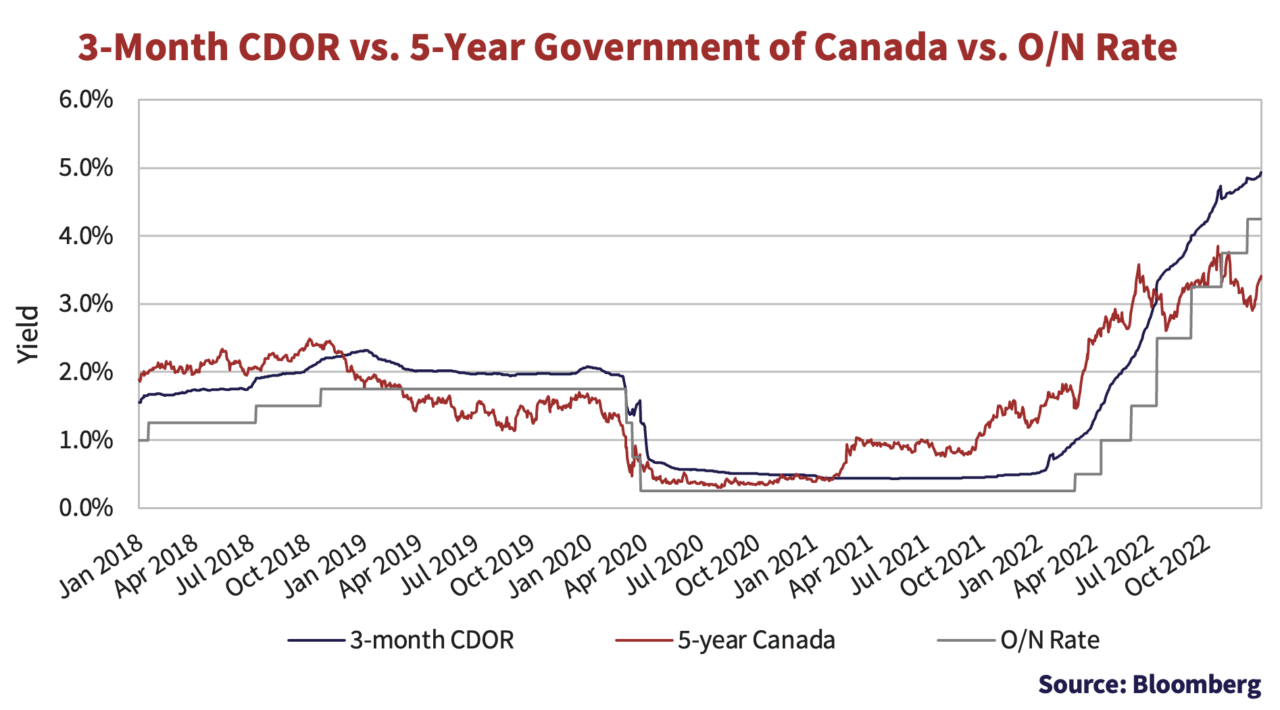
As the Bank of Canada hiked its overnight rate from 0.25% to 4.25% over the course of the year, 3-month CDOR also marched higher. CDOR, the reference rate for most floating rate securities in Canada, has had a meaningful impact for floating rate bondholders this year, softening price declines while increasing coupon payments.
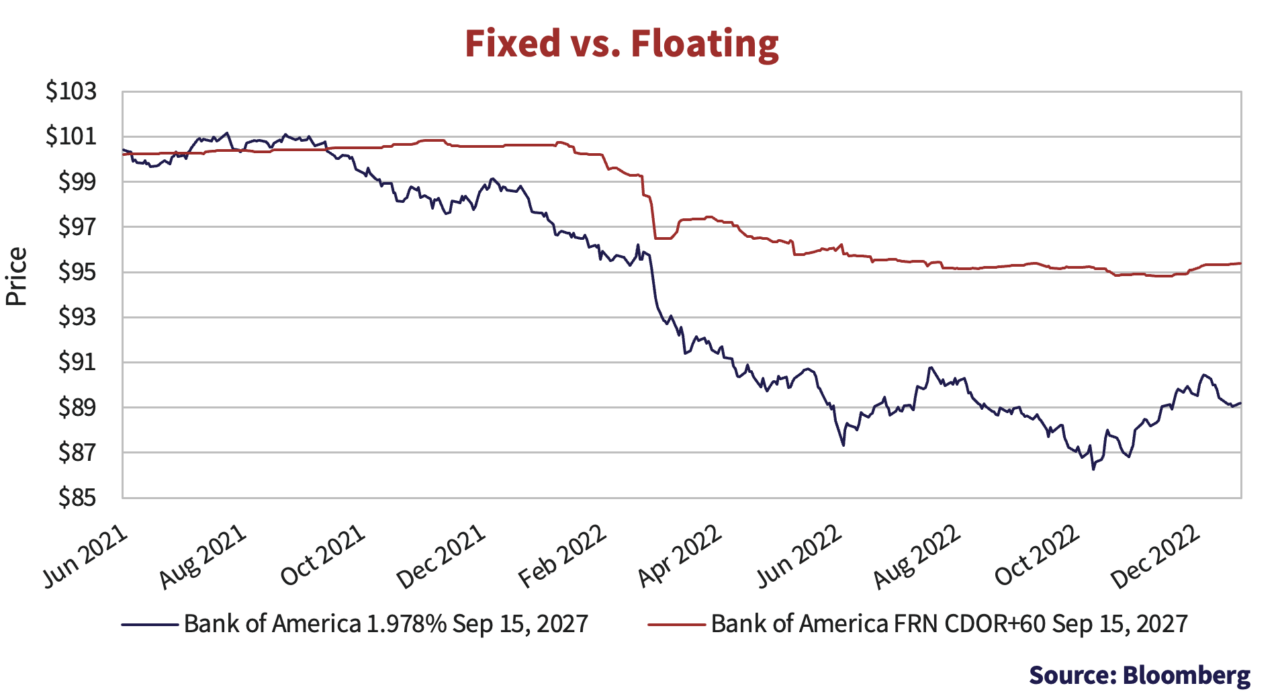
To illustrate the impact, the Bank of America floating rate security in the graph below pays quarterly interest at a rate of 3-month CDOR plus a fixed spread of 0.6%. Last December, when CDOR was 0.5%, holders of the floating rate security received quarterly coupons at a rate of 1.1%. Whereas holders of the fixed rate security would have received coupons at a rate of 1.978%. Floating rate holders were approximately 0.9% worse off.
Fast forward to this December, with CDOR at 4.8%, holders of the floating rate security will receive coupons at a rate of 5.4%. Whereas holders of the fixed rate security will still receive coupons at a rate of 1.978%. The floating rate holders are now better off by a huge 3.4% margin. To reflect the coupon disparity, the fixed rate bond’s price had to drop. The graph below plots the price impact for each of the bonds.
Corporate Action
Investment grade credit spreads continued the final quarter of 2022 on the path wider before eventually rallying to close out the year. The graphs below plot the experience of investment grade credit spreads in Canada and the U.S.
In Canada, spreads opened the quarter at 180bps enroute to a peak of 194bps in early November before eventually settling at 183bps. The U.S. continued to navigate a rockier course, climbing to a 2022 wide of 172bps and then ultimately tightening back to a year-end close of 141bps.
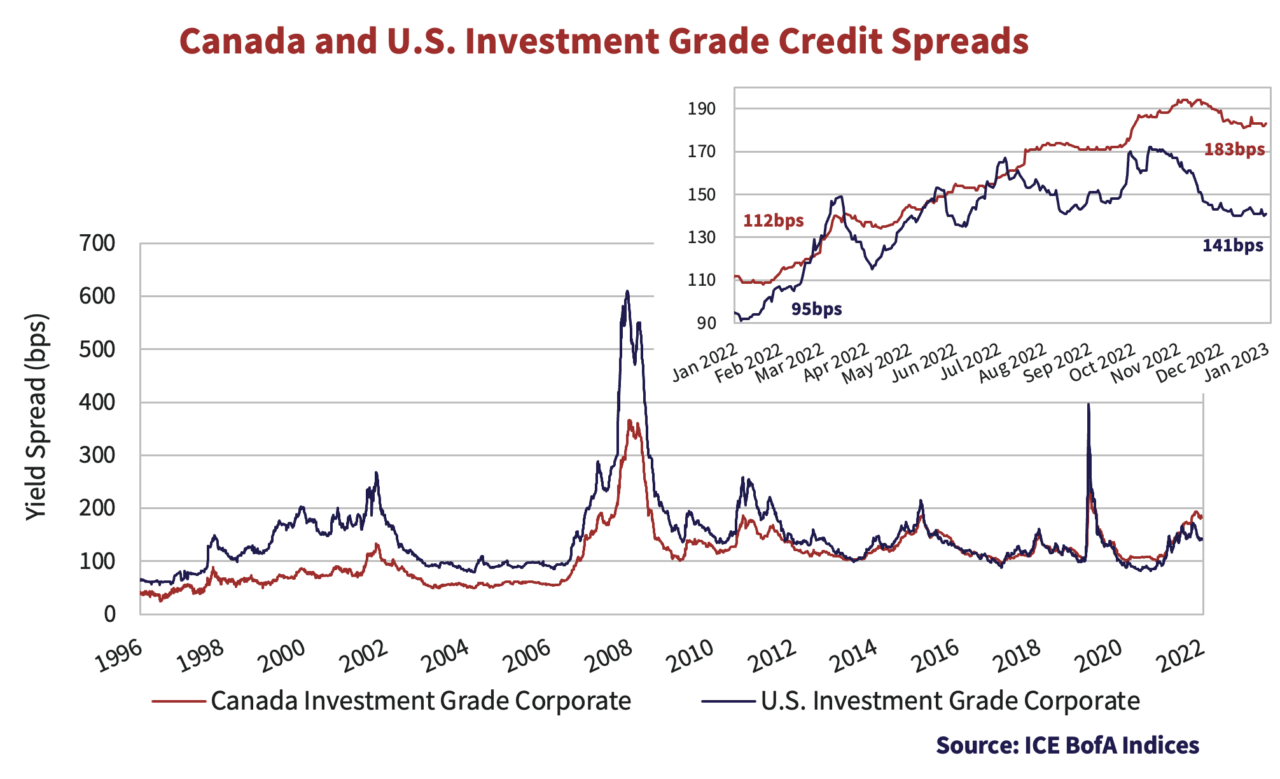
Risk premiums for investment grade bonds in Canada and the U.S. look much more compelling today than they did to start the year. Despite the move higher, credit spreads in the U.S. remain just inside the long-term average of 147bps. On the other hand, Canadian credit spreads diverged from the U.S. during the summer and at 183bps look like reasonable value. From the graph above, we can observe that Canadian investment grade spreads are hovering around the wide spreads of 2011 and 2016 and behind only 2008 and 2020.
On the surface, spreads in Canada appear to reflect weakening fundamentals and are pointing towards recession. However, we believe large scale redemptions in fixed income funds, many of which are overweight corporate bonds, has pressured credit spreads wider. In addition, Canadian banks more than doubled their new issuance volume in 2022 versus the prior 2 years to a staggering $62 billion. This persistent supply from primary market activity, whose new issue pricing is done at concessions, has marched spreads wider.
Still Standing
Additionally, a deterioration in credit fundamentals doesn’t appear to be reflected in the pricing of Canadian investment grade bonds. The credit spread on lower quality BBB bonds has not widened materially relative to higher quality A rated bonds. Below we have plotted the difference between BBB and A rated credit spreads derived from the FTSE Canada indices, which notably doesn’t include Limited Recourse Capital Notes, unlike other Canadian bond indices. The graph illustrates a persistent curve that is below average and below the prior cycle peaks.
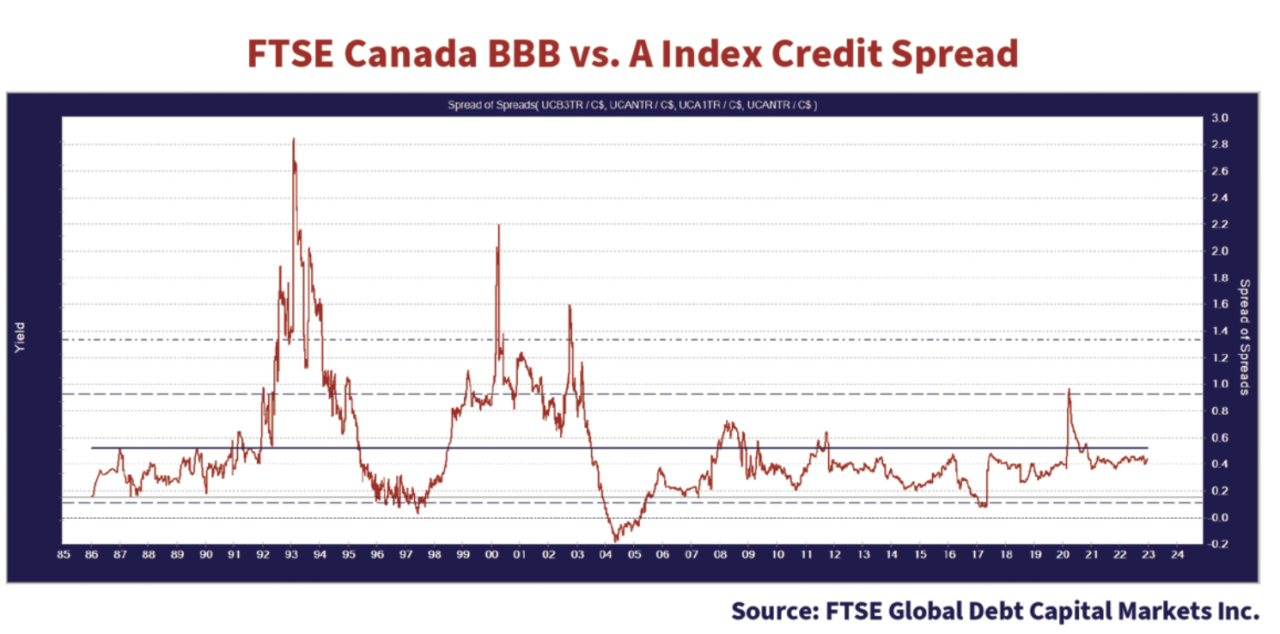
Long term corporate bonds across both A and BBB rated issuers have been relatively strong performers and have supported this trend. Demand for long term corporate bond issues has been driven by liability driven investors buying higher yields and limited new issue supply.
Know When to Hold, Know When to Fold
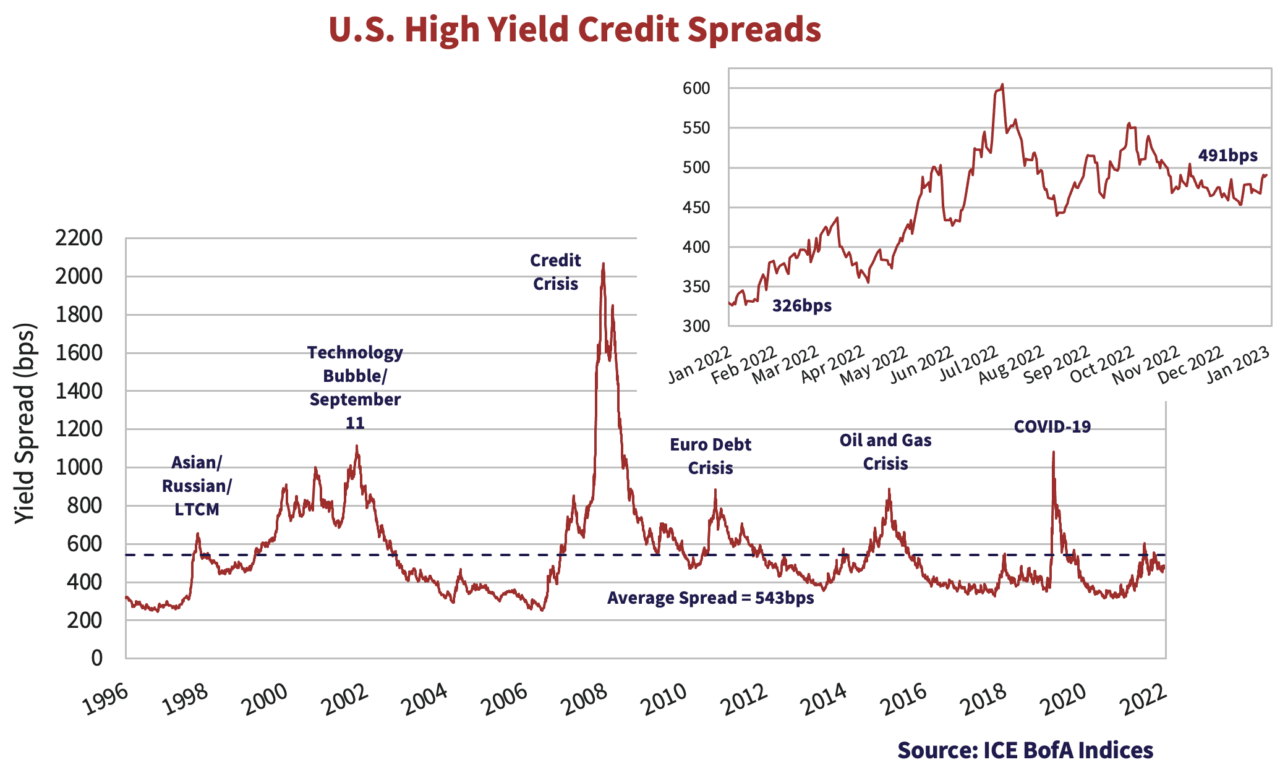
Credit spreads in the U.S. high yield market remain modest relative to other periods of credit stress. The graph below plots the credit spreads of the ICE BofA U.S. High Yield Index. Spreads were tighter in the fourth quarter and at 491bps to finish the year, are 52bps inside of their historic average.
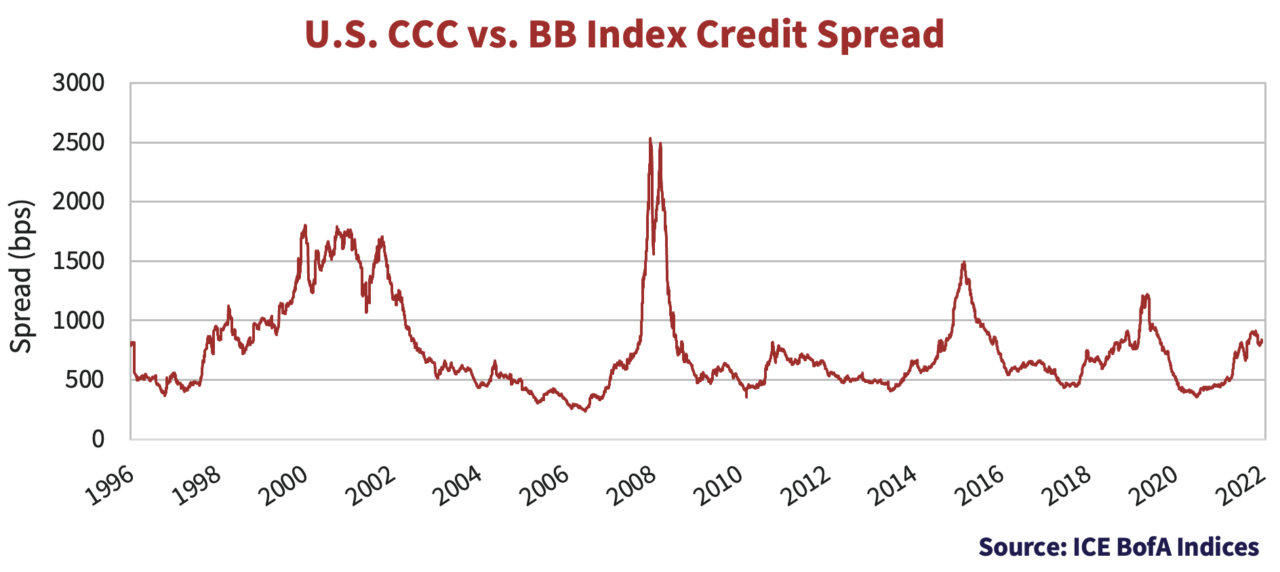
Looking down the credit curve, weakening fundamentals are becoming more evident in the valuations of the most speculative issuers. The graph below plots the difference between lower quality CCC against higher quality BB issuers. During the year, CCC spreads widened 469bps whereas BB spreads widened only 89bps. The basis shows investors disproportionately fleeing the uncertainty of the riskiest assets. The preference for quality resulted in an “equity-like” -16.3% loss for the CCC & Lower segment of the ICE BofA U.S. High Yield Index this year, giving back all of the positive 2020 performance, and then some.
Hungover and Hard Up
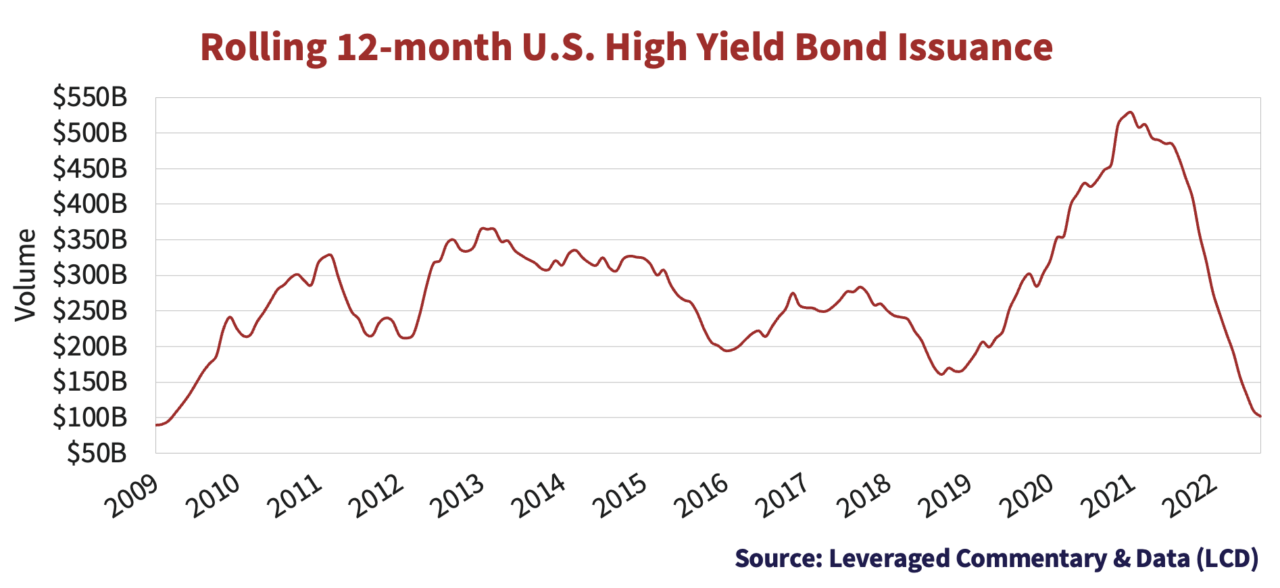
The easy money pandemic binge to “get invested” and buy anything with yield has been replaced by a morning after hangover for high yield investors. Issuance is well down and outflows from high yield funds have dropped demand. JP Morgan tallied total high yield bond issuance this year of U.S. $106.5 billion, U.S. $56.1 billion ex-refinancing, which was down 78% and 71% over the previous two years. The graph below of rolling high yield bond issuance from LCD illustrates the magnitude of the fall. Issuance levels have fallen to the lowest levels since the 2008 Credit Crisis and quite a drop from the record setting totals in 2021.
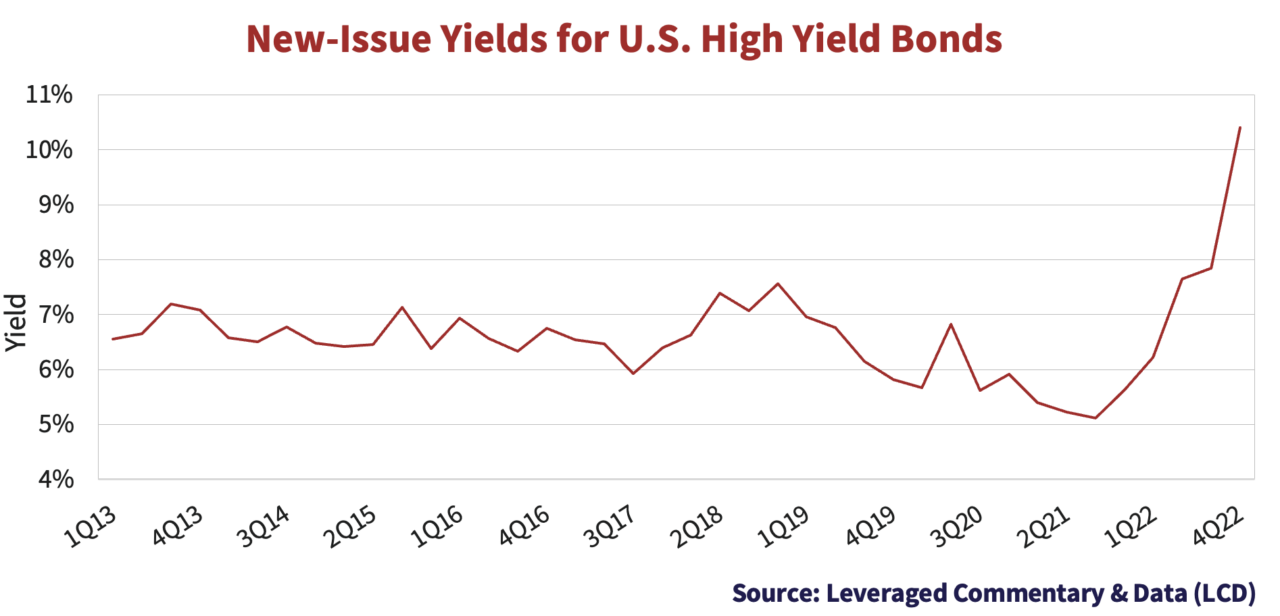
The issuers who have placed bonds through the primary market have paid much higher yields to get financing. The graph below plots new issue yields for U.S. high yield bonds over the past decade. The fourth quarter of 2022 saw double-digit new issue yields, which is 2 times the lows of 2021.
Up Around The Bend
Despite the sharp rise in borrowing costs, tighter markets and an uncertain outlook, default activity continued to be muted. The high yield market has not seen a new default over the last five months. For the year, JP Morgan lists 17 defaults and a further 18 companies completing distressed exchanges. While these numbers are up compared to 2021, default rates have not yet materially followed credit spread widening. The reverberations of the elevated default rates in 2020 combined with accommodative markets and record levels of issuance in 2021 continue to be supportive of low default activity. Investors should not rest on these laurels as more and more companies will be forced to reckon with the reality of the current market environment.
We’re Still Running
As the years roll slowly past it is important to reflect on where we come from and who we are. In October, we did just that, celebrating Canso’s 25th anniversary.
The characteristics that built Canso: reliability, stability, performance, will continue to guide us in the years ahead. Above all, our clients come first. We will avoid doing what’s fashionable in favour of doing what’s right. We have strength in numbers and will lean on our team-based approach to perform deep fundamental security analysis. If we are compensated for risk, we will take the risk, but if we are not, we are happy to catch the next bus, and there is always a next bus.
We thank all of those who have contributed to our success over the past 25 years. We look forward to the years ahead.