

Duration Rally!
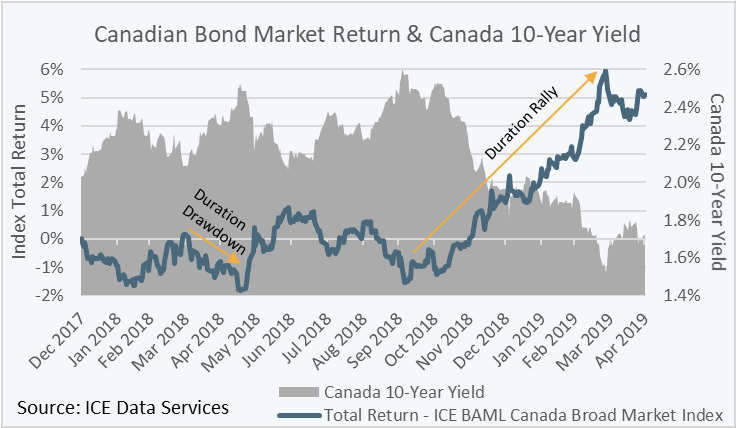
Canadian interest rates have been on a rollercoaster ride over the past 16-months. After moving higher for much of 2018 and peaking on October 5th, 2018, the Canada 10-year yield plummeted over the following 6-months, reaching a low on March 27th, 2019. The precipitous decline in interest rates fueled a significant rally in bond prices, especially those with longer durations. The magnitude of the “duration rally” is captured by the performance of the ICE BAML Canada Broad Market Index, which as of October 5th, 2018, had a duration of 7.6 years, and produced a total return of 7.6% over the period October 8th, 2018, to March 27th, 2019 (see the chart below). The concept of recency bias tells us that investors have a natural preference to investments that have been “working” (such as the bond index given its recent performance) to those that have not, so it is no surprise that some investors are now saying they’ve got to have more duration in their bond portfolios. However, it is important for investors to remember that duration can be a double-edge-sword for bond returns, and when interest rates fall, new issue bonds typically offer lower coupon rates, which increases the risk of principal erosion should interest rates rise.
Practically Speaking…
Bond prices and interest rates have an inverse relationship: as interest rates increase, bond prices fall, and vice versa. Duration is how long it takes, in years, for an investor to be repaid the bond’s price by its total future cash flows. All else remaining equal, bonds with longer term-to-maturity and smaller coupon rates have higher durations. Furthermore, duration represents the sensitivity of a bond’s price to changes in interest rates: the higher the duration, the greater the price sensitivity to changes in interest rates. In other words, the impact of a change in interest rates would be more pronounced on the price of a bond with longer duration. “Duration risk” is the risk associated with such sensitivity.
Important! Watch your Coupon Cushion
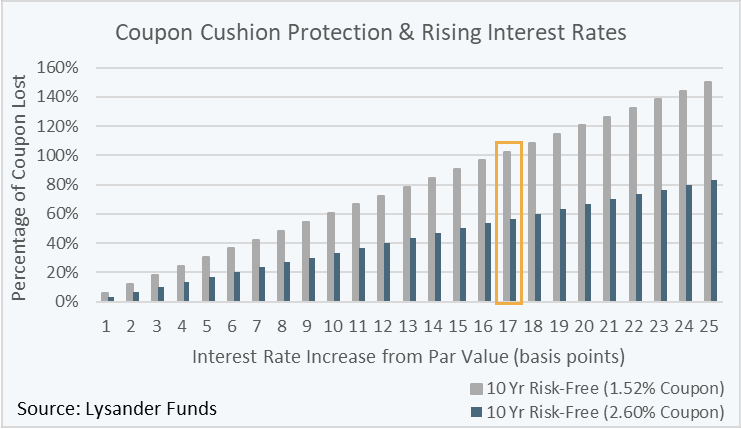
One way to think about duration and duration risk is to look at a bond’s coupon cushion, that is, the extent to which the income from a bond’s coupon can absorb principal loss as a result of rising interest rates. The chart below shows the impact rising interest rates has on 10-year risk-free bonds at coupon rates of 2.60% and 1.52%, which were the corresponding yields of the Canada 10-year as of October 5th, 2018, and March 27th, 2019, respectively. The bars indicate the amount of principal loss that would occur from incremental interest increases, stated as a percentage of the annual coupon rate (the coupon cushion!). For the 1.52% coupon bond, which would amount to $15.20 of annual coupon income on a $1,000 face value bond, it would take a mere 17 basis point interest rate increase to incur principal loss greater than the $15.20 of annual coupon income. For the 2.60% coupon bond, $26.00 of annual coupon income at $1,000 of face value, the same 17 basis point interest rate increase would result in principal loss of only 57% the $26.00 annual coupon rate ($14.82). The key takeaways are for two bonds with equal term-to-maturity, the bond with the higher coupon (cushion) better protects investors’ returns against rising interest rates; and for bonds issued with low coupon rates, comparable to the present low level of interest rates, it would take a paltry interest rate increase for those bonds to incur a negative total return.
What You Are Not Seeing is an Evolving Bond Market Risk
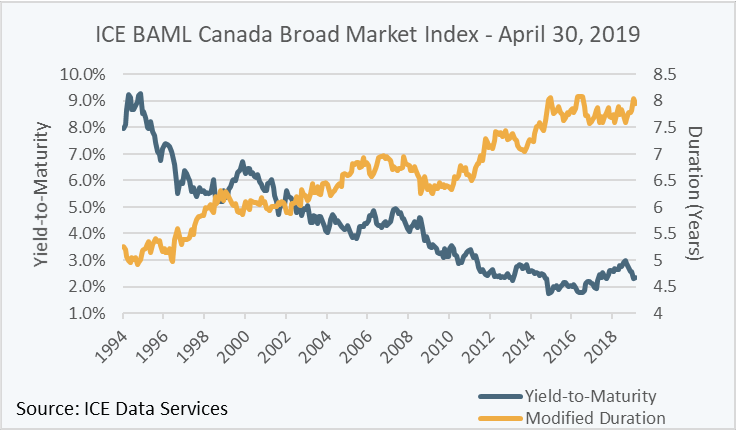
Smaller coupon cushions have been an evolving theme in the Canadian bond market over time, as illustrated in the chart below. The chart shows the yield-to-maturity and duration characteristics of the ICE BAML Canada Broad Market Index over the past 25-years, where the yield of the Index has been steadily falling and its duration has been steadily rising – in other words, Canadian bond market risk has been increasing with respect to both smaller coupon cushion and higher duration! At different times over the past 25-years there was a 1-to-1 relationship between the yield and duration of the Index, which means there was enough coupon cushion to protect a bondholder’s principal against a 100 basis point increase in interest rates. Today, the yield of the Index is about one quarter of its duration, which could help explain how over the 34-day period ending May 17th, 2018, the total return of the Index declined by 2.0% after a corresponding 44 basis point increase in the 10-year Canada yield (see the chart on page 1).
This is When Experience Pays
With general bond market yields falling and durations rising, investors should consider the level of coupon cushion in their bond portfolios, or, the amount of yield they are getting for the duration risk they are taking. Do you know the amount of coupon cushion in your bond portfolio? Solutions to combating small coupon cushions include reducing the term-to-maturity and increasing the yield of a bond portfolio. However, each of these options come with their own trade-offs: reducing term typically results in less yield and increasing yield typically reduces credit quality. Navigating this risky environment can be tricky, and now more than ever investors could benefit from the counsel of a professional investment advisor or a fixed income portfolio manager who has the expertise to increase the coupon cushion of a bond portfolio while mitigating trade-off risks such as credit risk and duration risk.
Important Disclaimers
This publication is for information only and is not an invitation to invest in any investment fund. This document does not constitute a public offering of sale of any securities or derivatives. Nothing in this document is intended to constitute legal, tax, securities or investment advice, nor an opinion regarding the appropriateness of any investment, nor a solicitation of any type. This document is made available on an “as is” basis. Lysander Funds Limited does not make any warranty or representation regarding the information contained herein, and this document must not be relied on in making an investment decision. Lysander Funds Limited will not be responsible for any type of loss incurred by applying any of the information presented. Nothing in this document should be considered a recommendation to buy, sell or short a particular security or derivative. The information in this document is subject to change without notice. Lysander Funds Limited does not assume any duty to update any of the information.
Any unauthorized use or disclosure of information in this document is prohibited. Nothing herein should in any way be deemed to alter the legal rights and obligations contained in agreements between any ICE Data Services entity (“ICE”) and their clients relating to any of the Indices or products or services described herein. The information provided by ICE and contained herein is subject to change without notice and does not constitute any form of representation or undertaking. ICE and its affiliates make no warranties whatsoever either express or implied as to merchantability fitness for a particular purpose or any other matter in connection with the information provided. Without limiting the foregoing ICE and its affiliates makes no representation or warranty that any information provided hereunder are complete or free from errors omissions or defects. All information provided by ICE is owned by or licensed to ICE. ICE retains exclusive ownership of the ICE Indices including the ICE BofAML Indexes and the analytics used to create this analysis ICE may in its absolute discretion and without prior notice revise or terminate the ICE information Indices and analytics at any time. The information in this analysis is for internal use only and redistribution of this information to third parties is expressly prohibited.
The information and calculations contained in this analysis have been obtained from a variety of sources including those other than ICE and ICE does not guarantee their accuracy. Prior to relying on any ICE information and/or the execution of a security trade based upon such ICE information you are advised to consult with your broker or other financial representative to verify pricing information. There is no assurance that hypothetical results will be equal to actual performance under any market conditions. THE ICE INFORMATION IS PROVIDED TO THE USERS “AS IS.” NEITHER ICE NOR ITS AFFILIATES NOR ANY THIRD-PARTY DATA PROVIDER WILL BE LIABLE TO ANY USER OR ANYONE ELSE FOR ANY INTERRUPTION INACCURACY ERROR OR OMISSION REGARDLESS OF CAUSE IN THE ICE INFORMATION OR FOR ANY DAMAGES RESULTING THEREFROM. In no event shall ICE or any of its affiliate’s employees’ officers’ directors or agents of any such persons have any liability to any person or entity relating to or arising out of this information analysis or the indices contained herein.