U.S equity markets performed strongly in the second quarter and one year ended June 30th, 2024. The S&P 500 Index (CAD) returned 5.33%1. However, the S&P/TSX Index posted a disappointing -0.53%2 for the quarter. The one year returns as of June 30, 2024 were 28.76%1 and 12.12%3 for the S&P 500 Index (CAD) and S&P/TSX Index, respectively. The Canadian market has lagged the U.S. market for the past several quarters due to a lack of exposure to large capitalization technology companies that will benefit from artificial intelligence (AI) products and services. The S&P 500 equity returns are substantially above long-term average returns and, in our view, unsustainable.
Investor enthusiasm for AI continued to fuel the broader stock market rally throughout the second quarter of 2024. The S&P 500 Index closed at new highs several times throughout the second quarter. The index’s return was driven by a small number of stocks. Nvidia alone accounted for nearly one-third of the S&P 500’s total return in the first half. Including Microsoft, Amazon, Meta Platforms and Eli Lilly, 55% of the market’s return came from those five companies. The stock market in the U.S continues to be highly concentrated. The three largest stocks in the S&P 500 Index —Microsoft, Apple and Nvidia — made up approximately 21% of its total market value. The five largest stocks accounted for 27%, and the top ten amounted to more than 36% of the total.
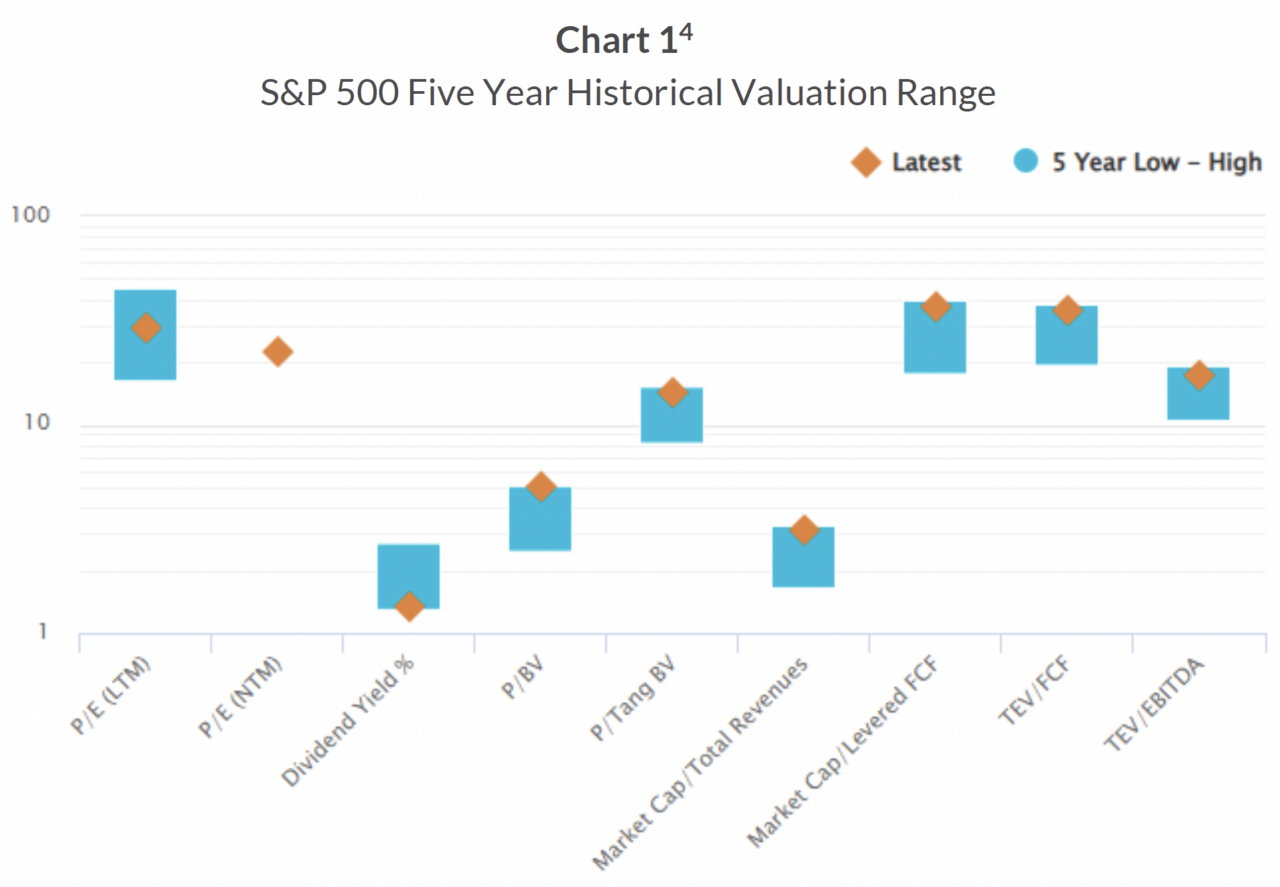
Equity markets continue to be expensive. As the chart below illustrates, virtually all valuation measures are at the very upper end of their five-year ranges, and the dividend yield is at the lowest end of its range. We believe that the potential for the permanent loss of capital is quite high for broad equity market indices in light of these metrics.

The U.S. economy demonstrated resilience and continued to perform well in the second quarter of 2024, despite facing challenges such as high inflation and geopolitical risks. Real GDP and investment remained robust as consumer spending, investment, and government spending all showed healthy growth. Inflation fell slightly below 3% in 2024. However, this level of inflation is still above the Federal Reserves target rate and, combined with solid economic fundamentals, has led to the view that interest rates will stay “higher for longer” than anticipated at the start of the year.
During the second quarter of 2024, reports indicated that the Canadian economy expanded less than expected. Gross domestic product in the first quarter expanded at a 1.7% annualized pace. This growth was slower than the median estimate of 2.2% and the Bank of Canada’s forecast of 2.8%. Adding to the concern, fourth quarter 2023 growth was revised downward to 0.1% from 1%. On a positive note, inflation has fallen from its June 2022 peak of 8.1% to 2.9% in May 2024. The weak economic growth combined with falling inflation spurred the Bank of Canada to reduce interest rates by twenty-five basis points in early June.
During the second quarter, Lysander-Patient Capital Equity Fund (“Fund”) increased its positions in BCE Inc., Bank of Montreal, Bank of Nova Scotia, CIBC, Canadian Utilities, Firm Capital Property Trust, TD Bank and Verizon.
During the second quarter of 2024, the Fund sold its holdings in WPP plc. and Royal Bank. After a detailed review and discussions with management, we determined that evolving industry dynamics and competitive pressures reduced WPP’s estimated intrinsic value. The investment in the Royal Bank was sold as the share price reached our target sell price.
The Fund continues to be well positioned for current market conditions. As of June 30th, 2024, the Fund’s total portfolio yield was 5.7%. In addition, the portfolio’s overall characteristics compare favorably to major benchmarks such as the S&P 500 and S&P/TSX Composite. In addition, the Fund continued to be underrepresented in the high performing technology sector. We are confident that the Fund’s value-based investment philosophy will stand up well as interest rates “stay higher for longer” and valuations return to long term averages.
- Source: S&P.
- Source: S&P/TSX.
- Source: S&P/TSX.
- Source: Capital IQ
