Now is Not a Bad Time to Own Bonds, Although it May Be a Bad Time to Own Conventional Bond Strategies

The Times Are a Changing

The first quarter of 2021 was a wake-up call for bond investors. Fuelled by speculation of a post-COVID economic boom and soaring inflation expectations, interest rates1 jumped and led to a quarterly loss not seen in the ICE BofAML Canada Broad Market Index (“Canada BM Index” or “the Index”) in over 25-years.

As illustrated in Chart 1, Q1 2021 produced a return of -5.3% (for those fans of extrapolation, that is an annualized loss of 19.7%), which was the largest quarterly loss for the Canada BM Index on a total return basis since its inception in June 1992. What is remarkable is not just the magnitude of the quarterly loss, but that it was also achieved off a change in yield-to-maturity (“yield”) of only +0.53%2. For context, Q1 1994 and Q2 1994 (Chart 1, annotated in light blue) were the only other calendar quarters when the Canada BM Index produced losses greater than 4.0%, however those losses were accompanied by increases in yield that were at least 2.5x greater than the increase in yield experienced in Q1 2021.

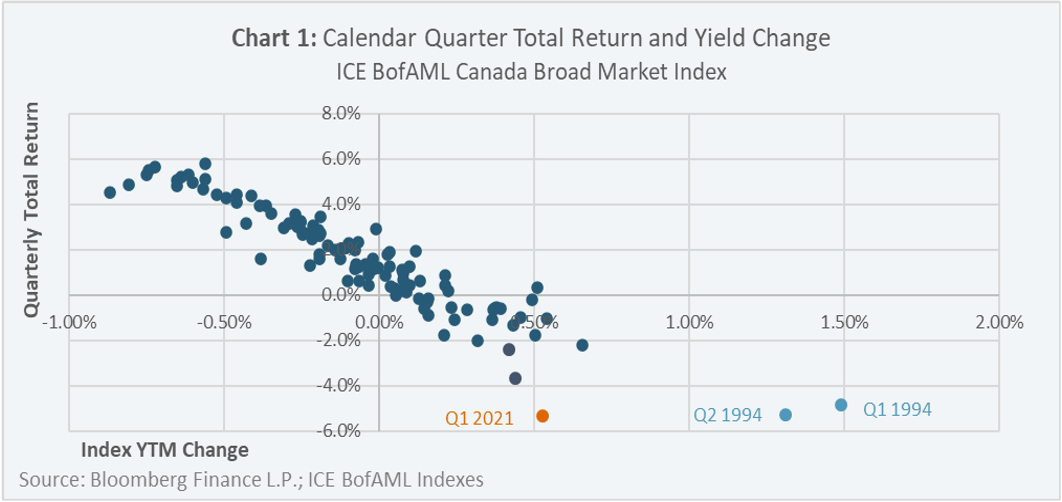
Investors may very well be confused, after all bonds are supposed to be safe, especially bonds with high credit qualities such as those included in the Canada BM Index. Furthermore, it is not as though rising yields are a new phenomenon. Referring back to Chart 1, since the inception of the Canada BM Index, out of 46 calendar quarters when the yield of the Index had risen, over half of those quarters (26) generated positive total returns – why was Q1 2021 so different?

The Growing Risks in High-Quality Bonds

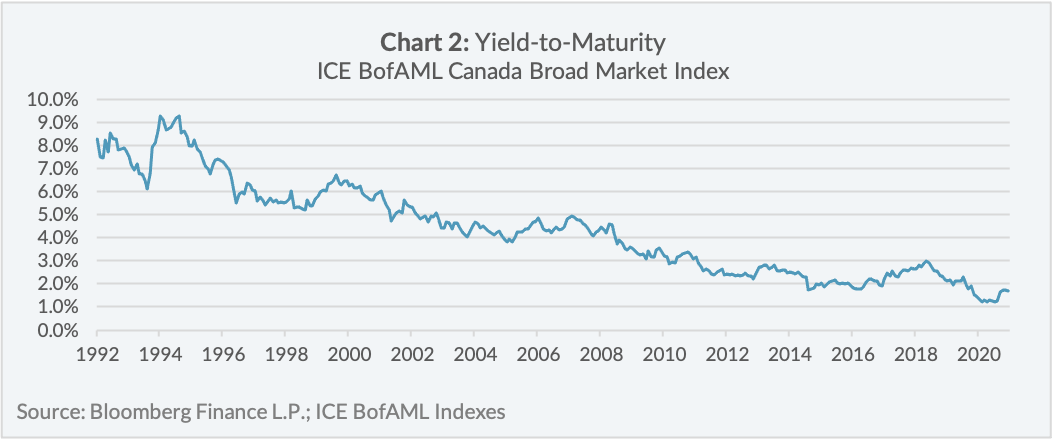
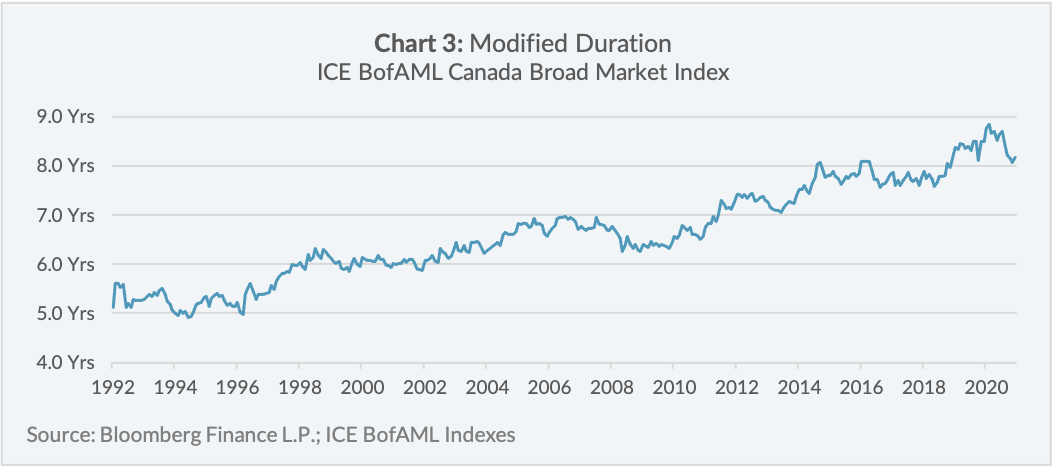
As illustrated in Chart 2 and Chart 3, over the past 27-years there has been a gradual transition in the yield-to-maturity3 and modified duration4 (“duration”) characteristics of the Canada BM Index. These shifts have had meaningful impacts on the ability of the Index to preserve investors’ capital during periods of rising interest rates.

Consider the different outcomes available from investing in the Canada BM Index over time. On June 30, 1994, an investor would have achieved a yield of 9.3% while assuming a duration of 5.0 years, whereas on May 31, 2021, the yield achieved was only 1.7% while assuming a duration of 8.2 years. Simply put, where the Canada BM Index once offered investors ample yield for assuming a relatively low level of duration, the Index now offers investors near record-low yield for assuming near record-high levels of duration.

“Double or Nothing”

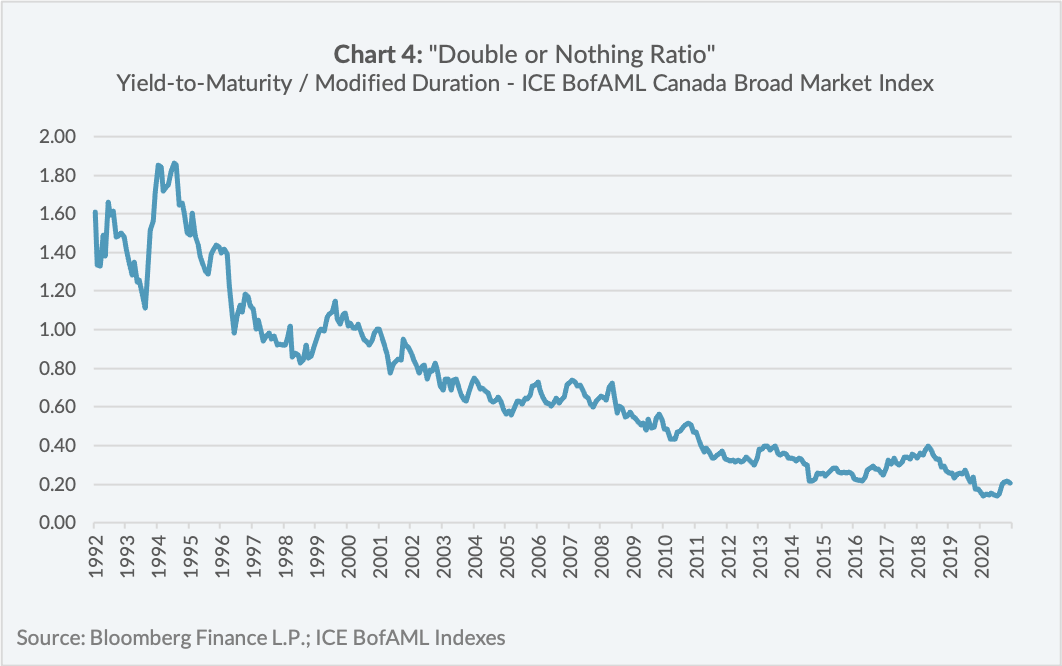
A helpful metric that can be used to assess the ability of the Canada BM Index to protect investors’ capital from rising interest rates is calculated by dividing yield-to-maturity by duration and is illustrated in Chart 4. This metric is commonly referred to as the “Sherman Ratio”; however, perhaps a more fitting title is the “double or nothing ratio” – that is because the ratio (when expressed as a percentage) describes the approximate amount of interest rate change (up or down) that would either double the return an investor would expect to earn from a bond’s yield-to-maturity or wipe it out entirely.

For example, the double or nothing ratio for the Canada BM Index was 1.85 on June 30, 1994, which means interest rates would have had to rise by approximately 1.85% for the Index to experience a capital loss large enough to offset its initial yield of 9.3% – at which point an investor’s return would be “nothing”. On May 31, 2021, the double or nothing ratio was 0.21, which means interest rates would have to increase only by 0.21% before investors would start experiencing losses on a total return basis.

Do Your Bonds have High-Quality Yield?

With these risks in mind, it comes as no surprise that there is growing consternation over bonds amongst investors, or that Warren Buffett recently warned against owning bonds in his annual letter to shareholders, or that there are ongoing debates over the effectiveness of the 60/40 asset allocation.

At Lysander Funds, it is our contention that bonds still play a vital role in investment portfolios as risk diversifying instruments. However, for investors who value short-term capital preservation they may need to reframe their expectations of what bond characteristics might best achieve that objective going forward, and it may not necessarily be the bonds with the highest credit quality.

In an environment of low yields and the spectre of rising interest rates looming over the markets, investors may experience better capital preservation by owning bonds with higher-quality yield – that is, bonds with greater double or nothing ratios (higher yield, lower duration, or both!).

Bond Solutions at Lysander Funds

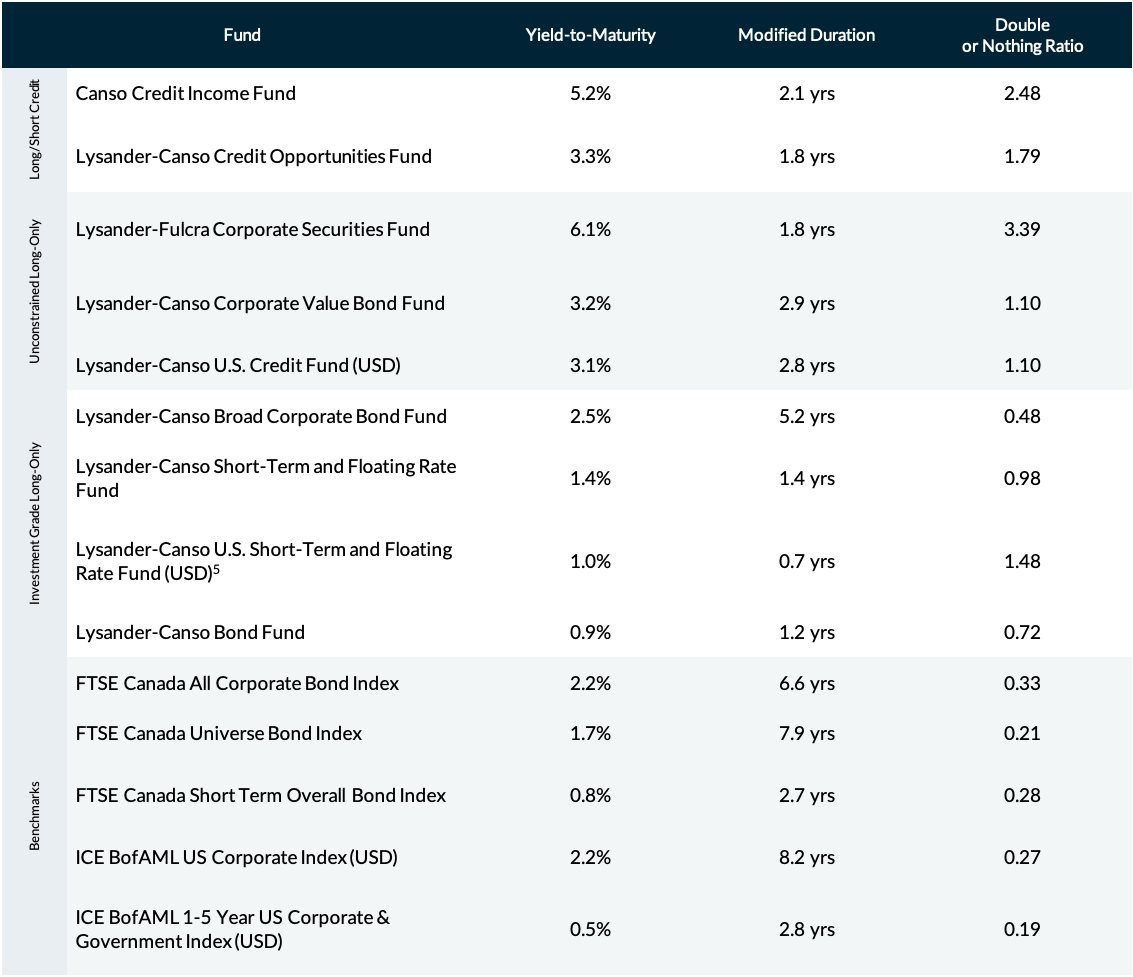
Lysander Funds offers a suite of bond funds to investment professionals to match the different return and risk objectives of their clients. Our two portfolio managers in the bond arena, Canso Investment Counsel Ltd. and Fulcra Asset Management Inc., both apply bottom-up (or company-first) approaches towards portfolio construction, which generally tend to produce overall portfolio characteristics with higher-quality yields than their benchmarks. As of May 31, 2021, the yield-to-maturity, duration and double or nothing ratios of the bond funds offered by Lysander Funds are noted in Table 1 below:

Table 1: Lysander Bond Funds Characteristics

1 “Interest rates” in this paper refers to the risk-free rate.

2 The ICE BofAML Canada Broad Market Index is composed of government bonds and high-quality corporate bonds in Canada. As such, there is a small component of credit spread; however, the greatest component of its yield-to-maturity is attributed to the risk-free rate.

3 Yield-to-maturity is a function of a bond’s coupon and price. It represents the annual return an investor will achieve by holding the bond to maturity, assuming the bond does not default.

4 Modified duration measures the price sensitivity of the bond’s price to changes in the risk-free interest rate. Duration is quoted in “years” and can be interpreted as the percentage price change of a bond for a 1% change in the risk-free rate.

5 The inception date of Lysander-Canso U.S. Short-Term and Floating Rate Fund (USD) was May 12, 2021.

This document has been prepared by Lysander Funds Limited (“Lysander”) solely for information purposes. Information in this document has been derived or obtained from sources believed to be trustworthy and/or reliable. Lysander does not assume responsibility for the accuracy, currency, reliability or correctness of any such information. Nothing in this document should be considered a recommendation to buy, sell or short a particular security. Information in this presentation is not intended to constitute legal, tax, securities or investment advice and is made available on an "as is" basis. Lysander does not make any warranty or representation regarding the information herein. Information in this document is subject to change without notice. Lysander does not assume any duty to update any information herein.

Lysander is the investment fund manager (“IFM”) of the funds shown in this document (each, a “Fund” and collectively, the “Funds”). Canso Investment Counsel Ltd. (“Canso”) is the portfolio manager (“PM”) of all the Funds other than Lysander-Fulcra Corporate Securities Fund. Fulcra Asset Management Inc. is the PM of Lysander-Fulcra Corporate Securities Fund.

This document is not an invitation to invest in any Fund and does not constitute a public offering of sale. Purchases in the Funds can only be made through an Investment Professional on the terms in the applicable Fund’s offering document by eligible investors.

Lysander-Canso Credit Opportunities Fund is an alternative mutual fund. It has the ability to invest in asset classes or use investment strategies that are not permitted for other types of mutual funds. The specific strategies that differentiate this Fund from other types of mutual funds include: increased use of derivatives for non-hedging purposes; increased ability to sell securities short; and the ability to borrow cash to use for investment purposes. While these strategies will be used in accordance with the Fund’s investment objectives and strategies, during certain market conditions they may accelerate the pace at which your investment decreases in value.

Commissions, trailing commissions, management fees and expenses all may be associated with mutual fund investments. Please read the prospectus before investing. Investment funds are not guaranteed, their values change frequently and past performance may not be repeated.
You will usually pay brokerage fees to your dealer if you purchase or sell units of Canso Credit Income Fund (“CCIF”) on the Toronto Stock Exchange (TSX). Only Class A units of CCIF are listed on the TSX. If the units are purchased or sold on the TSX, investors may pay more than the current net asset value when buying units of CCIF and may receive less than the current net asset value when selling them. There are ongoing fees and expenses associated with owning units of CCIF. CCIF must prepare disclosure documents that contain key information about the fund. You can find more detailed information about CCIF in these documents.

This document may contain forward-looking statements. Statements concerning a fund’s or entity’s objectives, goals, strategies, intentions, plans, beliefs, expectations and estimates, and the business, operations, financial performance and condition are forward looking statements. The words “believe”, “expect”, “anticipate”, “estimate”, “intend”, “aims”, “may”, “will”, “would” and similar expressions and the negative of such expressions are intended to identify forward-looking statements, although not all forward-looking statements contain these identifying words. These forward- looking statements are subject to various risks and uncertainties that could cause actual results to differ materially from current expectations. Readers are cautioned not to place undue reliance on these forward-looking statements. While Lysander considers these risks and uncertainties to be reasonable based on information currently available, they may prove to be incorrect.

The source of all ICE BofAML Indices is ICE BofAML Indexes. Any unauthorized use or disclosure is prohibited. Nothing herein should in any way be deemed to alter the legal rights and obligations contained in agreements between any ICE Data Services entity ("ICE") and their clients relating to any of the Indices or products or services described herein. The information provided by ICE and contained herein is subject to change without notice and does not constitute any form of representation or undertaking. ICE and its affiliates make no warranties whatsoever either express or implied as to merchantability fitness for a particular purpose or any other matter in connection with the information provided. Without limiting the foregoing ICE and its affiliates makes no representation or warranty that any information provided hereunder are complete or free from errors omissions or defects. All information provided by ICE is owned by or licensed to ICE. ICE retains exclusive ownership of the ICE Indices including the ICE BofAML Indexes and the analytics used to create this analysis ICE may in its absolute discretion and without prior notice revise or terminate the ICE information Indices and analytics at any time. The information in this analysis is for internal use only and redistribution of this information to third parties is expressly prohibited.

Neither the analysis nor the information contained therein constitutes investment advice or an offer or an invitation to make an offer to buy or sell any securities or any options, futures or other derivatives related to such securities. The information and calculations contained in this analysis have been obtained from a variety of sources including those other than ICE and ICE does not guarantee their accuracy. Prior to relying on any ICE information and/or the execution of a security trade based upon such ICE information you are advised to consult with your broker or other financial representative to verify pricing information. There is no assurance that hypothetical results will be equal to actual performance under any market conditions. THE ICE INFORMATION IS PROVIDED TO THE USERS "AS IS.“ NEITHER ICE NOR ITS AFFILIATES NOR ANY THIRD PARTY DATA PROVIDER WILL BE LIABLE TO ANY USER OR ANYONE ELSE FOR ANY INTERRUPTION INACCURACY ERROR OR OMISSION REGARDLESS OF CAUSE IN THE ICE INFORMATION OR FOR ANY DAMAGES RESULTING THEREFROM. In no event shall ICE or any of its affiliates employees officers directors or agents of any such persons have any liability to any person or entity relating to or arising out of this information analysis or the indices contained herein.

®Lysander Funds is a registered trademark of Lysander Funds Limited.