

Top of the Bond Market?
For Canadian bond investors, July 8th, 2016, may draw a parallel to what June 18th, 2008, was for Canadian equity investors – the top of the market. On July 8th, 2016, Government of Canada bond yields troughed, including the 5-year (0.52%)1, 10-year (0.96%), 20-year (1.54%) and 30- year (1.55%). On September 30th, 2018, all these yields were higher; the 5-year had risen by +1.82%, the 10-year by +1.46%, the 20-year by +0.91% and the 30-year by +0.87%.
Different market indicators are showing that Canadian interest rates have the potential to move higher. At the short end of the yield curve, the Bank of Canada sets the overnight policy rate, and as you move out the yield curve, yield levels become based more on market factors such as growth and inflation. The Bank of Canada has signalled that they intend to take a gradual approach to raising short term interest rates, and inflation has recently been reported at one of its highest levels in years.
The Risk: Bonds & Interest Rates
For investors in traditional fixed coupon bonds, rising interest rates are generally a bad thing because as interest rates rise those bond prices tend to fall and can lead to capital loss for investors. The effect of rising interest rates is particularly acute for passive bond investors investing in bond indices, especially those with higher durations. Duration is the measure of bond price sensitivity to changes in interest rates; a higher duration indicates a higher bond price sensitivity to changes in interest rates.
To illustrate this concept, consider an investment in the ICE BAML Canada Broad Market Index, which has a duration of over 7 years. As shown in Chart 1, an investment in the index on July 8th, 2016, would have produced a cumulative total return of -1.6% by September 30th, 2018, while experiencing a maximum drawdown (the peak-to-trough decline over a specific period) of almost 5%!
Chart 1 – ICE BAML Canada Broad Market Index Total Return – Rising Interest Rates
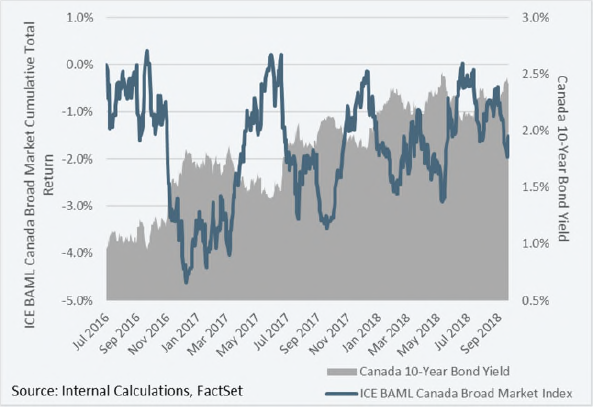
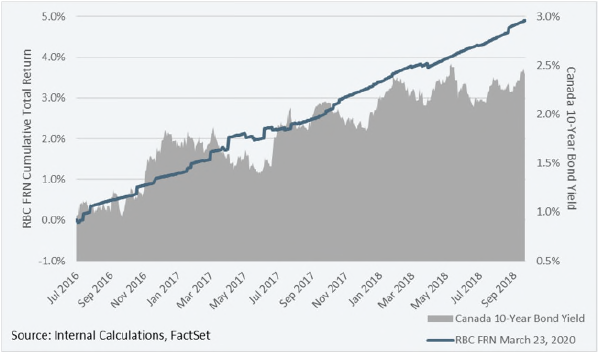
Chart 2 – Royal Bank of Canada FRN Total Return – Rising Interest Rates
Floating Rate Notes
So how can a bond investor position their portfolio to reduce the price volatility associated with changes in interest rates other than investing in T-Bills? A possible solution is the floating rate note (“FRN”). FRNs are bonds whose coupon payments adjust (typically every quarter) to changes in interest rates through a reference rate. In Canada the reference rate is the Canadian Dealer Offered Rate (“CDOR”), which is an average of 3-Month Bankers’ Acceptance. In July 2016, CDOR was 0.83%, and by September 30th, 2018, it had risen to 1.94%, an increase of +1.11%.
Because of the coupon adjusting mechanism in FRNs, their face values do not typically deviate much based on changes in interest rates; rather, their face values deviate more based on the market perception of their credit quality. The implication for investors is that investment grade FRNs (with less credit risk) tend to trade close to their par values throughout their term.
To illustrate, one example of an FRN is the Royal Bank of Canada FRN covered bond, which has a AAA credit rating and coupon of CDOR plus 36bps, implying an all-in yield of 2.30% as of September 30th, 2018. Chart 2 shows the period, July 8th, 2016, to September 30th, 2018, where the RBC FRN produced a cumulative total return of +4.9%, while experiencing a maximum drawdown of only 0.2%!2
Caveat Emptor: All FRNs are not Created Equal!
In seeking protection from interest rate risk, bond investors should not ignore credit risk. Similar to fixed rate bonds, the credit quality of FRNs can vary between investment grade and sub-investment grade. A common sub-investment grade FRN structure is known as a leveraged loan, or a bank loan. As FRNs have attracted more investor capital looking to reduce price volatility from interest rates, leveraged loans have in turn attracted investor capital because of their higher yields compared to investment grade FRNs.
Leveraged loans are corporate loans from banks that have been securitized and sold to investors; it is a way for banks to offload the risk of the loan from their balance sheets and collect securitization fees in the process. They are typically rated as sub-investment grade because the loans are issued by companies not in the healthiest of financial conditions, and generally don’t have other means of financing. They are also usually “senior secured” in a firm’s capital structure, which gives a general impression to investors that they are lower risk; however, leveraged loans are not low risk investments. This is especially important for investors in mutual funds with exposure to FRNs to consider because the names of many mutual funds generally give little upfront indication to whether the primary exposure of the fund is in investment grade FRNs or leveraged loans.
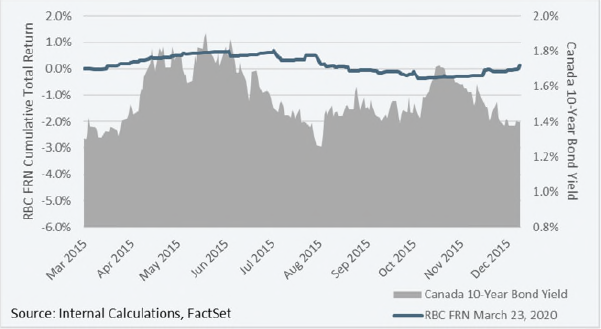
Chart 3 shows the performance of the S&P/LSTA U.S. Leveraged Loan 100 Index in 2015, which was a challenging year for risk assets, including equities and corporate bonds. In 2015, even with interest rates relatively neutral, the leveraged loan index experienced a drawdown of 6.1%; furthermore, in 2008, the index returned -28.2%. By comparison, as shown in Chart 4, in 2015, the RBC FRN experienced a drawdown of only 1.1%3
Chart 3 – S&P/LSTA U.S. Leveraged Loan 100 Index Total Return – 2015
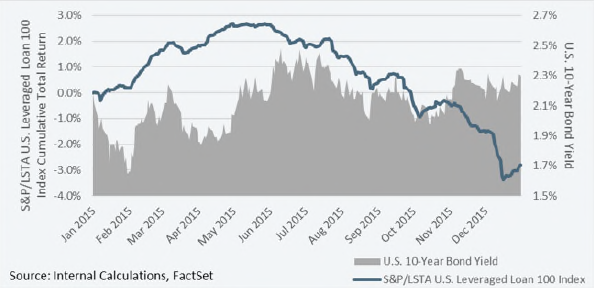
Chart 4 – Royal Bank of Canada FRN Total Return – 2015
The Bottom Line for Investors
As interest rates rise, traditional bond investments with longer durations, such as passive bond indices, will likely decrease in value. FRNs can potentially help mitigate this volatility, although it is imperative for investors to know what they are buying. Leveraged loans may mitigate interest rate risk, although investors may also generally assume above average credit risk that can increase the risk of capital loss in a market dislocation. Investment grade FRNs, on the other hand, can be a key component to mitigate both interest rate risk and credit risk, and reduce the probability of capital loss in a rising interest rate environment.
1 The 5-Year Government of Canada bond yield hit a recent low of 0.48% on February 10, 2016
2 This is for illustrative purposes only looking at the FRN over a two-year period to explain current conditions; under different environments, the behaviour of the instrument can be materially different
3 The RBC FRN was issued on March 23, 2015
Important Disclaimers
This publication is for information only and is not an invitation to invest in any investment fund. This does not constitute a public offering of sale. Commissions, trailing commissions, management fees and expenses are all associated with a mutual fund’s investments and will reduce returns commensurate with their amounts. Refer to a fund’s prospectus before investing. Mutual funds are not guaranteed, their values change frequently and past performance may not be repeated. You will usually pay brokerage fees to your dealer if you purchase or sell units of an investment fund on the Toronto Stock Exchange (“TSX”). If the units are purchased or sold on the TSX, investors may pay more than the current net asset value when buying units of the investment fund and may receive less than the current net asset value when selling them. This publication contains forward-looking statements. Statements concerning a fund’s objectives, goals, strategies, intentions, plans, beliefs, expectations and estimates, and the business, operations, financial performance and condition of the fund are forward-looking statements. The words “believe”, “expect”, “anticipate”, “estimate”, “intend”, “may”, “will”, “would” and similar expressions and the negative of such expressions are intended to identify forward-looking statements, although not all forward-looking statements contain these identifying words. These forward-looking statements are subject to important risks and uncertainties that could cause actual results to differ materially from current expectations. While Lysander Funds Limited (“Lysander”) considers these risks and uncertainties to be reasonable based on information currently available, they may prove to be incorrect. The information in this document is subject to change without notice. Lysander does not assume any duty to update any of the information.
Any unauthorized use or disclosure of information in this document is prohibited. Nothing herein should in any way be deemed to alter the legal rights and obligations contained in agreements between any ICE Data Services entity (“ICE”) and their clients relating to any of the Indices or products or services described herein. The information provided by ICE and contained herein is subject to change without notice and does not constitute any form of representation or undertaking. ICE and its affiliates make no warranties whatsoever either express or implied as to merchantability fitness for a particular purpose or any other matter in connection with the information provided. Without limiting the foregoing ICE and its affiliates makes no representation or warranty that any information provided hereunder are complete or free from errors omissions or defects. All information provided by ICE is owned by or licensed to ICE. ICE retains exclusive ownership of the ICE Indices including the ICE BofAML Indexes and the analytics used to create this analysis ICE may in its absolute discretion and without prior notice revise or terminate the ICE information Indices and analytics at any time. The information in this analysis is for internal use only and redistribution of this information to third parties is expressly prohibited.
Neither the analysis nor the information contained therein constitutes investment advice or an offer or an invitation to make an offer to buy or sell any securities or any options futures or other derivatives related to such securities. The information and calculations contained in this analysis have been obtained from a variety of sources including those other than ICE and ICE does not guarantee their accuracy. Prior to relying on any ICE information and/or the execution of a security trade based upon such ICE information you are advised to consult with your broker or other financial representative to verify pricing information. There is no assurance that hypothetical results will be equal to actual performance under any market conditions. THE ICE INFORMATION IS PROVIDED TO THE USERS “AS IS.” NEITHER ICE NOR ITS AFFILIATES NOR ANY THIRD-PARTY DATA PROVIDER WILL BE LIABLE TO ANY USER OR ANYONE ELSE FOR ANY INTERRUPTION INACCURACY ERROR OR OMISSION REGARDLESS OF CAUSE IN THE ICE INFORMATION OR FOR ANY DAMAGES RESULTING THEREFROM. In no event shall ICE or any of its affiliate’s employees’ officers’ directors or agents of any such persons have any liability to any person or entity relating to or arising out of this information analysis or the indices contained herein.