

Editor’s Note: We apologize in advance for possibly any seemingly out of date market numbers or comments, as the past couple of weeks have seen unprecedented volatility on a daily and even hourly basis. It has been quite a chore to keep this edition up with the wild swings in the bond market. That said, the major points we are making are still intact and very relevant, so we have decided to press ahead with publication.
Inflation Hopes Spring Eternal
We continue to see that inflation hopes are springing eternal in the world’s bond markets in the Spring of 2023. The bond market is moving manically between elation that nagging inflation has finally been vanquished, and fears that it has not. It depends on the day, the hour, or even the minute after an “important number” is released, but bond traders continue to focus on the Federal Reserve’s (Fed) next move. Even after the plunge in bond yields the seizure of Silicon Valley Bank (SVB) and the worries about Credit Suisse, yields are still up considerably in the past year.
As the chart of the U.S. government yield curve shows below, investors obviously believe that the Fed will win its war on inflation since they are happy with a 30-year U.S. Treasury bond (UST) yield at 3.6%. That is 0.4% less than a 1-month Treasury Bill (T-Bill) yield at 4.0%. Investors are giving up more interest with the shorter-term T-Bill to lock in their coupon for 30 years and avoid the risk that bond yields will fall.
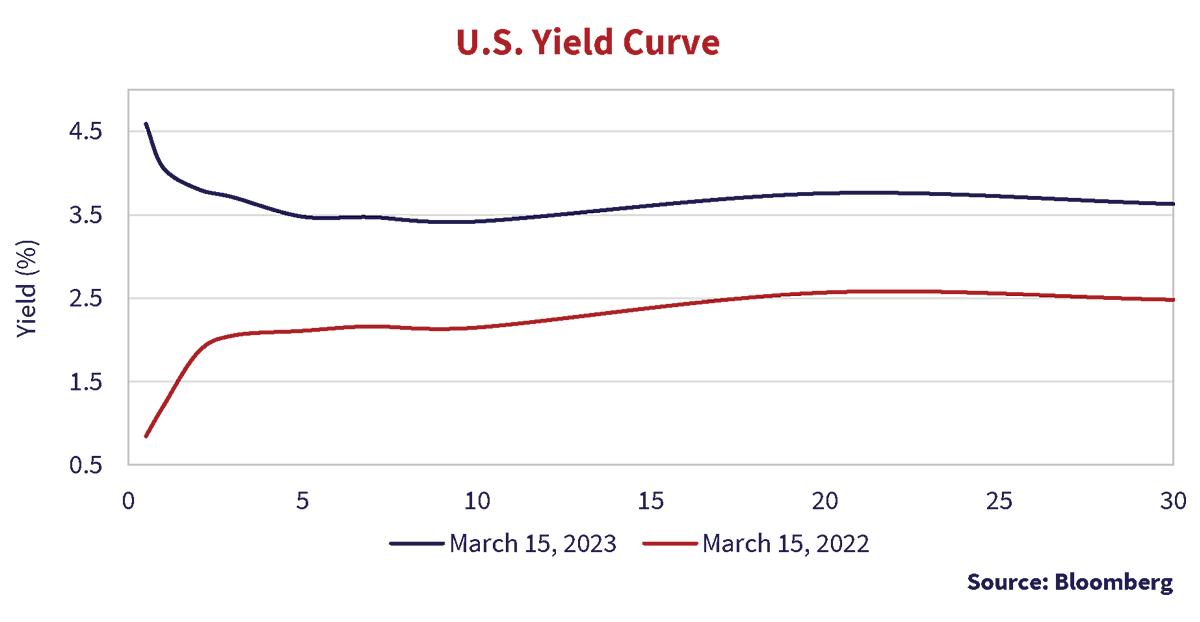
Compare the current yield curve with the curve from one year ago on the chart. Back in mid-March 2022, 6-month T-Bills were a paltry 0.8%, but long bonds were 1.7% higher at 2.5%. Long bonds have since elevated another 1.1% to 3.6%, but 6-month T-Bills have jumped 3.8% from 0.8% to 4.6%.
Cash is Not Trash
A yield of 4.0% on a 30-day U.S. T-Bill, long considered the “risk free” asset by efficient markets theoreticians, is pretty good compared to its near zero yield in the long period of Zero Interest Rate Policy (ZIRP) from 2011-2018. One would think investors, especially professionals, would be falling over themselves to get that 4.0% yield. As the saying goes at Canso, “When Cash is Trash, Prepare for the Smash”. We usually say this when people are piling into equities, oblivious to the downside risk, in their haste to “get invested” and not miss out on surging markets. This time around, it could be cash that is being overlooked in investor haste to get invested and lock in their coupon to profit from the future riches of falling yields and higher bond prices ahead.
Cash is very much now a yield generator, but the important question is how long that will last and how much will the Fed continue to tighten policy further? Another very important question is whether the Fed has done enough to get inflation back to its target of 2% and make long bonds attractive at 3.6%, which is low by historical standards. As the economy stays stronger and inflation lingers longer than the bond market expects, Fed outreach and its public relations machine had been growing more hawkish prior to the SVB panic. Now the markets have carved back their expectations for future hikes that they were predicating on an aggressive Fed.
Regrets, The Bond Market Has More Than a Few…
The bond market was starting to regret its optimism that the Fed is near the end of its battle against inflation before SVB. When we last wrote to you in December, the bond and equity markets were rallying due to optimism that the Fed and other world central banks were finished their aggressive tightening of monetary policy. At the time, things sure looked good on the inflation front. As we then said:
“The U.S. bond market has just warmly received the November U.S. CPI numbers. The overall CPI was up 0.1% month-over-month on falling energy prices and the core rate had its smallest increase in quite a while at 0.2%. That annualizes to 1.2% for the overall CPI and 2.4% for the core CPI.”
The 2.4% core U.S. CPI in the November report indicated to many in the financial market that the Fed was almost at its 2% target and could relent its campaign to slow the economy and inflation by making money and credit more expensive. At that time, we were more sanguine about inflation slowing. Looking at wages, we believed that inflation expectations were becoming embedded: “The fly in the CPI soup was wages, which were up 1.2% for the quarter, which annualizes to 4.8%, and 5.1% year-over-year.” We closed our December Market Observer by pointing out investor fixation on monetary policy. As the song goes, “It’s All About that (monetary) Base, No Tightening. Nothing else really matters to the financial markets.”
“Just When You Thought Inflation Was Conquered”
Each inflation report and Fed uttering sends the bond market careening between its preferred outcome that inflation is “Back to the 2% Inflation Future” and the grim realization that it might stay higher for much longer. The Wall Street Journal Editorial Board gave voice to that investor frustration:
“Just when you thought inflation was conquered, the next government report pulls the economy back in. That’s what the economists who thought the end of inflation was nigh must be thinking in frustration after Friday’s report on the personal-consumption expenditure price index…
… PCE inflation overall rose 0.6% for the month, up from 0.2% in each of November and December. The PCE index over the last 12 months is up 5.4%, which was up slightly from December after several months of decline. Inflation in services drove much of the increase and is up 5.7% since January 2022.”
Source: The Editorial Board. Battle of the Inflation Bulge. WSJ, February 24, 2023.
A Very Sticky Inflation Wicket
We have some big cricket fans at Canso (led by Mr. Vivek Verma, CFA) but the rest of us usually have no idea what they are talking about. The summary of post-game commentary seems to be that fans gloat over victories but attribute losses to a variety of unfair things, especially the dreaded “Sticky Wicket”. This seems to be happening with today’s very sticky inflation. Good inflation news is met with elation, but evidence to the contrary is met with denial, frustration and even anger.
The WSJ Editors pointed out much the same thing with their comment on U.S. PCE inflation as we did in our December edition with our graph of the Canadian rise in both wages and core CPI. We suspected it showed that inflation was likely to be stickier than the markets were impounding. We worried that the bond market had got ahead of itself in declaring victory over inflation. At the low yield in December of 3.4% on the long 30-year Treasury, bond investors had already impounded an inflation rate below 2%, as we showed in our discussion of inflation-linked bond breakeven spreads.
Don’t Stand in the Way of a Bond Rally
Things haven’t changed much, as the latest Canadian employment data still shows 5% growth in wages. The latest U.S. February inflation numbers show that core inflation is remaining at above 5% and is far from being defeated. As Bloomberg summarizes:
“Underlying US consumer prices rose in February by the most in five months, an acceleration that leaves the Federal Reserve in a tough position as it tries to thwart still-rapid inflation without adding to the turmoil in the banking sector.
The consumer price index, excluding food and energy, increased 0.5% last month and 5.5% from a year earlier, according to Bureau of Labor Statistics data out Tuesday. Economists see the gauge — known as the core CPI — as a better indicator of underlying inflation than the headline measure. The overall CPI climbed 0.4% in February and 6% from a year earlier.”
Source: Saraiva, Augusta. US Core CPI Tops Estimates, Pressuring Fed as It Weighs Hike. Bloomberg, March 14, 2023.
That report reversed a considerable part of the drop in bond yields over the SVB imbroglio, but they’ve just plunged again on worries over Credit Suisse and a wider banking crisis. On the other hand, as we said at the time, if the bond market wants to rally, there’s not too much that stands in the way. Bond managers “lift offers” and traders don’t want to be short something going up in price so yields plunge and bonds soar in price.
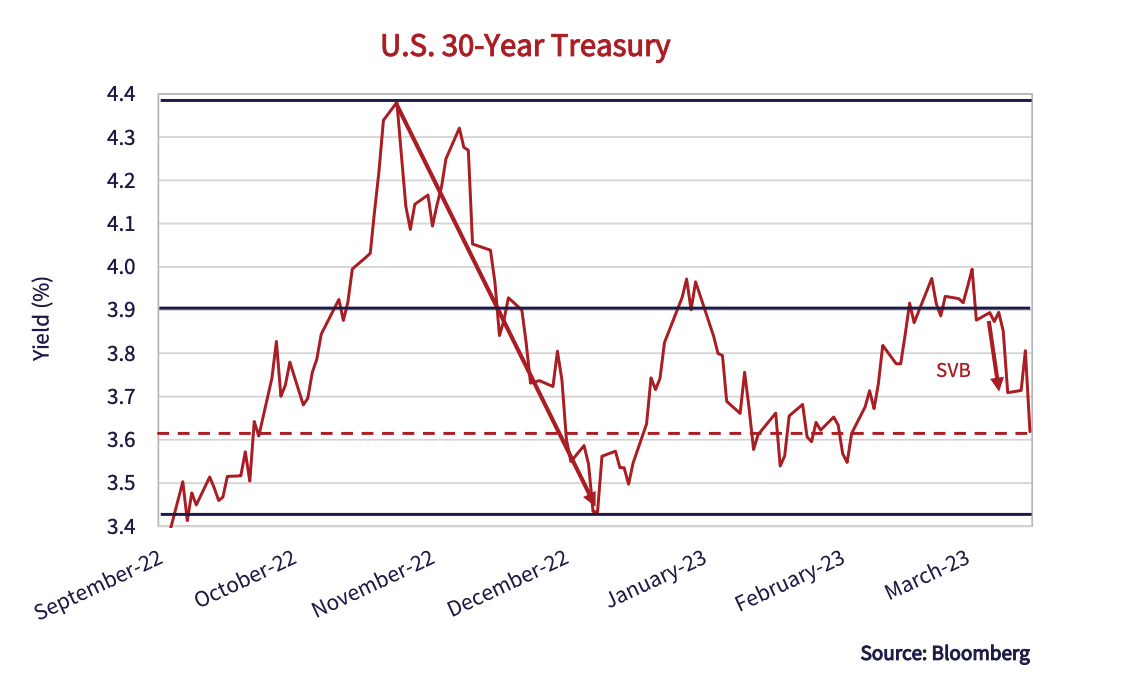
This can be seen in the yield chart of the U.S. 30-year bond below. The long bond yield peaked at 4.4% in November when inflation reports and fears were at their peak. It then plunged in December when the November CPI report showed annualized rates near the 2% Fed objective. From the peak of 4.4% on October 24th to the low of 3.4% on December 7th, that was a drop of exactly 1%, which equates to about a 20% move in the price of the long Treasury. That was surely evidence of the enthusiasm of bond managers for the inflation world they once knew, just a few short years ago, and desperately wanted back.
Stuck in the Yield Middle With You
The 3.6% yield of the 30-year UST at present is not too far off the 3.9% middle of the range between the recent high and low yield of 4.4% and 3.4%, respectively. With the illiquidity in the market, it doesn’t take much to move yields quite substantially in one direction or another. The huge move of 0.17% on Friday, March 10th, on seemingly a modest positive (weaker) employment report, turned out to be a response to the failure of SVB that was taken over by the U.S. Federal Deposit Insurance Corporation (FDIC). Despite this being the largest bank failure since the 2008 Credit Crisis and worries over Credit Suisse, we’re still in the middle of enthusiasm for low inflation and desperation that it is not coming down.
No Bond Investor Left Behind??
No matter the short-term antics of the bond market, it is clearly anticipating a “return to normal” inflation, or even a recession, if the yield curve’s prediction is to be believed. Bond managers do not want to be left behind in the soaring bond market they desperately dream is ahead. Clearly, nobody actually knows what is happening, especially at the central banks. They got things terribly wrong with their continued ease in the aftermath of the pandemic. Their “transitory inflation” from pandemic supply shortages has now proved to be the highest and most sustained inflation since the very inflationary 1970s.
Central Planning Central Bankers
Monetary policy is supposed to be aimed at making sure money supply is adequate for supporting the economy. The financial interventionist heroics of Alan Greenspan changed all that and created a market belief that the Fed dictates economic and financial market outcomes. Don’t get us wrong, one should not “Fight the Fed”, as the 1970s saying went. The Fed and other central banks can stimulate the economy through loose monetary policy or crater it through drastically restricting money or credit. The question is whether they should even try if you’re a strict Monetarist. The financial market belief in the ability of the Fed to “fine tune” the economy hearkens back to the central planning of the Soviet Union. Free markets are supposed to provide price signals to market participants, not have them dictated by the Fearless Leaders of the Fed or other central banks.
MMT Mania
The culmination of activist monetary policy was Modern Monetary Theory (MMT). It basically stated that gobs of money were the answer to any societal problem and that, contrary to monetarist theory, “Money Didn’t Matter”. The urgency of the pandemic is long gone, but the effects of its very loose monetary and fiscal policy linger on. The central bank Heroes of the Credit Crisis, Euro Debt Crisis and the Pandemic have now turned to the Zeroes who “let inflation rip” by holding interest rates at zero far too long. They are now playing catch up with very restrictive policy. Will they under or over correct in their interest rate policy? If history is our guide, they most certainly will.
“To Err is Only Human”
The chart below shows U.S. yields on 30-day T-Bills and the 30-year Treasury bond starting on December 31st, 1999. This chart is instructive for those who still believe that monetary policy is expert and considered. As the saying goes, “to err is only human”. It shows the very human tendency for the Fed to err on both sides of the money supply and interest rate equation.
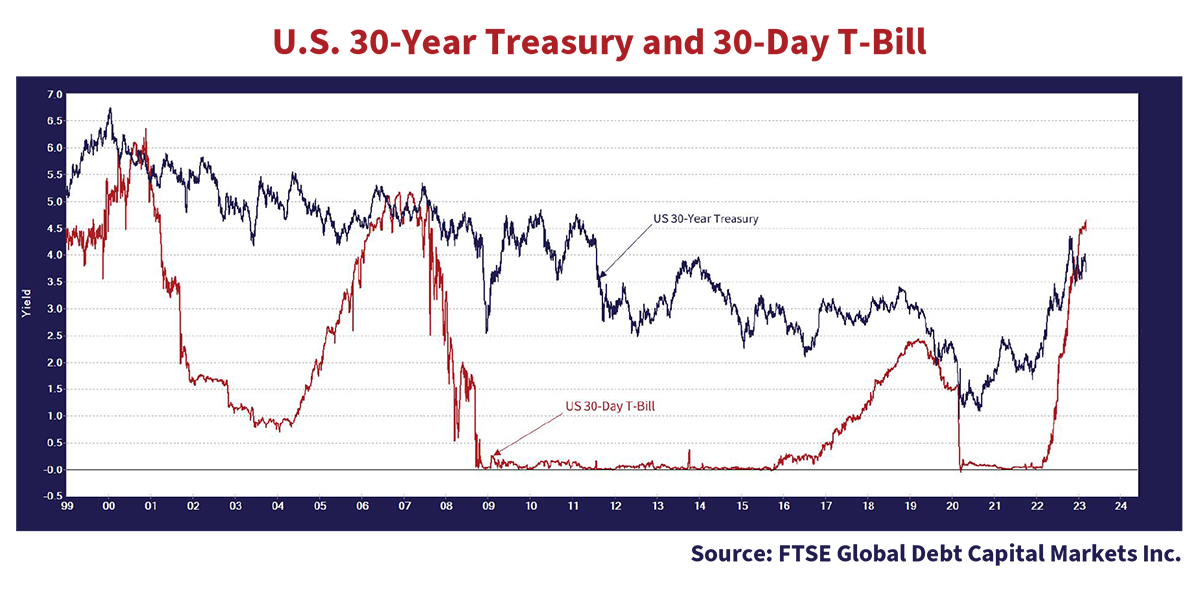
Serial Distorters
The Fed has been serially distorting the financial system ever since Greenspan’s massive monetary intervention to rescue the stock market in 1987. It plunges rates in response to a perceived financial or other crisis and then attempts to “normalize” policy by raising interest rates with disastrous effects on those used to easy credit. The rationale for these financial rescues is the stresses on the financial system and/or the “negative wealth effects” of dropping stock prices on consumers. Far from the central banking public persona of measured thoughtfulness based on analysis, the chart dramatically displays the roller coaster of interest rates that the Fed has inflicted on the American and global financial markets.
Too much of a good thing is usually bad, and that was eventually the case for central banks with money supply. This time around, money was also the answer to the economic devastation of a public health emergency, also using fiscal policy as a very blunt economic force. The critique of previous fiscal stimulus was that it took too long to “get out the door”, so the pandemic fiscal policies emphasized speed and action over considered thought. Both pandemic monetary and fiscal policies boiled down to “shovel cash out the door as fast as possible”, no matter the country.
Giving Money to People Who Stiffed You
If you don’t believe this, the Canadian government used the Canada Revenue Agency (CRA) (the people who collect taxes) to give pandemic support subsidies to struggling businesses that had outstanding tax debts to the government. Giving money to people who had already stiffed you if you’re the tax collector might seem odd, but quick action was the seeming requirement of those desperate pandemic days. Now the Canadian Trudeau government is not too keen on investigating how this happened or how many of these businesses misused the monies showered on them, or even whether they stayed in business. Is it any wonder why?
Mea Gulping
Now all of us, who watched the feverish pandemic money creation and debt financed government spending with trepidation, are wondering what will happen with inflation. Will the copious amounts of money printed by central banks and distributed by governments to their citizens still continue to cause inflation that it wasn’t supposed to? Strict monetarist theory would suggest that our current high inflation is a result of exactly that.
The good news, or possibly bad news for those who need money, is that central banks now seem to recognize their monetary mistake of thinking the post-pandemic incipient inflation was “temporary and transitory”. Even the former policy “Doves” at the Fed, who were quite happy with its post pandemic “Wait and See” approach, are now spouting tough love monetarist dogma. Their current frenzy to raise rates seems to suggest that central banks are engaged in a massive “mea culpa” (gulpa?) and indeed belatedly recognizing that “money does matter”.
Don’t Bank on It
If the enthusiasm of the bond and stock markets are to be believed, the recent financial problems with SVB and Credit Suisse could finally be cause for the Fed to finally relent. One enduring part of Alan Greenspan’s legacy as Fed Chair is that investors always believe that the Fed will “rescue” the financial markets if there’s a dire enough financial problem, the vaunted “Fed Put”. As many are pointing out, the 1.1% drop in yield of the UST 2-year bond in the 3 days after the SVB problems became public is record breaking. At the time of publication on March 15th, the problems with Credit Suisse and general worries about the banking system have caused another massive 0.4% decline in the 2-year UST bond.
Does this mean the Fed will actually relent?? It’s a hard call. Deciding that “this time will be different” is a very dangerous thing for an investor to do. On the other hand, we have seen little evidence that there are problems in the credit markets during this tightening cycle so far, except for the recent meltdowns of SVB and Credit Suisse. The graph of the 2-year UST yield below shows why bond investors might want a bit more of a financial meltdown or another credit crisis. Bond investors are obviously thinking that a banking crisis will persuade the Fed to moderate its aggressive tightening if not bring interest rates back to near zero.
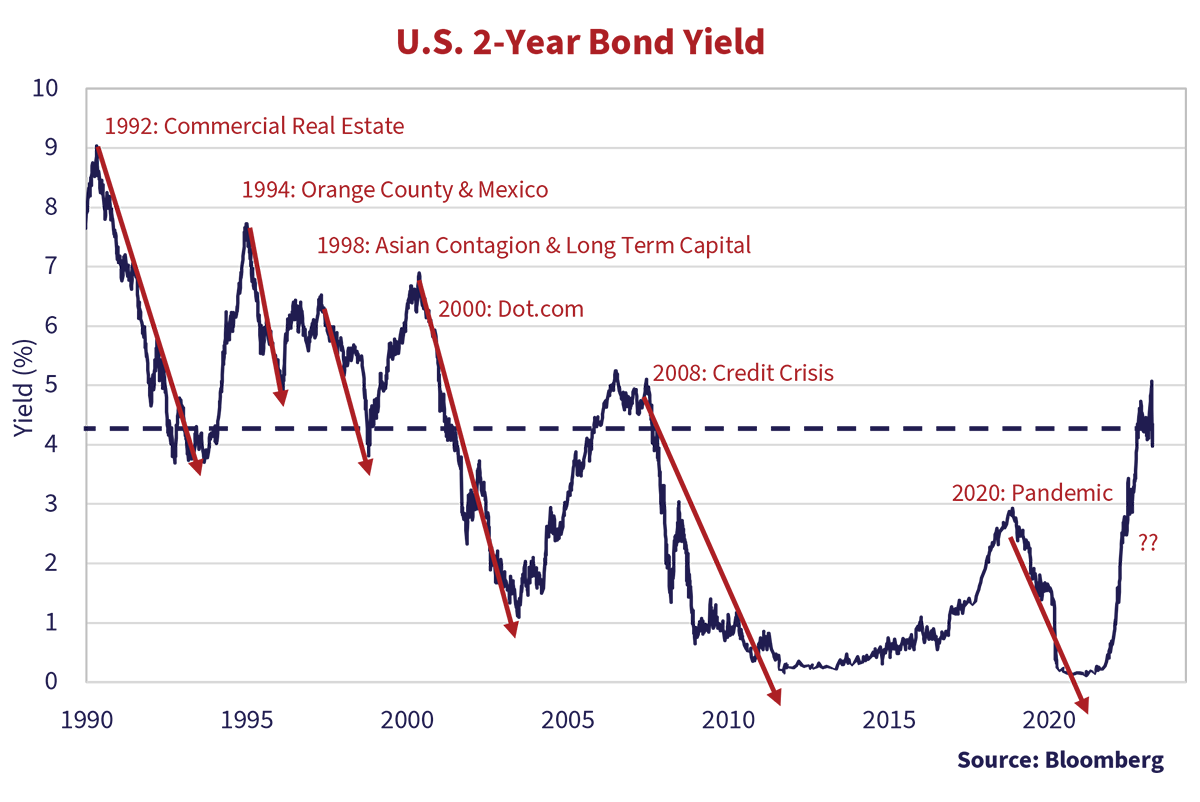
This decline in the 2-year UST yield is so far barely a blip on the chart above. A good drop in the 2-year UST yield for prior financial crises has been 3-5%, and that is what bond investors are probably hoping for. On the other hand, the problem with SVB is not the same as the systemic risks to the entire financial system from the U.S. sub-prime mortgage crisis. That extended to virtually all parts of the global financial system and inflation is now possibly the Fed’s more important problem.
Scarce Money is Never Good
If the Fed decides inflation is its priority, it will continue on it tightening course and that never ends well for financial assets. When the tide of liquidity goes out, the returns demanded by investors to part with their money should go up. In our opinion, the corporate bond market is not yet showing many signs of credit stress, with defaults low and money easily available to corporate borrowers in the bond and bank loan markets. That will change as money and credit grow scarcer.
Tautologically, less money and liquidity should mean illiquid investments suffer more than liquid marketable assets. Except for the current debacle in venture equity, the mania in “Private” and “Alternative” financial assets have yet to have their day of reckoning. Some other illiquid asset classes have fallen out of bed with price declines, as they should have.
Book Magic
We note with some amazement that major Canadian public sector funds are pointing out in their year-end statements how well their private and alternative investments have done compared to the negative returns on their public marketable investments. That’s “Book Value” magic that gives management discretion to judge “permanent impairment”. Sooner or later, when it is obvious that similar investments are selling at much lower prices, their accountants or boards will be forced to mark things to where comparable investments are trading in secondary markets.
Rising Rate Mayhem
The rise in short-term interest rates engineered by the Fed is causing a bit of mayhem of its own, as it also raised bond yields and discount rates on other investments. The problems with SVB stem from just that. SVB invested the funds given by their depositors in longer-term UST bonds. These are very high quality and liquid financial assets that fell in price due to the jump in Treasury yields. When depositors withdrew funds, SVB had to sell their UST positions to raise money. Public disclosure shows a loss of $2 billion on the sale of a $21 billion UST position. Given the rise in interest rates, that implies a duration of 4 to 5 years for the assets matching very short-term liability of floating rate deposits.
This astounds anybody who lived through the 1970s interest rate increases and/or the 1994 Orange County fiasco in “safe” Asset Backed Securities (ABS) based on Mortgage-Backed Securities (MBS). It was the increasing interest rates of the 1970s that caused the Savings and Loan (S&L) industry to default. They had 25-year fixed rate retail mortgages as assets and their liabilities were deposits that floated upwards with prevailing interest rates. The value of their retail mortgage assets dropped with interest rate increases and the value of their floating rate deposits stayed the same. S&L interest expenses also rose in the face of fixed rate mortgage interest income, which led to ongoing losses. This cratered the whole S&L sector and led to the U.S. government creating Resolution Trust, which took over all the failed S&Ls.
Mind the Gap
The mismatch or duration “gap” between assets and liabilities became something to manage closely for a financial institution. Because of that, the banking and insurance industries learned to manage the term/duration of their portfolios. Proper treasury and risk management keeps the liabilities close to that of their assets and any difference is called the “Gap’, which is managed very closely. This is a history lesson that was lost on SVB’s management and risk managers. It seems amateurish if not reckless that SVB took in deposits and invested them in longer-term UST bonds. As a Bloomberg article says, SVB’s Treasury and Risk Management staff seem to have taken the Fed’s assurances that they would hold rates low “forever” at face value:
“Crucially, the Federal Reserve pinned interest rates at unprecedented lows. And, in a radical shakeup of its framework, it promised to keep them there until it saw sustained inflation well above 2% — an outcome that no official forecast.
SVB took in tens of billions of dollars from its venture capital clients and then, confident that rates would stay steady, plowed that cash into longer-term bonds.
In doing so, it created — and walked straight into — a trap.”
Source: Chappatta, Brian. SVB Spectacularly Fails After Unthinkable Heresy Becomes Reality. BNN Bloomberg, March 10, 2023.
Press reports suggest that the management of SVB invested in longer-term UST bonds to increase their reported interest income. There seems to have been internal debates about the wisdom of that strategy, given the obvious risk, but higher reported profits were very attractive to management and shareholders. As the Trump Administration reduced the regulatory oversight and removed the requirement for smaller and regional banks to do “Stress Tests”, this extreme mismatch was not flagged. The SVB year-end financial statements showed a huge $15 billion “mark to market” loss but the bonds were carried at book value under accounting standards, given they were classified as “Held to Maturity”. When SVB depositors wanted their money back, they weren’t held to maturity and the proceeds of the sales were 10% lower than their book price and the fun started.
Bad News for Bad Bankers
The FDIC and the Biden Administration have now announced that all depositors, even those above the $250,000 FDIC insured maximum, will be guaranteed to prevent the bank run from spreading. That’s a huge win for the 90% of uninsured deposits at SVB who won’t have to take a 10% loss and possibly wait years to get all of their money. It didn’t hurt that 450 venture capital executives signed a petition pointing out the damage to their industry, and incidentally to their bonuses and carried interest.
The Fed and Treasury also introduced a new Fed facility that allows small and regional banks to borrow against collateral. This interestingly is done at the book value of UST bonds that allows these banks to borrow at carrying value so there is no loss on an actual sale if they need liquidity. Commercial banks or investment dealers lend against securities at market value, so this is a big gift to these banks and suggests that many others may have had “mark to market” losses.
There was also bad news with this good news. The FDIC and the U.S. Treasury have also announced that shareholders and bondholders of SVB will be “wiped out” and the management fired. That’s very harsh compared to the Credit Crisis treatment of “Bankers Behaving Badly”, where gobs of support and cash were showered on the guilty parties who then got to pay themselves great bonuses again after a short while. That’s a good thing, and there will be a lot of Silicon Valley billionaires and former SVB shareholders watching what they invest in going forward.
Distress Spreads to Bonds
Even bondholders are being sideswiped by their reliance on credit ratings. SVB parent SVB Financial (SVBF) issued a 10-year Senior Unsecured bond in 2021 with a 1.8% coupon. That meagre coupon was only 80 bps (0.8%) of credit spread over a the very low 1% UST yield at the time since it was then rated investment grade by both Moody’s (A3) and S&P (BBB). If the Fed is to be believed, that bond is now worth far less and the market agrees. The SVBF bonds are said to have traded at distressed levels of $30 in the weekend before SVB was put into receivership. SBVF does have other assets, but since the FDIC claims rank prior to any other SVBF debt, the payoff to the distressed investors depends on the money necessary to make the FDIC whole on its guarantee of all SVB deposits. Credit Suisse is a Swiss bank with very different problems, but its senior debt is now also trading at distressed levels.
Knee Deep Jerks??
It could be the wheels really are falling off the financial system and SVB is the proverbial canary in the coal mine, but this time just might be different. A tightening cycle is supposed to do damage to the economy through tighter and higher rates, but historically central banks were the lender of last resort only for commercial banks. Central banks did not rescue the financial markets from their excesses. Greenspan was a Wall Street consulting economist who made financial rescues, even of the stock market, his signature song. Financial rescues were popular with his peers and successors, but they did not result in high inflation until the pandemic. This time around, central bankers know they screwed up on the inflation front. Will they employ their kneejerk deep interest rate swan dive this time around??
Are We There Yet???
So, where do we go from here? The financial markets are like spoiled children in the back seat of the monetary car, constantly asking “Are We There Yet?” and complaining vociferously that we are not. Worse yet, the central bankers driving the monetary car literally have no idea when their tightening journey will end. To extend the analogy, Dad is lost and refusing to ask for directions as Mom angers in frustration and the kids clamour in the back seat. As inflation stubbornly stays high, it seems the consumers “along for the ride” have more staying power than anyone expected.
The Good, the Bad and the Ugly of Inflation??
Inflation is not all bad, but our current inflation crop is especially ugly. Consumers are struggling with higher living costs and demanding higher wages, which they seem to be getting since there still seems to be a lot of money around. The good thing from high inflation is that nominal economic growth is correspondingly very high as well. Governments, businesses, and consumers get higher nominal incomes compared to fixed nominal debts. And governments are forced to pass through inflation increases to government beneficiaries, such as Old Age Security recipients. Retired Americans and Canadians saw last year’s very high inflation increase their Old Age Security payments substantially through CPI indexation that they all probably thought was really good. We’d hazard a guess that not many seniors returned this windfall to spare their fellow citizens an inflationary spiral. That’s a lot of spending power seeping into the economy and prices. That combines with wage growth of 5% to allow consumers to pay higher prices. As the WSJ commented in their editorial: “No doubt our readers have noticed as they pay more every time they visit a doctor, hire a plumber, check into a hotel, or take the kids to Disney World.”
Yield to Cash??
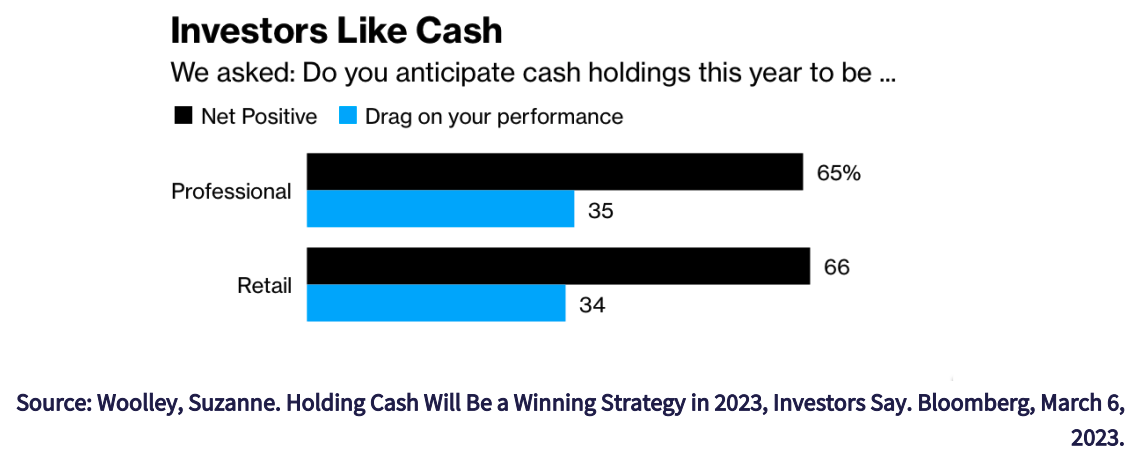
As we’ve pointed out earlier, the good thing in March 2023 is that short-term interest rates are up more than 4%. This is catching the eye of both retail and institutional investors, as the Bloomberg article below recounts:
“In 2023, cash is far from trash. That’s the verdict of the 404 professional and retail investors who took part in the latest MLIV Pulse survey. Two-thirds of respondents said the cash in their portfolios would bolster rather than drag down their performance in the year ahead. That cash holds such allure says a lot about the unsettled financial and economic environment. Fears of a potential bear market, continued rate hikes by the Federal Reserve and a looming recession have investors nervous, worried that 2023 could be a reprise of 2022’s brutal hit to portfolios.”
Even with the lower rates after SVB, cash does not seem like a bad place to park your money while waiting for the financial world to end or to prosper.
Yield to History
To give some historical perspective, we thought we would end our investment musings with an update of our history of long-term yields chart. We created this chart, what now seems like a very long time ago, to get a sense of how we look compared to investment history. It compares our current cycle since 1990 to the 40 years beginning in 1920 to 1960. We chose these years because of the similarity in the shift of Cold War military production to civilian uses with the fall of the Soviet Union in 1989, to the shift from WW1 military production to civilian consumer goods in 1919. The blue line is the moving average of the 1920 to 1960 long bond yield. The thin red line is the actual long bond yield since 1990 and the thicker red line is its moving average.
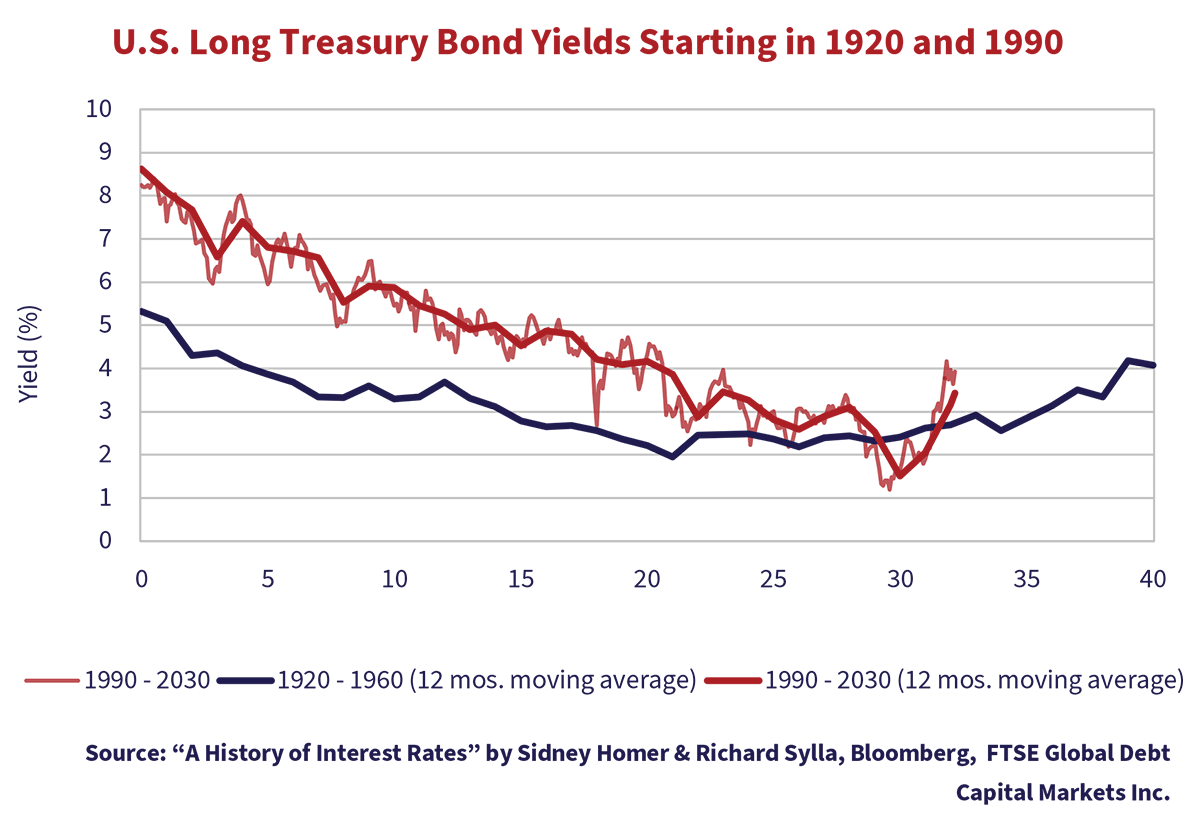
High Capacity for Disinflation
The two moving averages were tracking nicely before the pandemic and fit into our narrative of the end of the declining yield cycle. The pandemic upended that close fit, with its resultant plunge in yields, but it is now getting back to its previous tracking more closely, like most of our personal lives. The moving average of the period from 1990 to present has jumped back up to tracking approximately where it was above the 1920 to 1960 cycle. What does this mean? To us, the diversion of the Cold War military spending to productive uses was disinflationary. The unleashing of the massive production capacity of China and the former Soviet client states was also deflationary, as was the surge in international trade.
Our implication is that the ending of these forces will result in higher inflation than in the prior period. The decision of Vladimir Putin to invade Ukraine is now putting governments on notice that the “Peace Dividend” drop in Cold War military spending has reversed into “Peace Insurance” premiums as our democracies ramp military spending given the first large scale European war since 1945. That probably makes this chart even more relevant.
Note the convergence between the two moving averages that were over 3% apart at Year 0 and only 0.4% apart by Year 26. If the spread between the two moves up to 1% by 2024 (Year 34), then the long UST should be at 4% (3%+1%) without the high level of inflation we currently have. Without a significant drop in prices, we have a hard time seeing yields sustaining below 4%.
Nobody Knows the Inflation Future
So, what is the poor investor to do amongst all the confusing economic and central bank signals? The simple answer is to “Find Value”, and it looks to us like it will take some time for things to settle out. The good news is that indecision and sitting in cash and short-term bonds actually pays an investor.
Are yields about to ride up hugely with both stocks and bonds crashing, or will the Fed think SVB shows it’s done enough damage and slow its campaign?? Many in the bond market now believe the Fed will relent and interest rate futures now show the Fed stopping and reducing rates by year-end. That all depends on what happens to the economy and inflation which nobody really knows. We think market timing is a very difficult thing to do but there are very interesting ways to ensure portfolio success without betting the farm on a hot hand.
We still believe that inflation is going to stay higher than the markets expect, with a resultant shift up in the general discount rate for investments. Recession could be just around the corner, as the market has incorrectly predicted for a few years now. Defaults are still low, and issuers can fund at reasonable levels. A recession could be imminent, or a larger financial crisis due to SVB contagion, but we don’t see any particular distress or dislocation in the credit markets at present without a huge and unexpected event like another bank going bust.
Value Always Protects
We did what we had to do to protect our portfolios in the ZIRP stupidity that was foisted on the financial markets by central banks. Now that bond yields are 2% to 4% higher across the term structure, at least we’re not being paid virtually nothing to hold shorter term securities and even long-term yields have risen. We still like inflation-linked bonds which provide inflation protection and upside if real yields decline, and we think the extra yield of floating rate securities are attractive for investors with no term and duration needs.
We’re hopefully back to the difficult work of buying cheap things, not guessing at what a bunch of central bank humans might or might not do. We still are finding interesting situations to make money, no matter what happens. Our value driven discipline means buying things cheaply is in itself a form of protection so that’s what we’re now concentrating on.