

Once it looked like inflation was not a “temporary supply side” phenomenon, central banks rushed to correct their now very obvious mistake. They had created far too much money than was necessary for actual economic activity and the result is the highest inflation in 40 years. Now they are reining money supply back in and it is not pretty. Interest rates are up, and the financial markets have shuddered, shattered and fallen precipitously in price.
As we’ve pointed out in our past newsletters, financial markets couldn’t have been more liquid at the end of 2021 with all the money that central banks created during the Covid pandemic. This time around, it wasn’t just cash that went into financial institutions. The cash was given directly to citizens by their governments to “stimulate demand” that had collapsed with the Covid lockdowns.
Liquidity Didn’t Matter
It is always amazing to us that when central banks tighten monetary policy and therefore remove “liquidity”, that investors are surprised at the subsequent illiquidity in the financial markets. Liquidity doesn’t matter until it’s all that matters. We hear constant complaints of the lack of liquidity in the corporate bond market and wonder at this. Government bond traders at major Wall Street firms don’t want to take large positions in the huge U.S. Treasury market, for fear they might be caught with substantial loss-making positions in the current volatile markets. That engenders even more illiquidity, as client flows create huge swings in prices and yields. That makes traders even more worried about going offside with even smaller bond trades.
What did bond investors expect? That the Federal Reserve and other central banks would remove money from the system and things would get more liquid?
Richmond Hillbillies??
Our Canso offices are located in Richmond Hill, a suburb of Toronto, far from the maddening financial crowds of Bay Street and Wall Street. Perhaps this was why our rather unsophisticated view was that less money chasing financial assets would mean lower prices for them. Our Richmond Hillbillies’ call for financial asset prices to fall with central bank tightening was borne out in the first half of the year, with bonds and equities dropping 10-30%.
The most damage inevitably occurs in the most illiquid and speculative securities. We have certainly seen this in Crypto and Meme stocks, as their prices got crushed in the first half of 2022. That said, from our vantage point, the markets are in fairly good shape considering that interest rates have soared in the first half of the year. As the chart below shows, yields on Canadian 90-Day T-Bills are up 2% year-to-date. The problem is that these are not likely to be the last interest rate hikes that we’ll see.
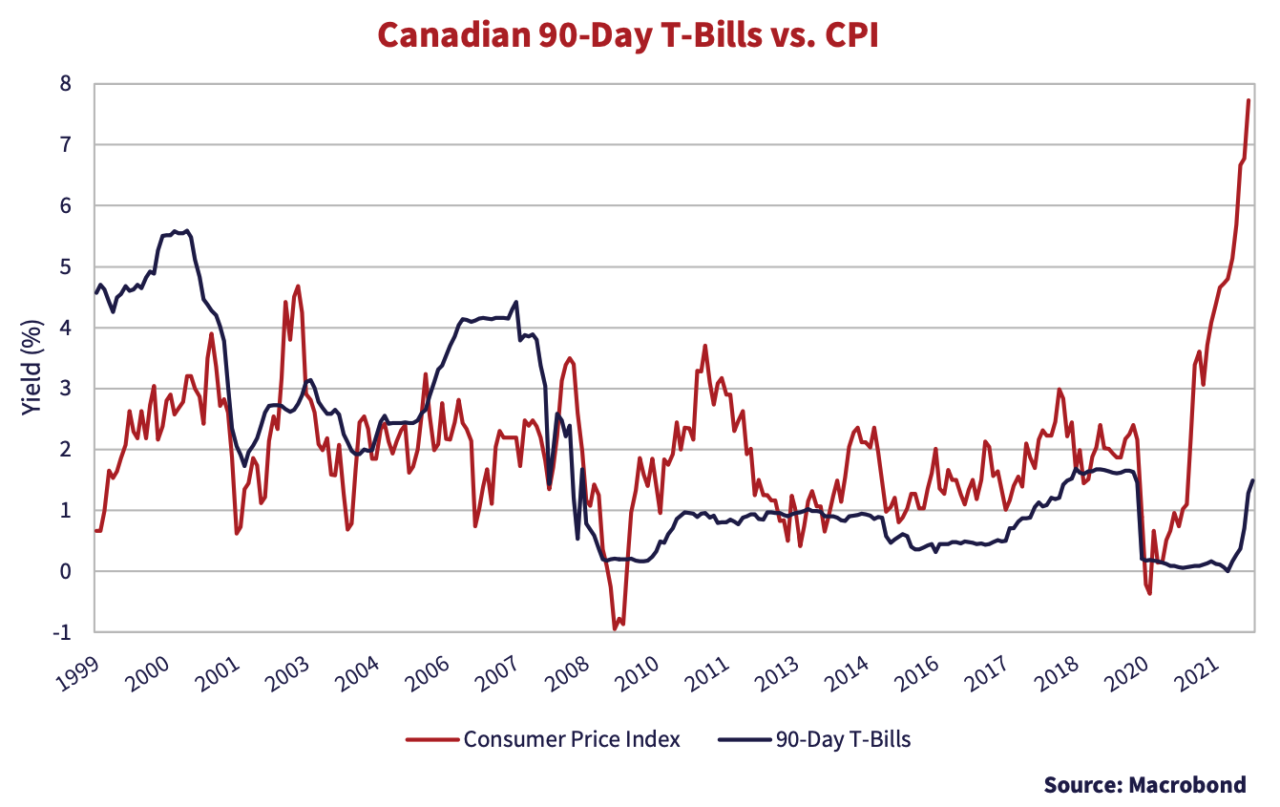
Inflation Genie Gone Rogue
As the chart also shows, the inflation Genie is out the bottle and seems to be going rogue, like Robin Williams’ character in the Disney movie Aladdin. In the movie, once out, that Genie did not want to go back in the bottle, and it now seems to be the same with inflation!
Today’s investors are expecting an economic miracle, with inflation miraculously dropping towards 2% from the current much higher levels. What will it take in the way of “removing liquidity” and the resulting increases in administered interest rates to convince today’s inflation Genie to go back into the bottle??
We think interest rates need to move above inflation, as inflation seems to be broadening out into consumer and business expectations. There’s a long way to go. A historical inspection of this chart shows that Canadian government T-Bills were over 5% in 2000 when inflation was a mere 3%. T-Bills were 4% in 2007 when inflation was a paltry 2%. Now we have inflation “unexpectedly” hitting 7.8% and T-Bills are at only 2%.
Getting Real on Interest Rates
To get to real short-term interest rates of 2%, we would be moving up to 4% on T-Bills, given our historical example. Considering we’re currently at 2% and the bond market is impounding 3.0% one year from now, we still have a long way to go. And that depends on the CPI falling miraculously to 2%, which is not likely to be the case.
Canadians are not the only investors expecting miracles. Higher than expected inflation is causing political and economic turmoil in many countries. Investors around the world are hoping that the huge jump in short-term interest rates is enough to slow things down and get inflation back under control.
We are not so sure.
We have discussed the historical record on interest rates and inflation many times before on these pages. We are preparing a more extensive update of our Canso Position Report published in 2011.
ZIRP All
Our research shows that interest rates and bond yields normally yield a healthy premium over inflation, ranging from 1-2%. The decade from 2009 to 2019 saw nominal interest rates well below inflation, which meant investors were seeing negative real interest rates. Even Zero Interest Rates Policies (ZIRP) were not good enough for the European Central Bank (ECB). They proceeded to buy up bonds and push bond yields to negative.
MMT Neverland
The Credit Crisis taught the thoroughly modern central bankers of the past decade that “Money Doesn’t Matter” anymore. Lots of money was created by central banks in the aftermath of that financial panic and it didn’t result in the high levels of inflation that many expected. This belief was given the gravitas of its own euphemistical moniker and became known as “Modern Monetary Theory” or just “MMT”. This new and unproven theory even had its own acronym, which made it even more attractive to central bankers and financial bureaucrats.
Basically MMT, without muchresearch or evidence, stated that a central bank could create as much money as they wanted for any purpose, without any inflation or other ill effects on an economy. It was the height of economic wishful thinking and was tantamount to Peter Pan telling Wendy she just had to “Believe” to fly to Never Never Land.
More money became the ultimate solution to an economy’s woes. The hyper-inflation of the Weimar Republic, Mugabe’s Zimbabwe and Chavez’s Venezuela was discarded as outmoded, and MMT became the latest fashion among the world’s financial elite. Why jet to an international financial conference and talk about something as passe as mere money supply??
Only Money Matters
This was a far cry from the doctrinaire monetarist creed of Milton Friedman and the Chicago School, whose battle cry against their Keynesian economist enemies was that “Only Money Matters”. Unfortunately, creating copious amounts of money was popular with politicians, the financial markets and voters alike. The standard central banking playbook since the “Maestro” Alan Greenspan was to:
- Create lots of money to save the financial system from self-destruction;
- Grudgingly “normalize” and tighten monetary policy to deal with rising inflation;
- Print even more money once the financial markets implode from their new excesses; and
- Repeat!!
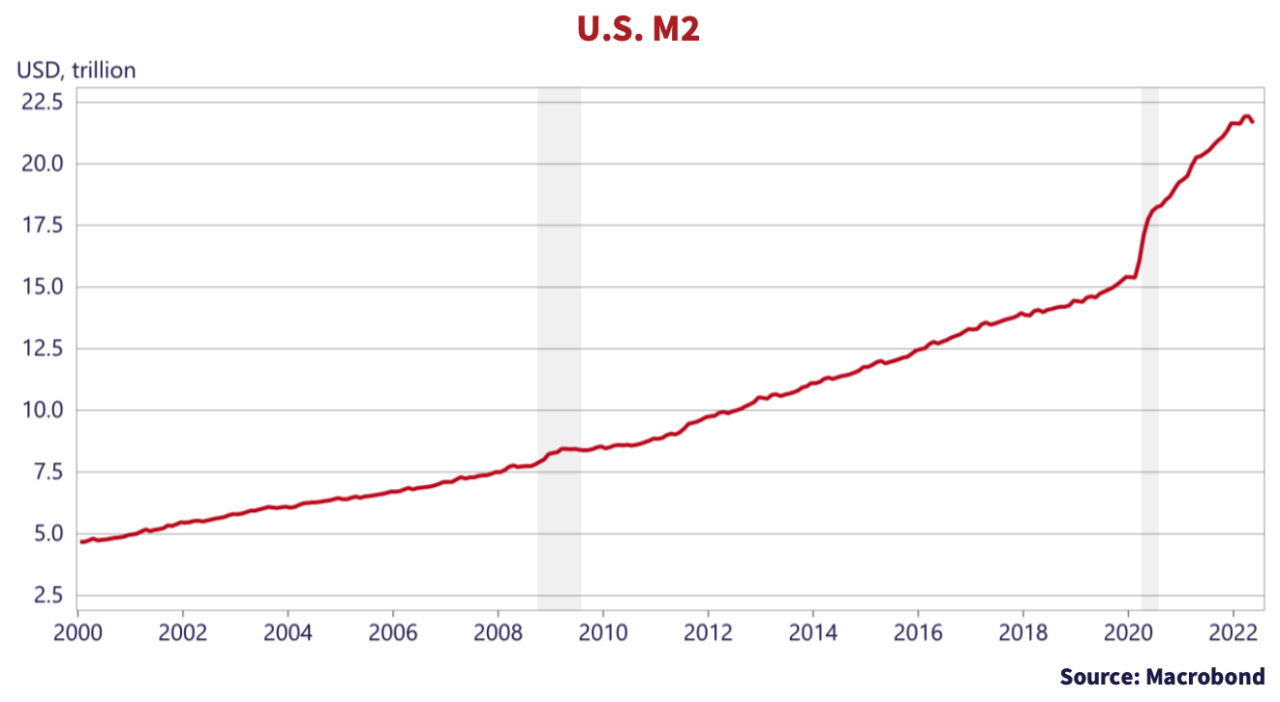
Mother of All Easings
That worked until the Covid pandemic “Mother of All” monetary policy easings, as can be seen from the chart below. That shows the brutal truth of what the Federal Reserve did. M2 was $16.1 trillion in March 2020 before the pandemic and soared, literally almost straight up, to the current $21.7 trillion, an increase of almost $6 trillion or 35% in just over 2 years!!
Monetary Floodgates Opened
The chart below shows M2 as a percentage of GDP, the value of all goods and services in the U.S. economy. Economists will recognize this as the inverse of the “Velocity of Money”. It shows that the monetary floodgates were opened like never before as a response to the recent Covid pandemic, a dramatic increase from 70% of GDP before the pandemic to the current 90%!!
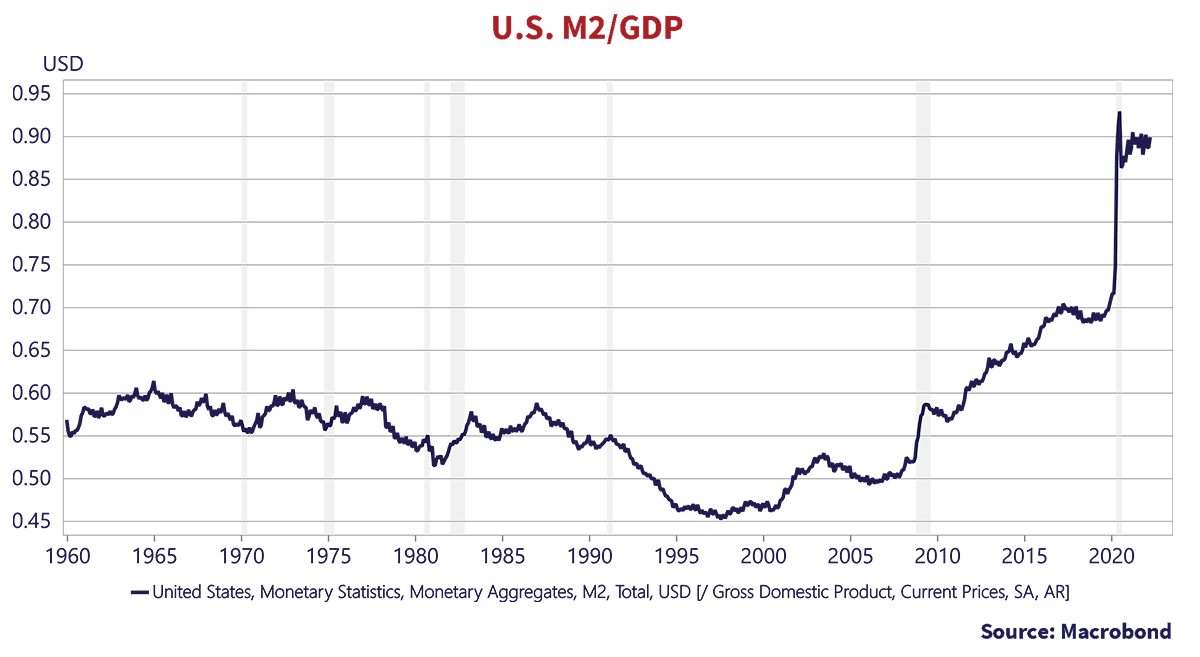
The graph also vividly shows the response to the Credit Crisis of 2008. M2 was a mere 52% of GDP in 2008 and had soared to 70%, before rising to the current 90%. M2 had ranged between 51% to 62% of GDP from 1960 until Alan Greenspan took the helm in 1987, just in time for the Black Monday stock market crash of October 19, 1987. The aim of monetary policy since then seems to have been to rescue the financial markets from their inevitable excesses, rather than keep a steady hand at the monetary tiller of the economy. We’ve pointed out many times that investors want to believe that monetary policy can smooth out booms and busts, but it never does. Note the frequent recessions in grey since 1960. Also note that every recession has seen successive growth in money supply without much reduction in between.
Cashing In
You don’t have to have a PhD in economics to recognize that the Fed probably added too much money to the financial system. The problem this time around is that this money was not just pumped into the financial system to keep interest rates low. As we’ve noted before, the Fed bought U.S. Treasury bonds and paid the U.S. government for them with newly created cash. That cash was then given to every living American, regardless of need.
Is it happenstance that the CPI has soared in the U.S. or other countries after their central banks created a lot of cash? Strict monetarists believe the money supply should be expanded only enough to provide for normal economic growth. From 2009 to 2019, U.S. nominal economic growth ran at about 4.4%, with 2% CPI inflation which created 2.4% “real growth”.
We’ve plotted a steady 4% growth rate against the actual growth rate of U.S. money supply since 2015 in the graph below.
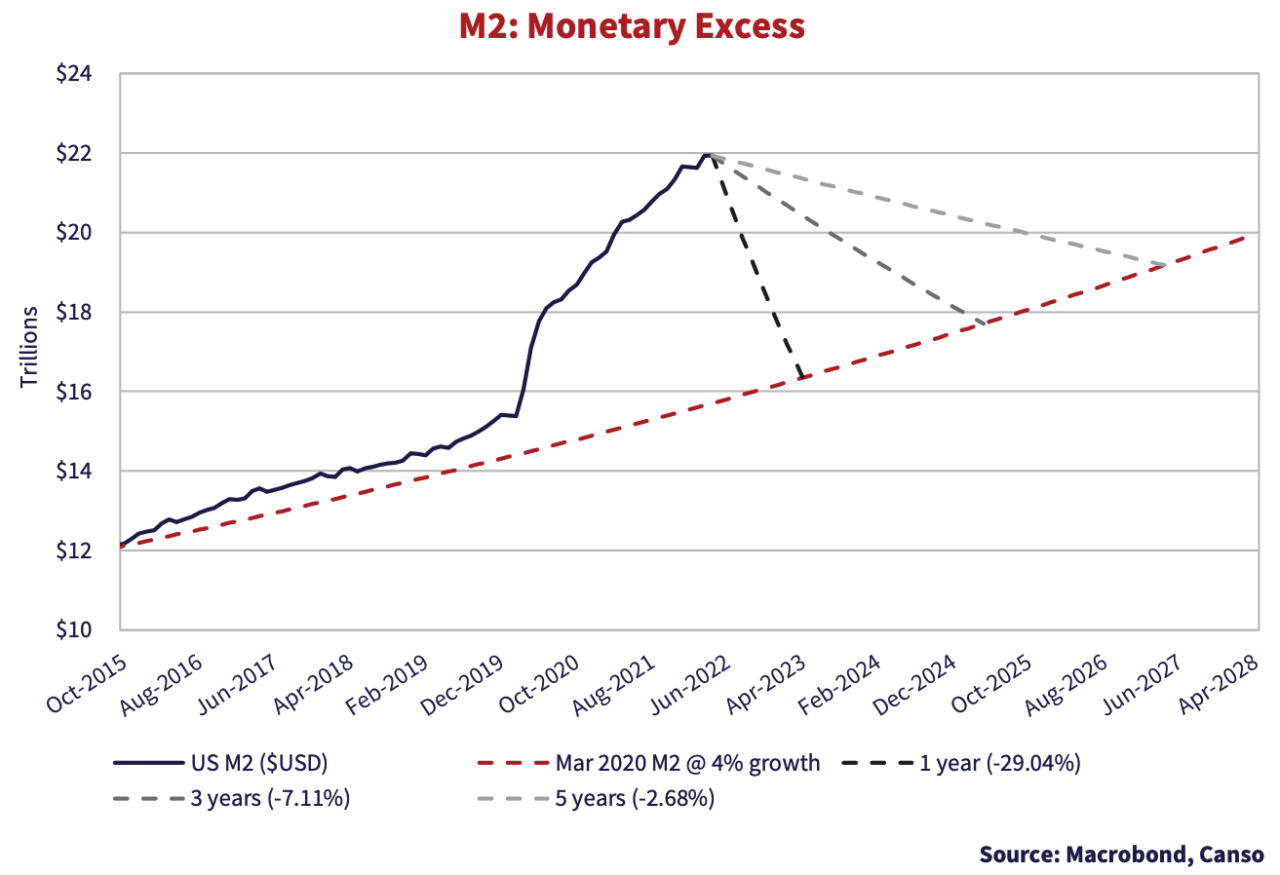
The huge expansion of money supply versus economic activity is quite clear. We have added lines to show what the Fed would have to do to get back to the 4% M2 growth line. It would take shrinking M2 by -29% in one year, -7% over three years and -2% over five years.
Monetary Excess
The problem is that nobody, including the Fed, knows what all the excess money is doing to the economy. It is not coincidence that inflation has soared, but the question is, what will happen going forward? Strict monetarists believe that “Only Money Matters” when it comes to inflation. If they are right, we probably are headed for much higher inflation than markets expect.
Even the Fed is wondering what it should do to get rid of all the excess money it created. Clearly, if the Fed reduced M2 as quickly as it expanded it, the economy would implode. As we’ve seen above, it would take 5 years of reducing M2 by -2% to sop up all the excess money and get the U.S. back to more normal levels of M2 growth. The graph of M2 above shows that the Fed has seldom actually shrunk M2, they have just let the economy grow and therefore have money relatively less available.
Breaking Bad
If the Fed decides on a more gradualist approach, as it did in the inflationary 1970s, then we think inflation will stay at higher levels than the market expects. And what does the market expect for inflation?? The graph below shows the “Breakeven Spread” of the 10-year Treasury bond (nominal) versus the 10-year Treasury Inflation Protected (TIP) note. If the market is efficient, then this should approximate the bond market’s inflation estimate. It also shows the actual year-over-year change in the U.S. CPI.
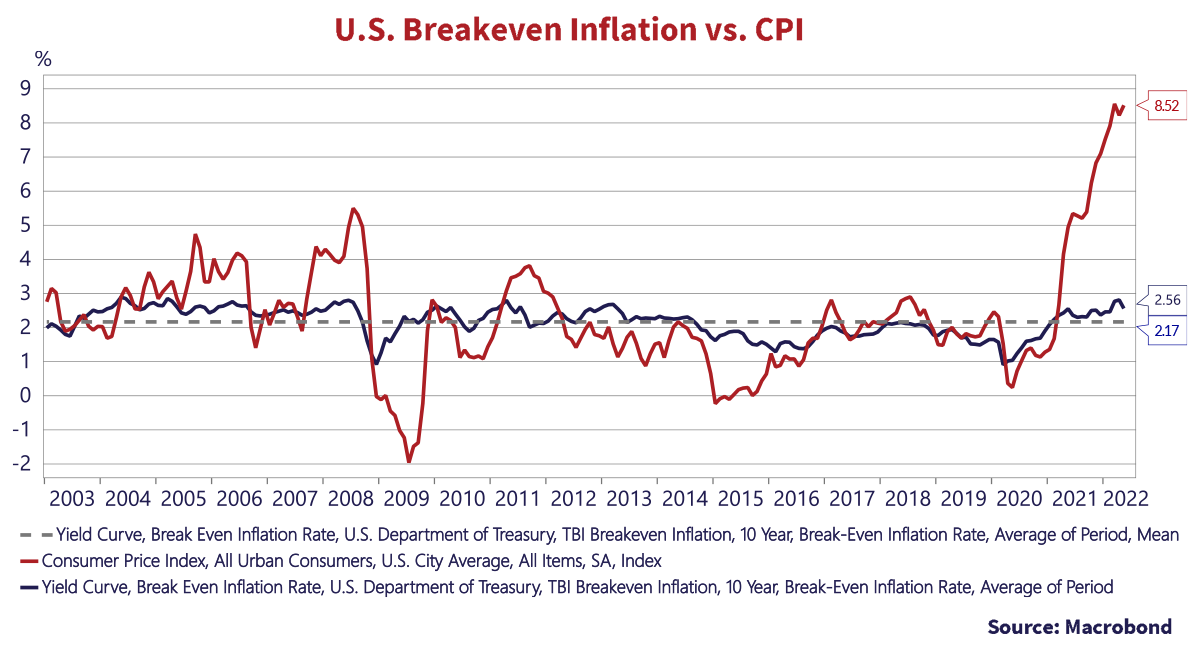
The current breakeven spread is 2.6%, which implies inflation of not more than that over the next 10 years. This compares to actual inflation of 8.5%. It could be lower if investors have built an extra risk premium on nominal bonds for unexpected inflation, but it cannot be higher if markets are efficient, or investors would hold nothing but TIPs. So, the market obviously has faith the Fed will succeed with its current measures.
Demanding Investors
History shows that investors typically demand 1% above inflation for T-Bills and 2% above inflation for 30-year Treasury bonds. If inflation turns out to be the 2.6% that the market is forecasting, that equates to 3.6% on T-Bills and 4.6% on the long 30-year Treasury bond, compared to the current yields of 1.7% and 3.1% respectively. The futures market is pricing in 3.2% for short rates one year out, not much different than the market has impounded. The market is clearly assuming that the Federal Reserve will have things under control, will not have to raise short rates more aggressively and inflation will fall back towards their stated 2% inflation target over the next year.
Don’t Bet On It!
That’s a big bet, given the amount of money created by the Fed in just over 2 years since the Covid pandemic started. Inflation expectations are rising, along with wages and costs for companies. If consumers can pay more, then companies will charge more and once prices and wages are higher, the 1970s showed us how hard it was to stop that upwards spiral. So, it looks to us like we could have the worst of all worlds for a bond investor, higher inflation, higher yields and lower bond prices.
Not Rejoicing!!
The table below appeared in our January Market Observer, which we’ve updated for the first six months of 2022. We commented in January that “The financial markets in 2021 continued to rejoice in the plentiful supply, if not oversupply, of money.” Now the markets are fearful of the removal of money by central banks and the stars of 2021 are getting clobbered. There was no safe haven except for cash. Normally, government bonds go up in price and down in yield when “risk assets” sell off, but this was not the case as the Bloomberg U.S. Treasury Bond Index was down 9.1%.
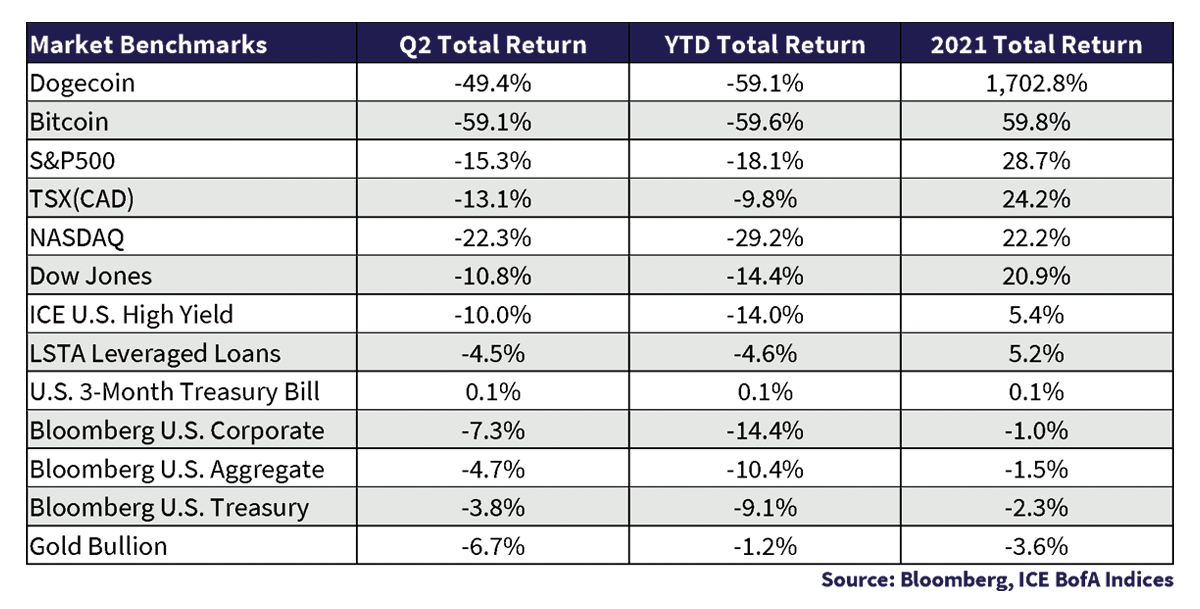
The curious thing is that we are not seeing anything close to panic in the financial markets, except possibly for Crypto and the overvalued Meme and Tech stocks. This makes sense. The discount rate on financial assets is a combination of the “risk free” rate and risk premiums. Most of the damage has been from the rising discount rate, especially on long duration assets like longer term bonds and growth stocks. We have seen government bond yields climb, but we are not seeing anything close to panic or distress in the credit and stock markets, as their risk premium has only increased moderately. Indeed, the LSTA Leveraged Loan Index is only down 4.6% year-to-date, well ahead of U.S. Treasury Bonds and the U.S. Corporate Bond Index.
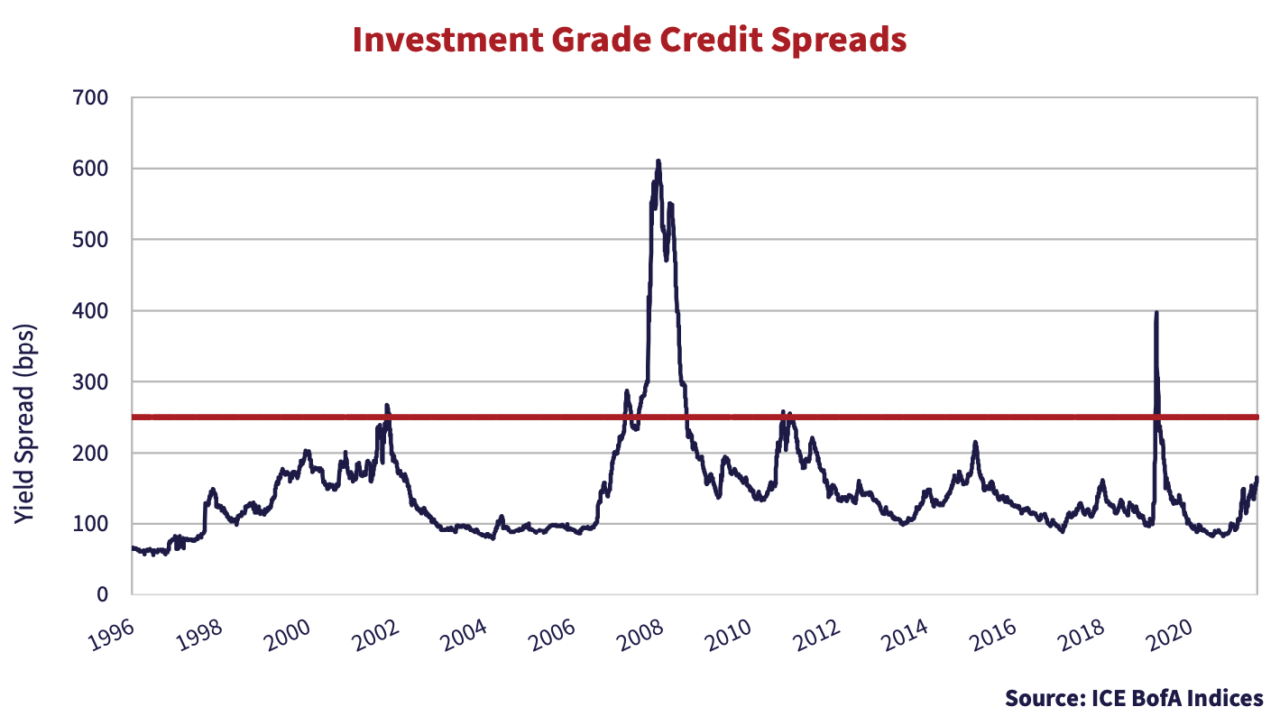
The charts below of the yield spread on corporate bonds tell this tale. The yield spread of Investment Grade bonds are far below the levels of past distressed markets.
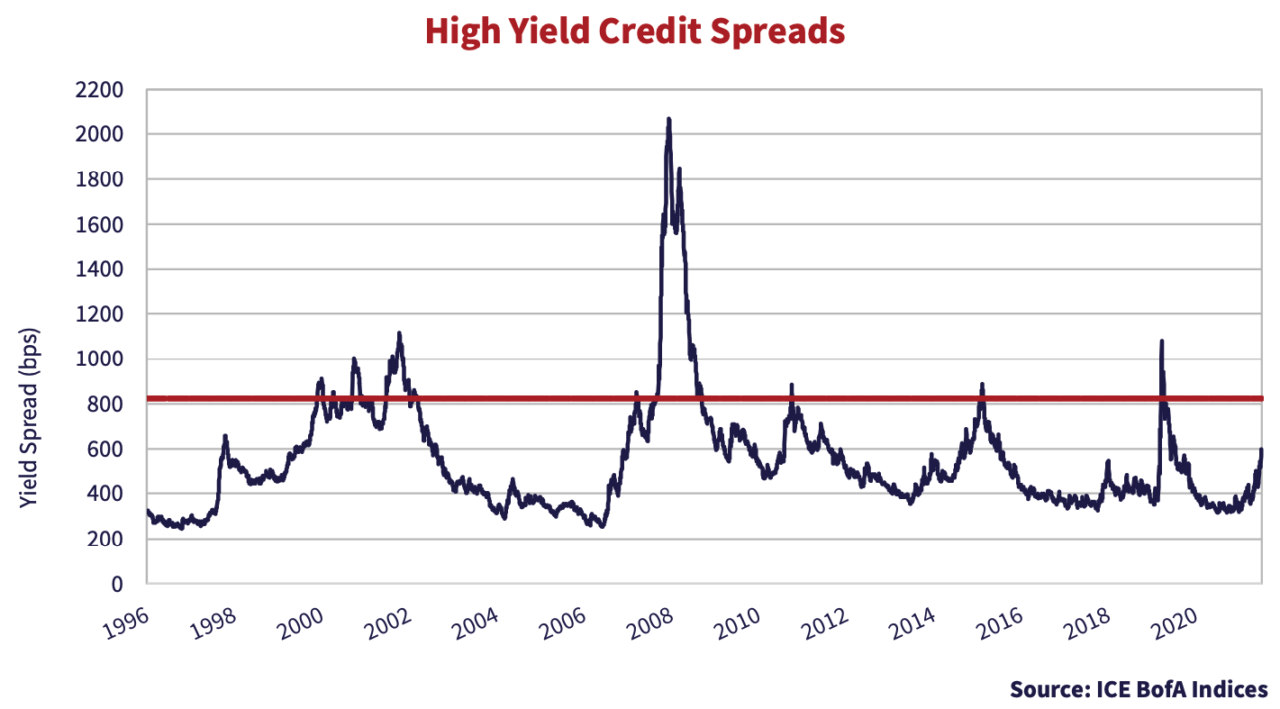
The same is true for High Yield bonds, which have widened in yield spread but are nowhere near prior spread wide levels.
Passing on Aggressive
It is a Canso axiom that the most illiquid and speculative investments fall the most in illiquid markets. We are not seeing this yet and, while many see great value at present in “risk assets”, we believe that the compensation is still not sufficient for the risks we see ahead.
The 2nd Quarter of 2022 closed with falling yields and bond market optimism that the Federal Reserve wouldn’t be as aggressive as it had broadcasted. On the other hand, bonds have rallied several times in the first half of 2022, and then proceeded to sell off again.
We believe that the market is underestimating the amount of tightening that the Federal Reserve and other central banks have to do to get inflation under control. That means less money available and that markets will get much more illiquid.
We see a lot more potential downside than upside at present and prefer to continue keeping our portfolios in higher quality and liquid securities. The last two years have seen the most liquidity injected into the financial system in our careers. We think the reversal of this liquidity will take more time than the markets expect, and this could very well result in a grinding battle of investment attrition that most investors aren’t prepared for.
We are prepared, and like our namesake Canso aircraft, our portfolios are well suited for the heavy weather we see ahead.