

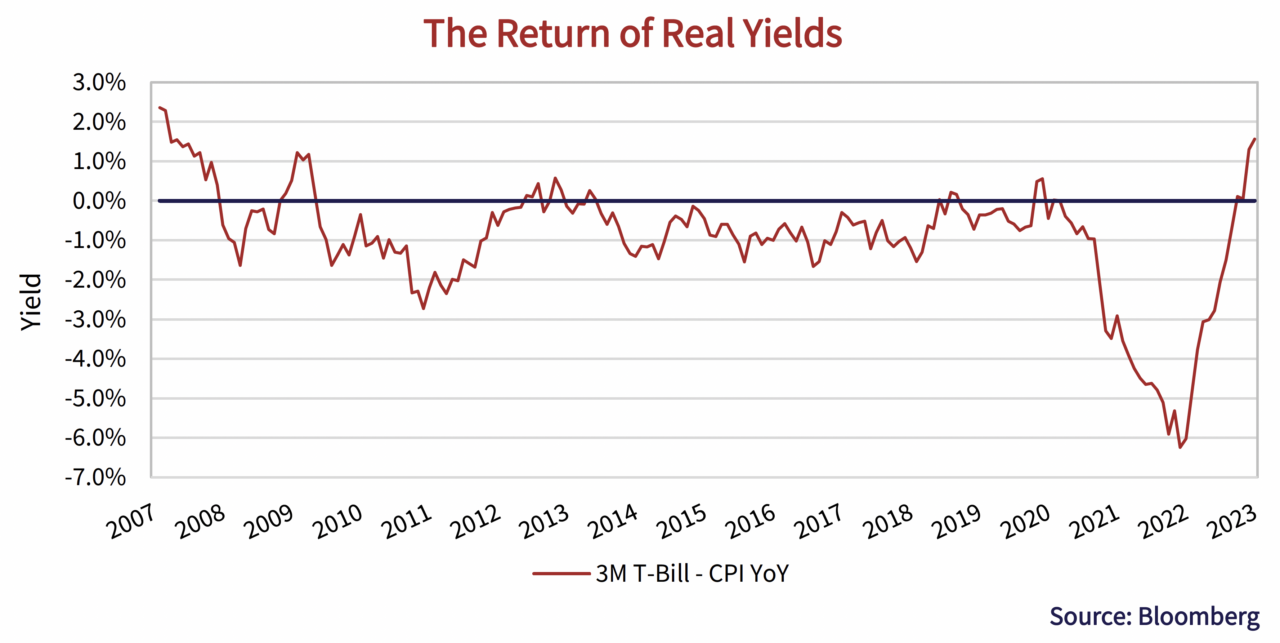
O Canada!
Canadians rejoiced the dramatic victory of Nick Taylor who became the first Canuck to win the Canadian Open since 1954. Meanwhile, Canadian bond investors are celebrating a victory of their own, with the return of positive real bond yields. The May year-over-year inflation reading in Canada was 3.4%, dropping below 4% for the first time since July 2021. In contrast, 3-month T-bills rose to 4.9% to end the quarter. This compares to a T-bill rate of just 0.2% in July 2021.
No, Canada!
It might be surprising to some that reported inflation is back below 4%. According to the Wall Street Journal, “Taylor Swift’s epic “Eras Tour” is on track to become the biggest in concert history, with the potential to gross over $1 billion.” Average ticket prices reported last December on initial sale were $215. If you weren’t lucky enough to get to the front of that line, you can now expect to pay north of $1,000 on resale sites just to get in the door. Despite scheduling over 100 shows across 19 countries, Canada is yet to make the list.
Freeze… Unfreeze
After taking a “conditional pause” during their March and April meetings, the Bank of Canada is back on their rate-hiking kick. On June 7th, the Bank increased the overnight rate to 4.75% while noting “underlying inflation remains stubbornly high”. It appears increasingly likely that an additional hike is on the way.
Look At Us Now
We have once again plotted the yield of the 2-year Government of Canada and U.S. Treasury bonds relative to the overnight rate. At the end of the first quarter, we observed increasing bond market confidence that rate cuts were on the way to deal with the fallout of the regional banking crisis. The second quarter showed us once again that the bond market is not a reliable predictor. The central banks in Canada and the U.S. both raised administered rates and 2-year yields surged.
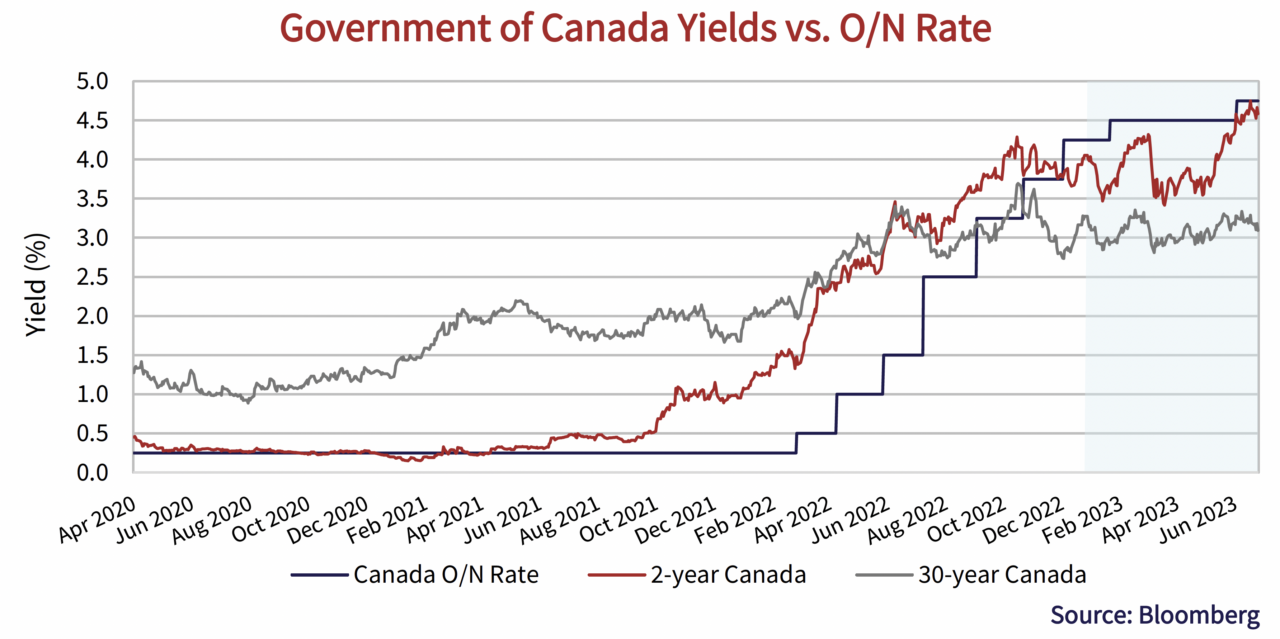
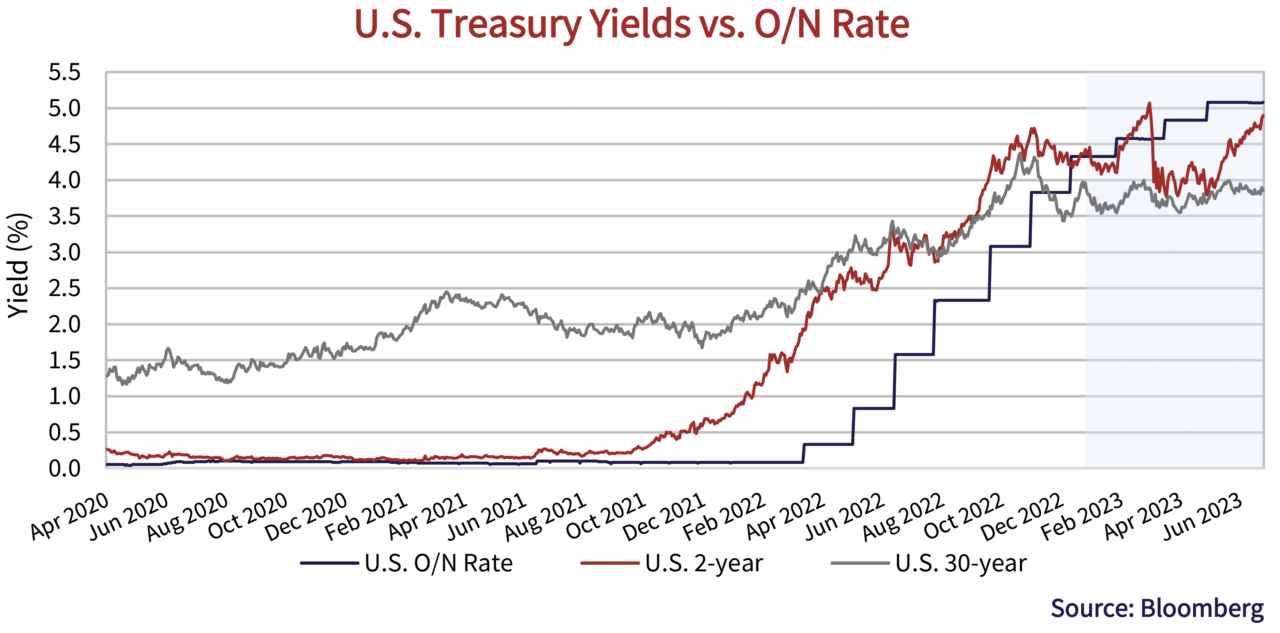
It’s A Long Way To The Top
While the bond market continues to recalibrate its expectations in short term maturities, longer term government bond yields in Canada and the U.S. have been much more steadfast. We have added the 30-year yield to the graphs above to illustrate. Longer term bonds have rebuked the surge in the short end this year. In Canada, the 30-year yield modestly rose in the past quarter and now sits right where it started the year. The U.S. long bond yield has pushed only slightly higher this year. The growing inversion in the yield curve has led to outperformance of longer term issues this year.
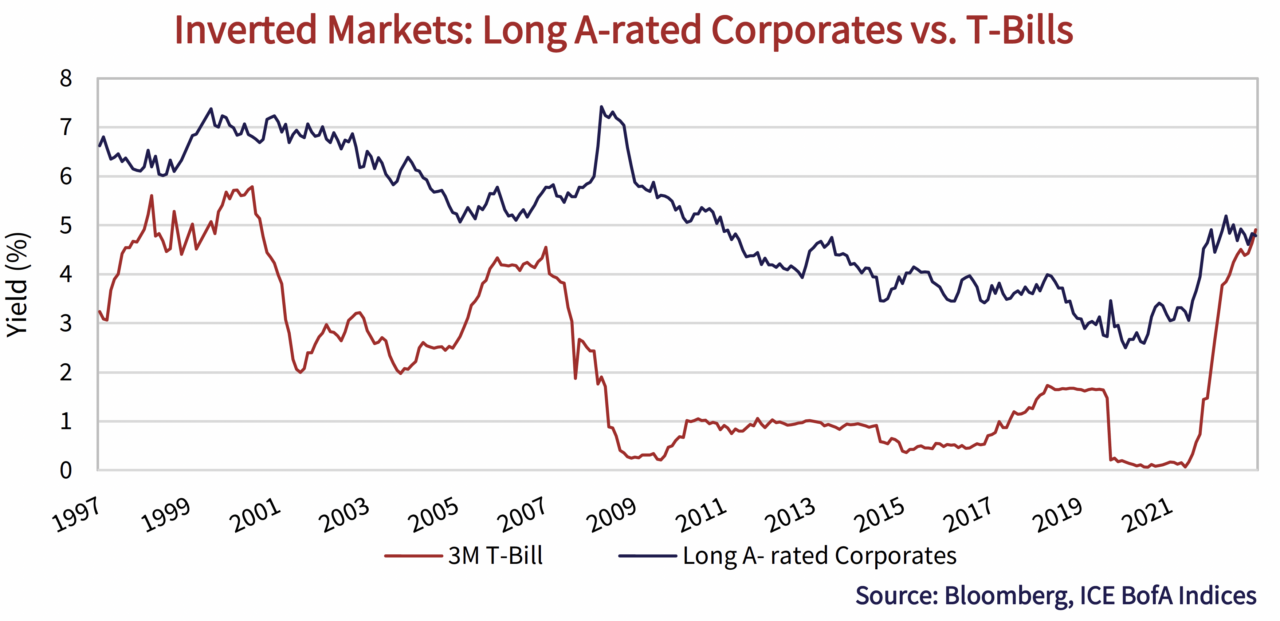
Longing for Yield
With short rates rising and long rates steady, the yield curve has moved to its most inverted position since 1990. One consequence of this inversion is that 3-month T-bills are now yielding more than long term A-rated corporate bonds. Surely investors should receive compensation above the “risk-free” rate when taking on “not risk-free” credit exposure. For some, the fear of missing out, or risk of losing out, on falling yields is just too much.
Calmer Waters
The U.S. regional banking crisis appears to be somewhat contained, or at the very least, out of the headlines. We did see a further bank failure, with J.P. Morgan taking over troubled lender First Republic Bank on May 1st. Later that week, TD Bank and First Horizon mutually agreed to call off their merger. Despite receiving a $200 million break fee, at $12 per share, First Horizon’s stock remains less than half the $25 takeover price TD offered to pay.
A Hard Bargain
On June 12th, the UBS acquisition of Credit Suisse was completed after sealing an agreement with the Swiss government to cover 9 billion Swiss francs of losses that it could incur as a result. UBS is expected to cut more than 30,000 jobs over the next year, representing more than half the 50,000 full-time equivalent employees they gained from Credit Suisse.
As a result of the takeover, Credit Suisse’s senior unsecured notes that were issued out of the Parent, Credit Suisse AG, became direct obligations of UBS Group AG. The union removes any differences and credit markets have adjusted accordingly, which can be seen in the spread chart below.
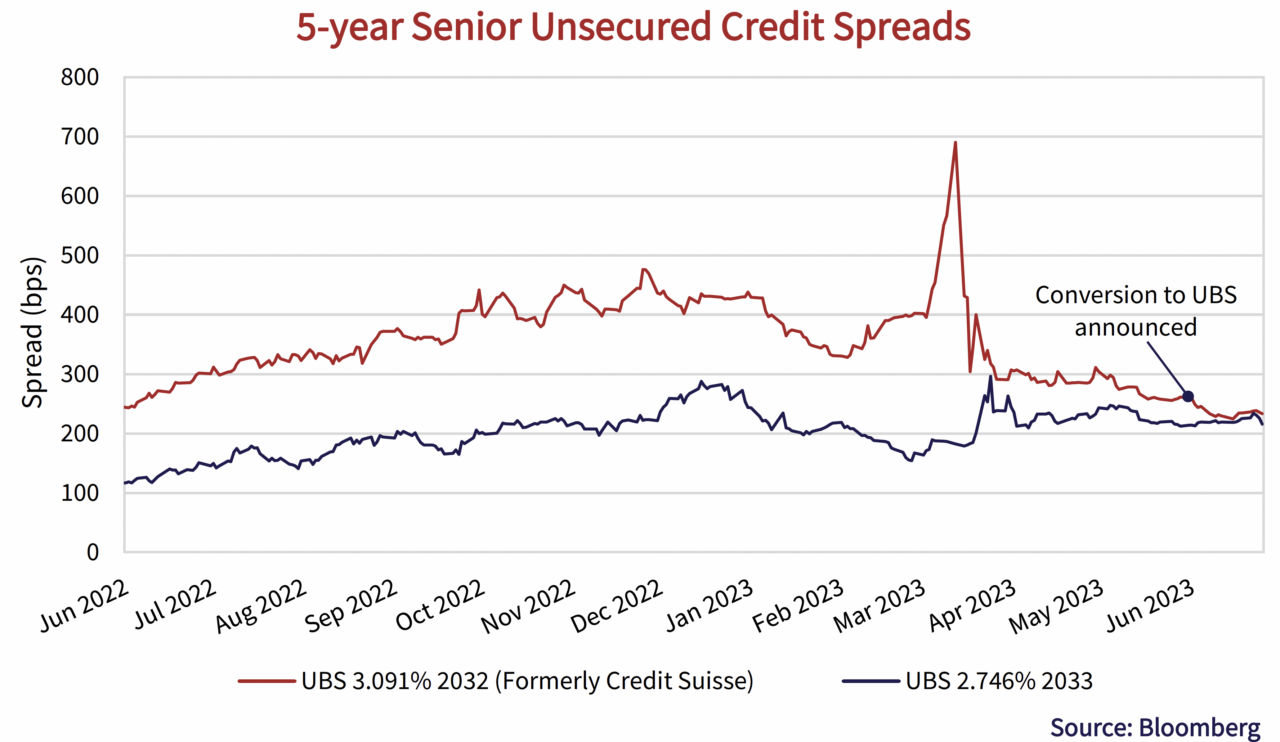
While the outcome is a happy one for investors at the top of the capital structure, holders of the AT1 securities that were wiped-out have turned their focus to lawsuits against Switzerland’s banking regulator, FINMA. The dichotomy in outcomes is an important reminder of the importance of understanding and properly pricing credit risk.
The Bottom Line
Bond markets weren’t able to build off their positive start to the year as high-quality bonds were back in the red during the second quarter. Volatility in government bond yields continued to prevail, particularly among the shorter term maturities that move with interest rate expectations. Credit spread tightening and higher running yields helped investment grade corporate bond indices mitigate the damage.
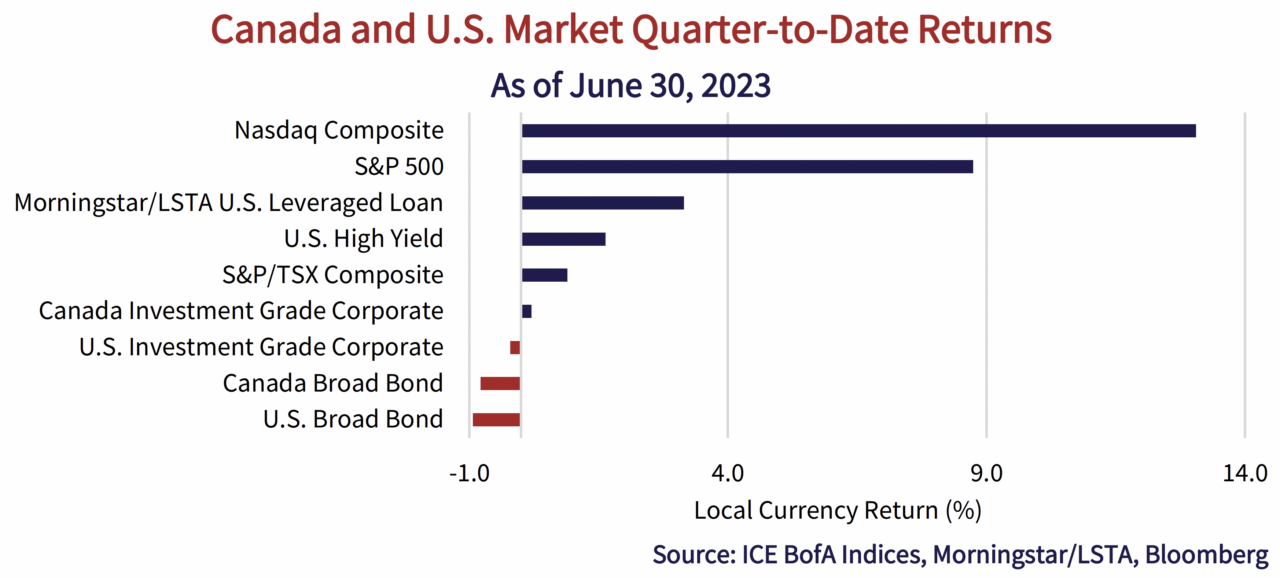
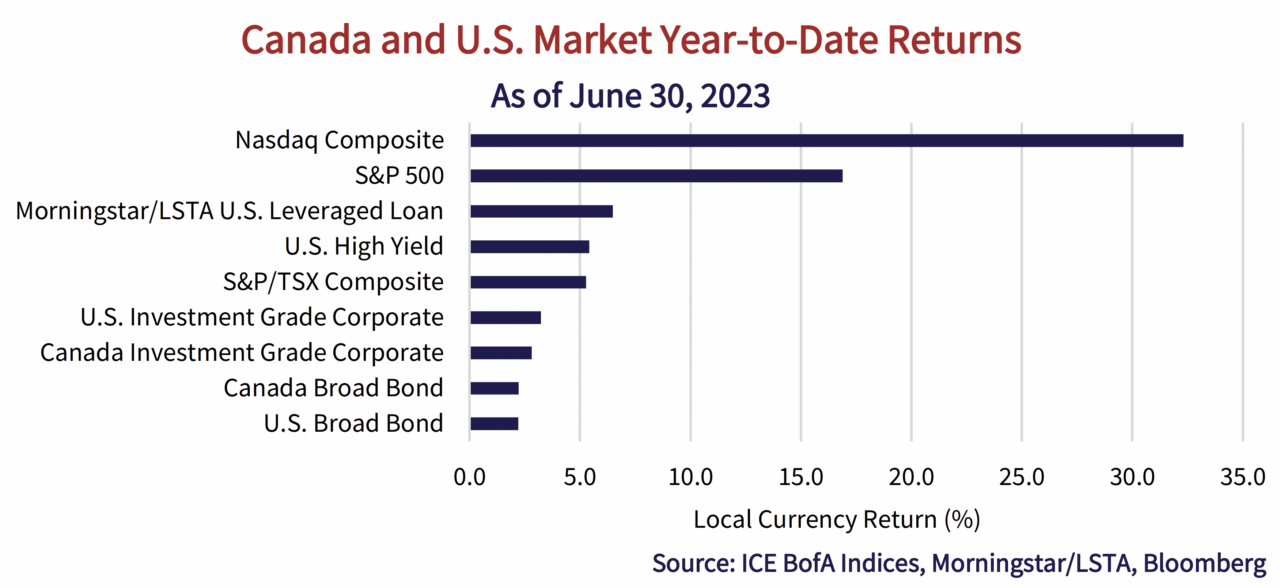
High yield bonds and leveraged loans outperformed in the period. Credit spreads on the lowest quality debt narrowed without regard for tightening market conditions or much increased default risk. Floating rate leveraged loans outperformed fixed rate high yield as the coupon payments on loans reset higher with rising benchmark rates. Extending the “risk-on” theme, equity markets continued their positive march forward, led by the tech-heavy Nasdaq and investor optimism about the potential of artificial intelligence.
Corporate Action
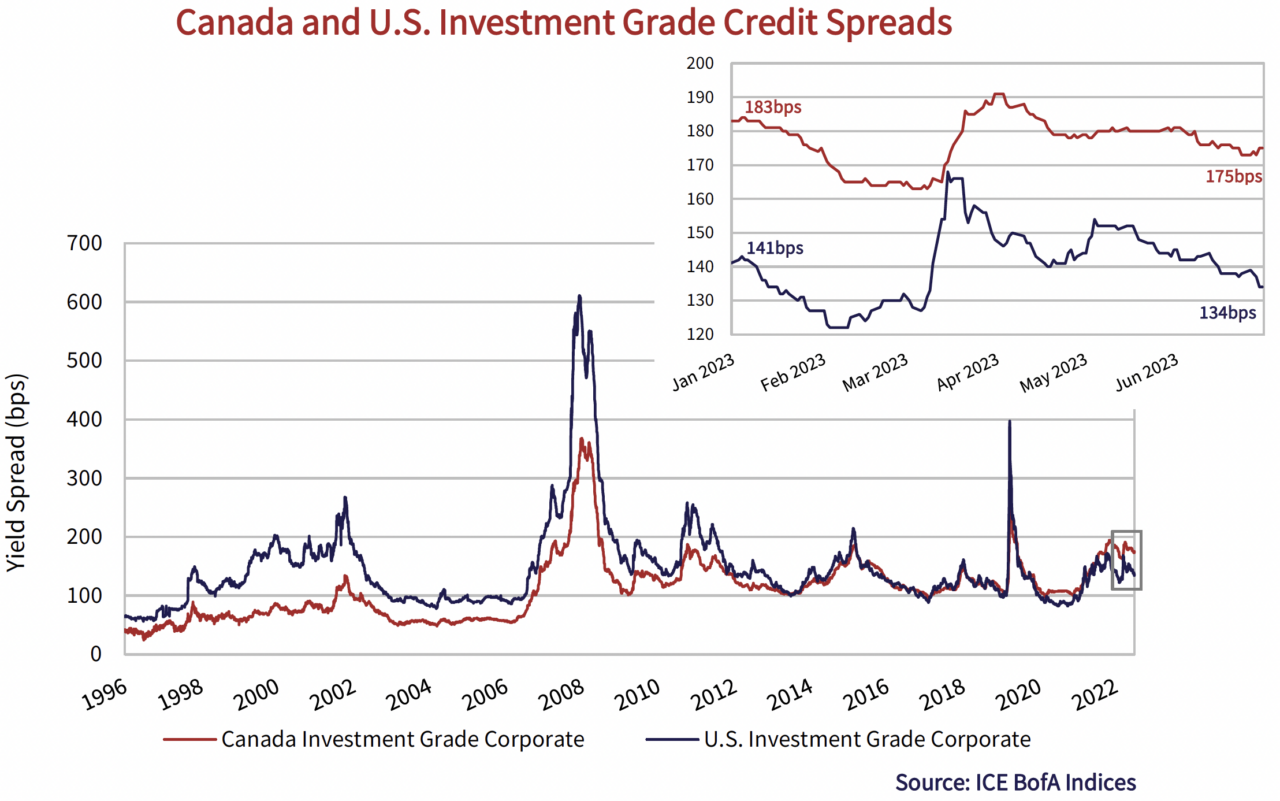
The graph below plots historical credit spreads in Canada and the U.S. based on the ICE BofA indices. While both indices are tighter this year, investment grade spreads remain well off post-pandemic lows and the best relative value continues to exist within higher quality corporates.
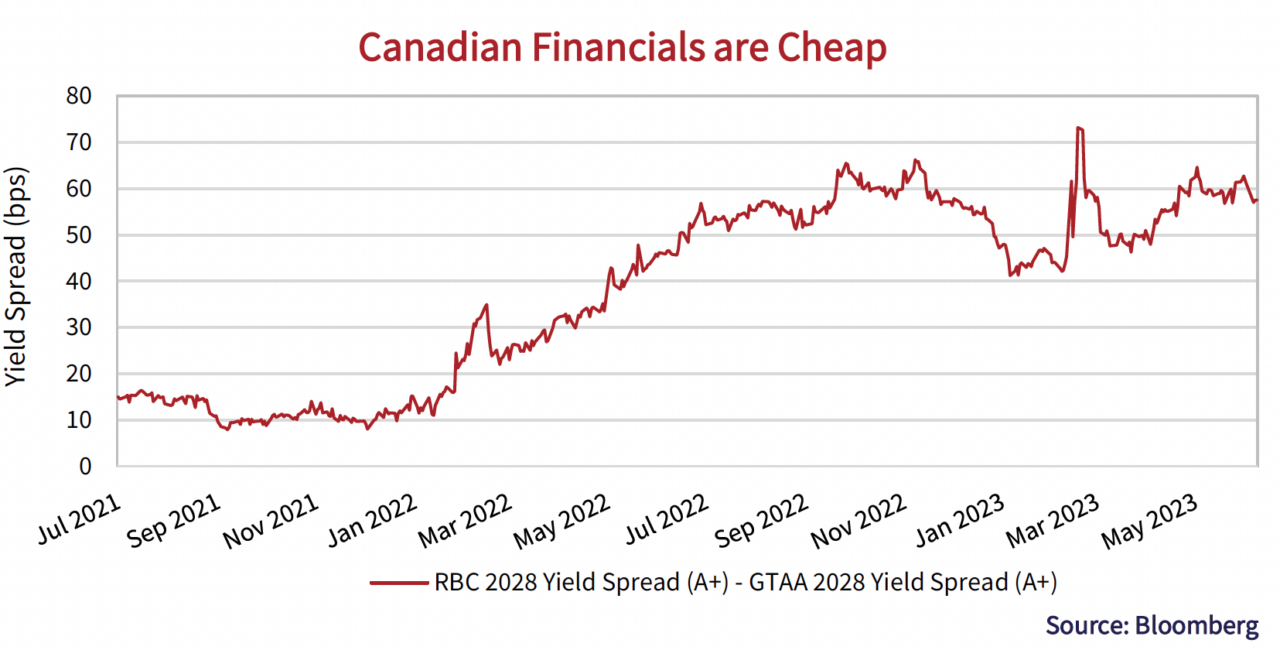
Financially Dependent
Canadian investment grade markets are dominated by Financials. The Banking sector makes up 33% of our market versus only 18% in the U.S. Last year, the Big Six Canadian banks flooded the domestic market with $61.7 billion worth of new corporate bond issuance, which more than doubled their volume of the prior 2 years. Through the first half of 2023, they have added another $19.1 billion to the tally.
As a result of this deluge, Canadian senior bank spreads have widened markedly over the past 18 months, dragging the overall Canadian index wider than its U.S. counterpart. In addition, senior bank bonds have also widened relative to similar rated corporates. We can see in the chart below that A+ rated Royal Bank of Canada previously traded in line with A+ rated GTAA – only 0.1%, or 10 basis points, higher. RBC now trades 60 basis points back of GTAA, meaning it is much more expensive for RBC to borrow on a relative basis. In fact, RBC now trades closer to BBB+ rated BCE Inc.
Meta-morphosis
More broadly, investment grade new issuance continues to hum along at a healthy pace. In the second quarter, there was $300 billion of investment grade issuance in the U.S. and $27 billion in Canada. The second largest issue in the period came from Facebook’s parent Meta Platforms Inc. The A+ rated issuer completed its second ever bond deal, raising an eye-watering U.S.$8.5 billion across 5 separate tenors – the longest of which was a 40-year issue priced 1.92% higher than risk-free Treasuries.
It’s tough to predict what any company will look like in the year 2063, let alone a fast-paced technology company. But with about half of the world’s population using one of its apps: Facebook, Instagram and WhatsApp, it’s safe to say the company will have some optionality in the years to come.
Case in point: 2 months following the bond issue, Meta launched an app called Threads, a direct competitor to Twitter. It took Threads less than 5 days to sign up 100 million users – a truly astonishing feat. This compares to 238 million monetizable daily active users Twitter reported last July (16 years after it was founded) before being taken private. Despite the physical combat challenges being teased over social media between Zuckerberg and Musk, it appears that “Zuck” can pack a punch much stronger than his 155lbs frame would indicate.
Appetite For Destruction
High yield investors benefitted from tightening credit spreads, which added capital appreciation to already higher prevailing yields. The graph below plots the credit spread of the ICE BofA U.S. High Yield Index. Spreads finished the quarter 49 basis points tighter and all but erased the impact of the regional banking crisis in March. For the year, credit spreads are 66 basis points tighter than where they started.
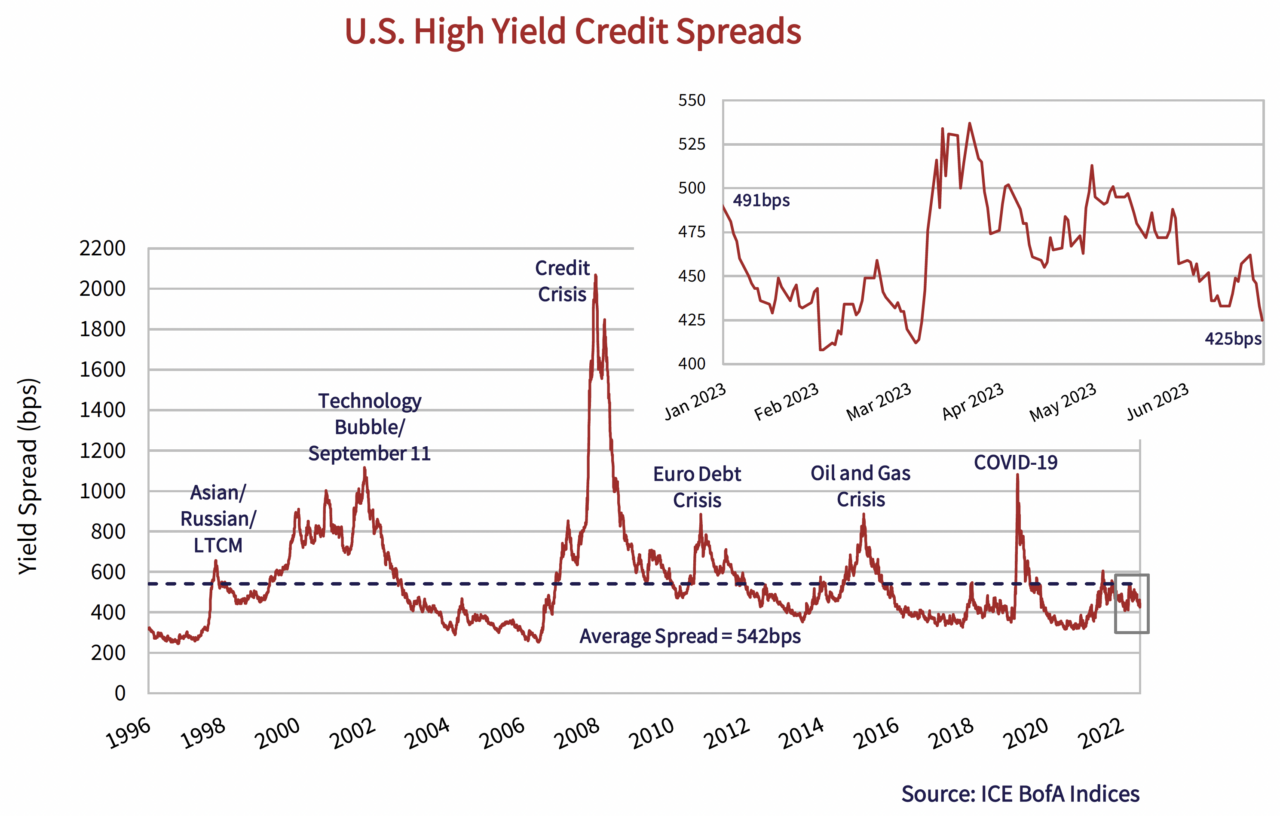
The lowest quality issuers have outperformed through the first half of 2023. The CCC-rated segment of the ICE BofA U.S. High Yield Index saw credit spreads move 202 basis points tighter versus B-rated issues at 75 basis points and higher quality BB issues at 36 basis points. This translates to a 9.8% year-to-date return for the CCC segment, outperforming B at 5.7% and BB at 4.2%.
If the inversion in the yield curve is signaling recession and lower rates, the high yield market did not get the message. Tightening credit spreads have pushed further inside of the historic average and further away from cycle peaks. At current valuations, we continue to believe that outside of some special situations, there is not enough compensation for the risk.
When I Come Around
New issuance in the high yield bond market continues to see a revival from the lows of 2022. After a pause in March, issuance regained life through the second quarter alongside improving market sentiment. The tally of new issue volume this year is already closing in on the full year total seen last year. J.P. Morgan calculates gross new issuance at U.S.$96 billion in the first half of this year, compared to U.S.$106 billion for all of 2022.
This lift in activity is relative to the lowest issuance total since the global financial crisis in 2008. Within a broader historical context, new issuance remains modest, particularly when stacked up against successive record-breaking years in 2020 and 2021. We once again point to the graph below of rolling 6-month new issuance in the U.S. high yield market to provide this context. After a blip in March, the line has continued an upwards trend but remains modest.
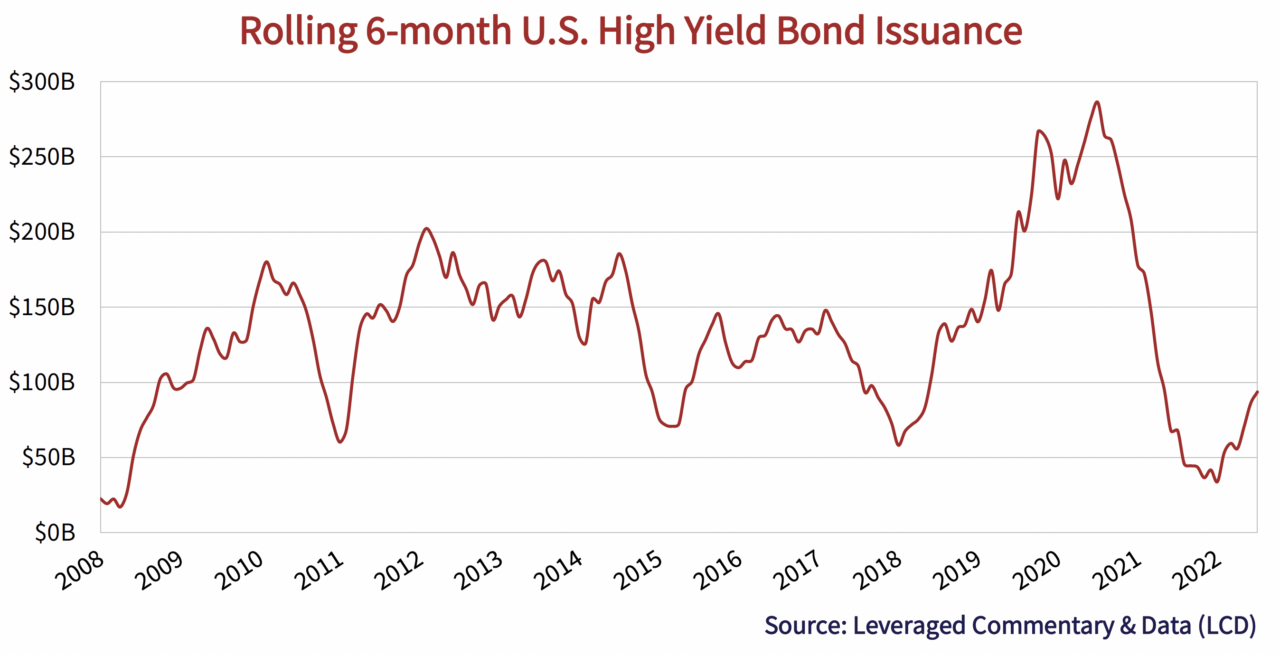
It is also important to consider that the U.S. high yield market has grown substantially since the lows of 2008 presented in the graph above. At U.S.$458 billion, the 2008 high yield bond market was a fraction of the size of the U.S.$1.2 trillion market today. Despite the pickup in activity this year, we continue to believe that relatively modest new issuance has been supportive of credit spreads.
Safety Dance
Another telling trend is that high yield issuers continue to turn to secured issues this year. Leveraged Commentary and Data (LCD) calculates secured high yield bond issuance at U.S.$56 billion this year, which remains comfortably ahead of unsecured issuance. According to their research, unsecured issuance has been higher in every year on record. This reversal in trend has been largely driven by lower quality issuers that have had to offer security to fulfill their funding needs or refinance looming near term maturities.
Higher yields in the institutional leveraged loan market are also pushing issuers to refinance with relatively lower-cost bonds. According to LCD, average new issue yields in the loan market ended the period at 9.7%, while the average new issue yield in high yield bonds is 8.4%. Both numbers are markedly higher than the 2021 historic lows. LCD tracked U.S.$14 billion of bonds to take out loans in the first half of the year, the largest of which was the insurance brokerage HUB International, which issued U.S.$2.175 billion in bonds to help refinance loans coming due in 2025.
Let Me Down Easy
Default activity also continues to tick up in the high yield bond and leveraged loan markets. The past quarter saw three of the five largest defaults this year, which included Envision Healthcare (U.S.$10.3 billion), Wesco Aircraft Holdings (U.S.$3 billion) and most recently, ATM maker Diebold Nixdorf (U.S.$2 billion). According to data from J.P. Morgan, 26 companies have defaulted this year, for a total of U.S.$15.7 billion in bonds and U.S.$25.4 billion in loans. An additional 19 companies have completed distressed exchanges, totaling U.S.$10.9 billion. The combined total has now surpassed last year’s full-year total.
Despite increasing defaults, 12-month rolling default rates remain below the historic average and are quite modest relative to cycle peaks. We continue to believe that with tighter market conditions, the ongoing need to refinance historically low-cost debt, as well as the immediate impact of higher rates on floating rate loans, will likely continue to put pressure on defaults.
The Song (Still) Remains the Same
Another quarter has passed and yet again our bond market song remains the same. Bond investors have once again swung their expectations of central banks. An inverted government bond yield curve still contradicts expensive valuations within high yield bonds and leveraged loans. Yields on high quality and liquid bonds continue to be an attractive place to deploy capital while we wait for valuations on more speculative corporate issues to provide better compensation for their risks. And finally, we have conviction that tightening credit markets will lead to better opportunities, and that is where our investment focus remains.