

Steep Learning Curve
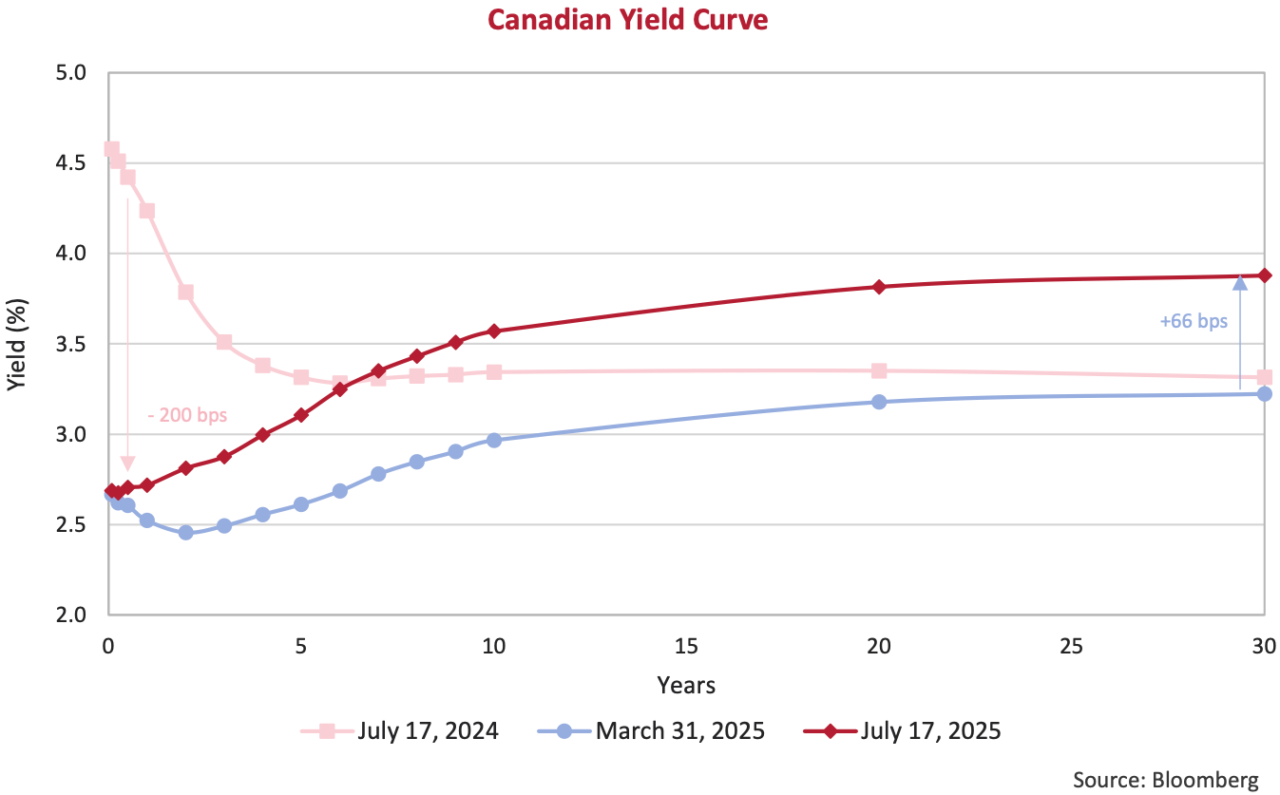
Interest rates have been on the rise since the end of the first quarter, particularly in the long-end of the curve. From March 31st until time of writing, Canadian long bonds have risen 66 basis points (bps) while their American counterparts are up 44 bps, translating into price declines of 13% and 7%, respectively. The yield curve has gone from deeply inverted 12 months ago, as the Bank of Canada embarked on their rate cutting journey and investors priced in what they believed the future would look like, to something much steeper today. Front end rates have dropped 200 bps while rates beyond 7 years in term have risen, largely due to recent policy decisions. As we have written in several Canso Market Observers past, politicians have learnt that “more money is always more popular than less”.
Elephant in the Room
Deficit spending is undoubtedly the consensus of Western governments. Donald Trump and his Republican Party are no exception. Control of the White House and both chambers of Congress allowed President Trump to successfully pass his “One Big Beautiful Bill Act” which will extend tax cuts introduced during his first term. Economists expect the annual deficit to reach 7% of GDP in 2026 and the Congressional Budget Office (CBO) projects that the U.S. debt will surpass the historic high it hit at the end of World War II, 107% of GDP, in 2029. The CBO further projects the debt load to grow to 157% of GDP by 2055, if the current trajectory remains.
The bond market has taken notice, pushing long interest rates higher not only in North America, but in Europe and Japan as well. In May, Moody’s became the final of the large 3 credit rating agencies to take away the Government of the United States’ AAA rating. Moody’s stated:
“Successive U.S. administrations and Congress have failed to agree on measures to reverse the trend of large annual fiscal deficits and growing interest costs. We do not believe that material multi-year reductions in mandatory spending and deficits will result from current fiscal proposals under consideration.”1
In Canada, newly elected Prime Minister Mark Carney inherits fiscal books deeply in the red. Despite this, he is signalling significant capital investment from the federal government to invigorate a weary economy. Details to follow. Across the pond, the U.K. abandoned £5 billion in welfare reforms at the last minute, which should bring a tear to any responsible conservative’s eye. And even the Germans, notable fiscal stalwarts, are looking to remove borrowing caps and introduce a €1 trillion stimulus plan.
Stepping Back
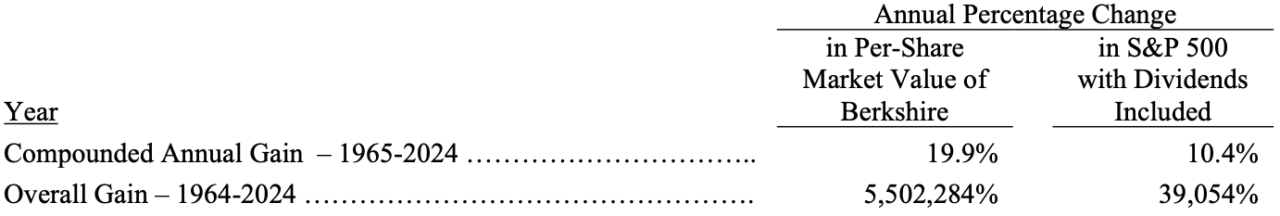
At Berkshire Hathaway’s annual shareholder meeting in May, Warren Buffett announced that he would be stepping down as CEO at the end of this year. The 94-year-old will remain Chairman of the US$1 Trillion market cap company and will be succeeded as CEO by Alberta-born Greg Abel. We step back to appreciate a track record that may never be replicated due to both its longevity and superiority. From 1965 through 2024, the Oracle of Omaha reports a compounded annual gain of 19.9% versus 10.4% for the S&P 500, dividends included. Over 60-years of compounding, we can see how stark that differential becomes in the “Overall Gain” below.
Early Retirement
On July 7th we said goodbye to a ‘good little bond’ as LATAM Airlines called their 13.375% senior secured notes due 2029 at the “make-whole” price. This was the last remaining issue outstanding from the company’s three-tranche bankruptcy-exit financing done in October 2022.
Impacted by pandemic lockdowns and lacking government support, the Chilean airline filed for bankruptcy protection early in the pandemic. The two-year-plus restructuring process allowed the company to reduce operating expenses, streamline its fleet, renegotiate supplier contracts and right-size its balance sheet. Despite improving its operating and financial position, the company came to the market at a difficult time. In October 2022, inflation was high, interest rates were rising after 40-years of declines, and equities were firmly in bear market territory.
Coming to the market at an inopportune time for the borrower proved lucrative for the lender. The 2029 notes we purchased were issued at a price of $93.103 to yield 15%. Security backing the bonds included the airline’s frequent flyer program, cargo business and brand/Intellectual Property (IP). Important to this investment was also protecting its economics through appropriate call protection. As investors, our job is not to avoid risk, but to ensure that we are compensated for the risks we take on. And if we risk our clients’ capital in times of uncertainty, we don’t want to be called away at par in 6-months if the business or the markets improve.
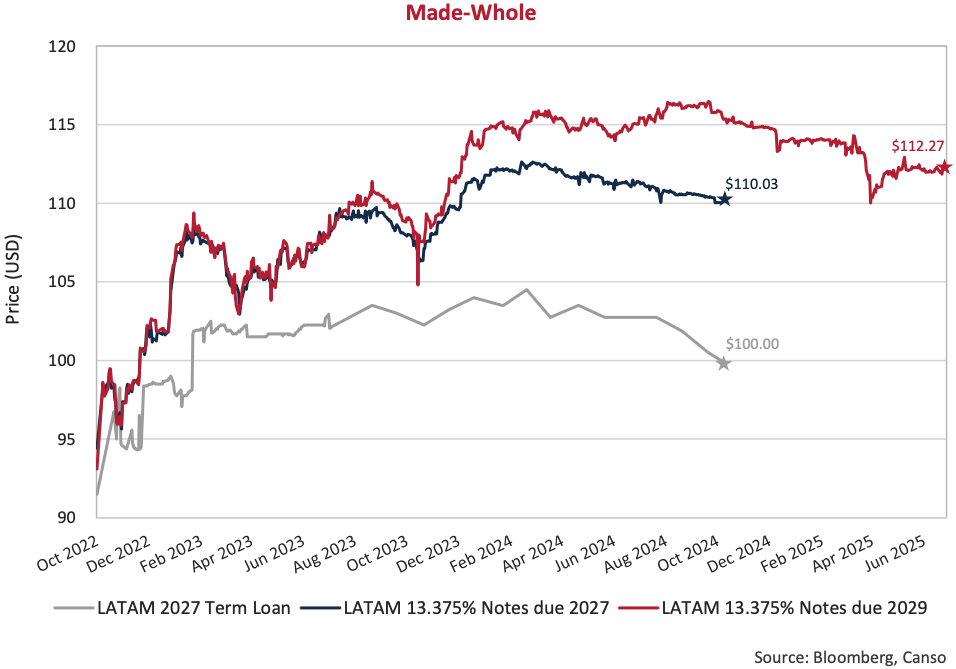
And improve they did. LATAM Airlines emerged from bankruptcy at the end of 2022 into a resurgent travel market, allowing the company to quickly return to profitability. The three-tranche financing included a 2027 bond and a 2027 syndicated term loan in addition to our 2029 bond. The 2027 maturities carried a 2-year non-call protection and were called at first opportunity last October. Meanwhile, the 2029 bond carried an additional year of protection, granting us an extra 12 months receiving a ‘not so little’ 13.375% coupon, at which point they would then be callable at $110. LATAM is taking advantage of favourable markets and paying out the full economics early. The company was able to refinance the 2029 issue with a 2031 secured note that carries a much lower coupon of 7.625%. The company has almost halved their interest costs, going from 15% to 7.625%, in a little under 3 years. In addition, they have reduced the collateral backing the new notes, releasing some of the cargo business assets from the security package. A terrific outcome for the borrower, but less attractive from our perspective. The credit cycle is alive and well.
The Bottom Line
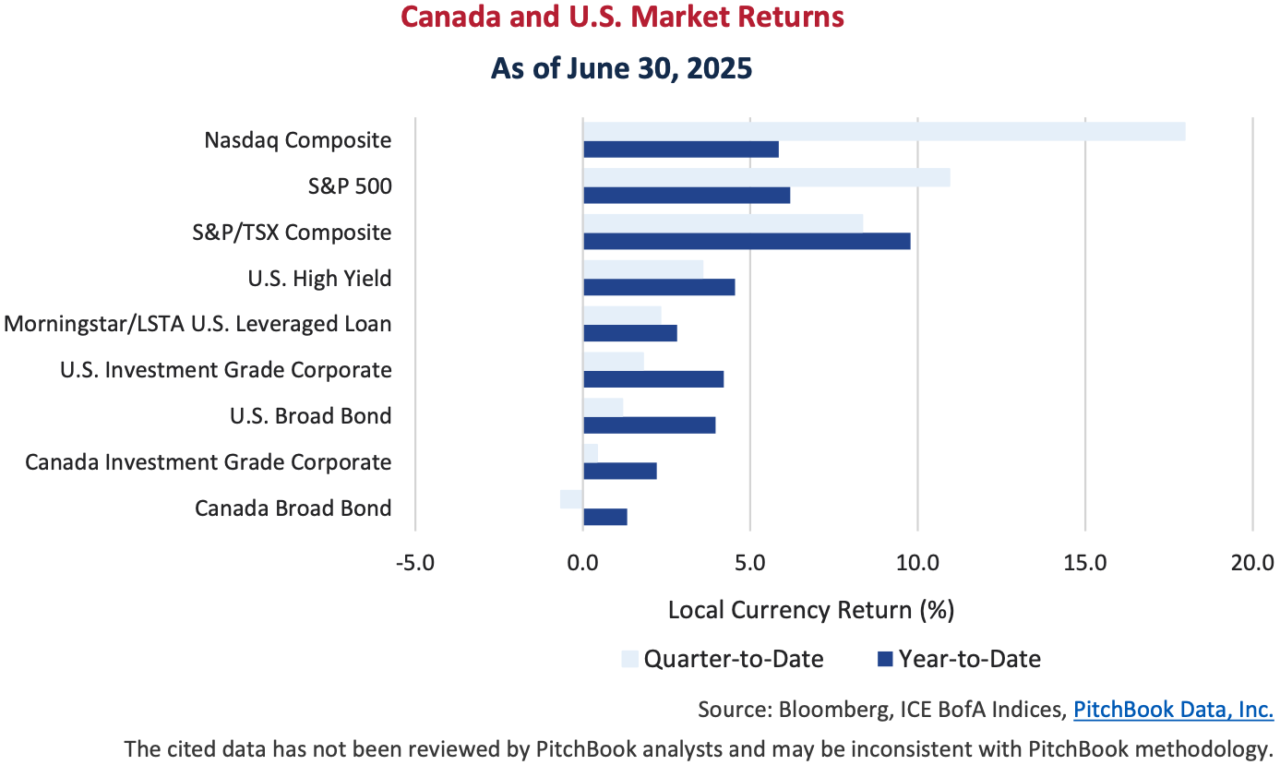
It was a rocky start to the second quarter for markets, with Trump’s April 2nd Liberation Day tariff announcements sending equities into almost bear-market territory. However, reprieve came with a 90 day pause and sentiment improved as investors priced out worst case scenarios on trade. By the end of the quarter, financial market performance was positive almost across the board. Equities outperformed bonds, with growth stocks and mega-cap tech stocks doing particularly well. A strong earnings season helped the Magnificent Seven to recover their price declines from the prior quarter. To a lesser magnitude, corporate bonds also benefited from a more favourable market environment as credit spreads narrowed. Government bonds were negatively impacted from a steepening yield curve, leaving the Canadian Broad market negative over the quarter.
Corporate Action
Within investment grade corporate bond markets, the volatility was short lived. It didn’t take long for credit spreads to reverse course and tighten back in towards the lows. In Canada, spreads began the year at 114 bps before relenting to the uncertainty and reaching a wide of 145 bps on April 7th. Since then, spreads have steadily marched back and are now inside of where they began the year. The result was similar in the U.S. market, moving from 83 bps to a wide of 122 bps on April 9th, and then tightening all the way back to 82 bps. The appetite for yield in high quality credit remains resilient.
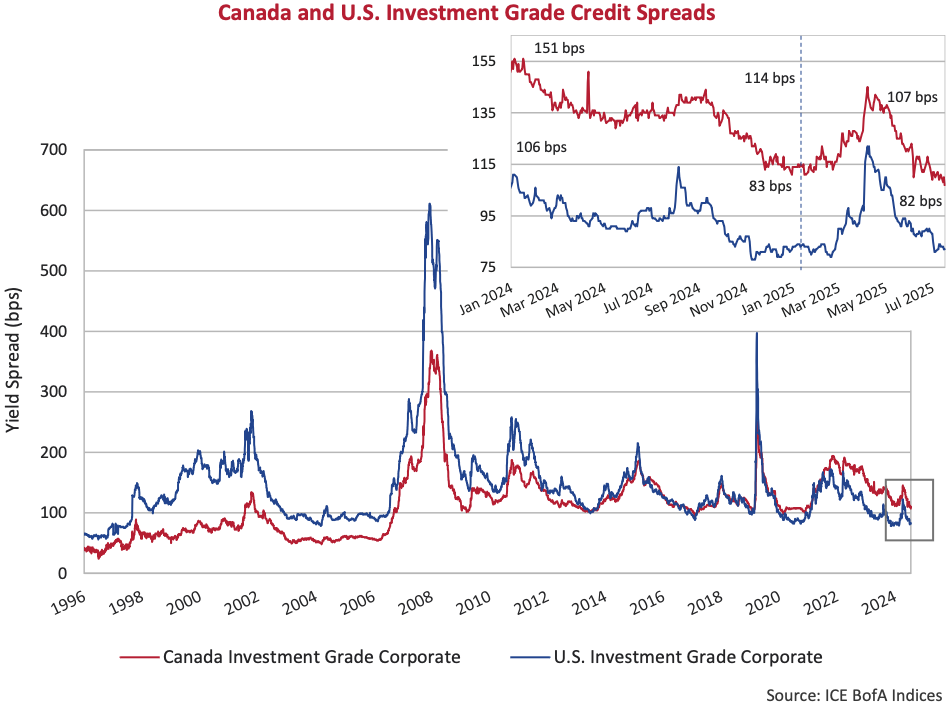
Risk premiums for investment grade bonds in the U.S. are now the tightest they have been since 2005. The difference is that in 2005 the index had about 10% less in BBB rated bonds than it does today (35% vs 45%). At the end of June, the spread of the BBB component of the Index stood at 110 bps, which is 76 bps inside of its historic average. BBB rated bonds in the U.S. are also expensive relative to higher quality A rated bonds. Historically, you should expect to receive around 64 bps in additional credit spread for BBB over A rated. The difference is now just 35 bps as investors demand less and less compensation for the added default risk.
Tel-Us Your Thoughts
BBB bonds continue to outperform in Canada as well, particularly in the long-end of the credit curve. In January, we first plotted the credit spread of a long BBB-rated Enbridge Inc. issue to make the point. Valuations are now more expensive than they were then. This quarter we shift our attention to the telecom sector and highlight the continued outperformance with a BBB-rated Telus bond. This Telus 4.4% bond due 2046 was issued at a 243 bps spread in 2015 and has rarely traded near the 200 bps level. We can see from the chart below they broke through this level late last year and now trade well inside of that bogey. The story is similar for many BBB issuers. The spread of the long BBB Index now sits at 159 bps, 54 bps inside its long-term average of 213 bps.
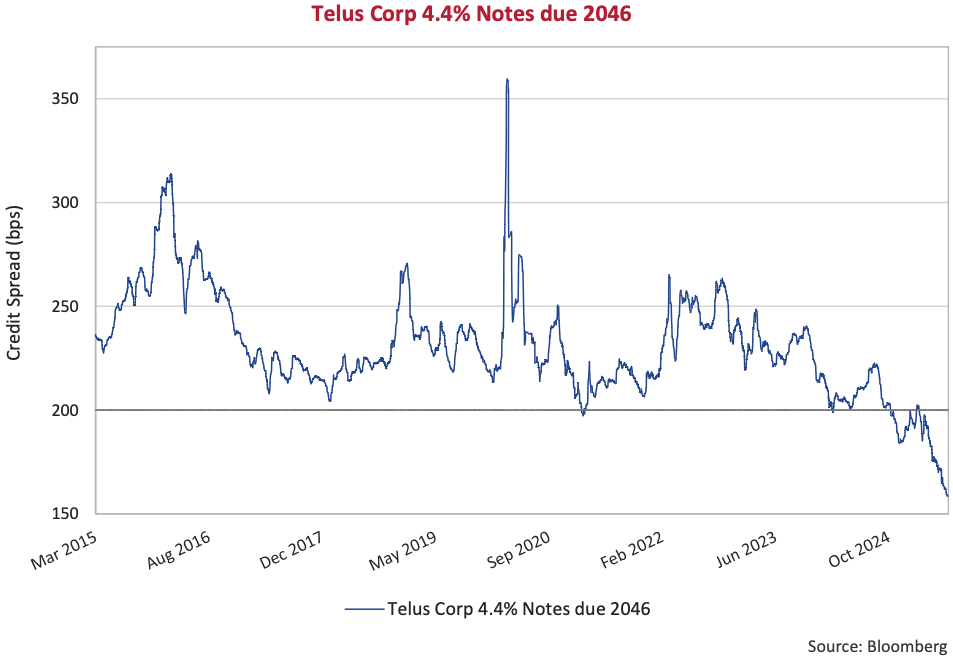
For Telus, this isn’t necessarily a story of improved credit fundamentals as the company continues to carry 3-4x leverage in an industry that is characterised by intense competition and recurring capex spend. Rather, it is a story of optimistic markets and financial engineering. Supporting the improved pricing, Telus completed a successful tender offer in June. The company replaced $1.376 billion BBB rated senior notes due between 2046 and 2051 with proceeds from BB rated junior subordinated notes. The tender offer received significant uptake given the long senior unsecured notes were taken out at credit spreads between 145 to 160 bps. The newly issued junior notes benefit from a 50% equity treatment within rating agency calculations, allowing Telus to reduce their headline leverage. Bell executed a similar transaction earlier in the same month, retiring $690 million of senior notes.
Reset Expectations
A development in the corporate bond market that we will be watching closely in the back-half of this year is the first limited recourse capital notes (LRCNs) are scheduled to hit their reset dates. At this time, issuers can determine whether they will call the notes at par or leave them outstanding for at least 5 additional years. The choice will have major implications for the growing asset class.
LRCNs were introduced by the Office of the Superintendent of Financial Institutions (OSFI), the Canadian regulator, in the summer of 2020. These junior ranking securities are intended to further shift risk out of retail investors’ hands into institutional investors’ hands. The securities have a unique structure with a long final maturity date (at least 60 years after issuance). But every 5 years, the issuer has the option to either call the notes at par, or leave them outstanding and reset the coupon. Coupons would reset at the then prevailing 5-year Government of Canada (GoC) bond yield plus the initial credit spread (or “reset spread”). The thinking goes, if the issuer can sell a new junior security into the market at a lower “reset spread”, then it makes sense to call the existing LRCN, and replace it with a newly issued, cheaper version.
As we illustrate in the table below, four issuers face this option later this year. The “reset spreads” on these four securities range from 394 bps to 414 bps. Canadian banks have recently issued junior securities into the U.S. market at credit spreads between GoC plus 280 bps to 325 bps equivalent. The last LRCN issued in Canada was a CIBC note done in March 2025 at a reset spread of 365 bps. Given that new issue levels are more attractive, based on pure economics, it would indicate that the below 4 securities will be called later this year.
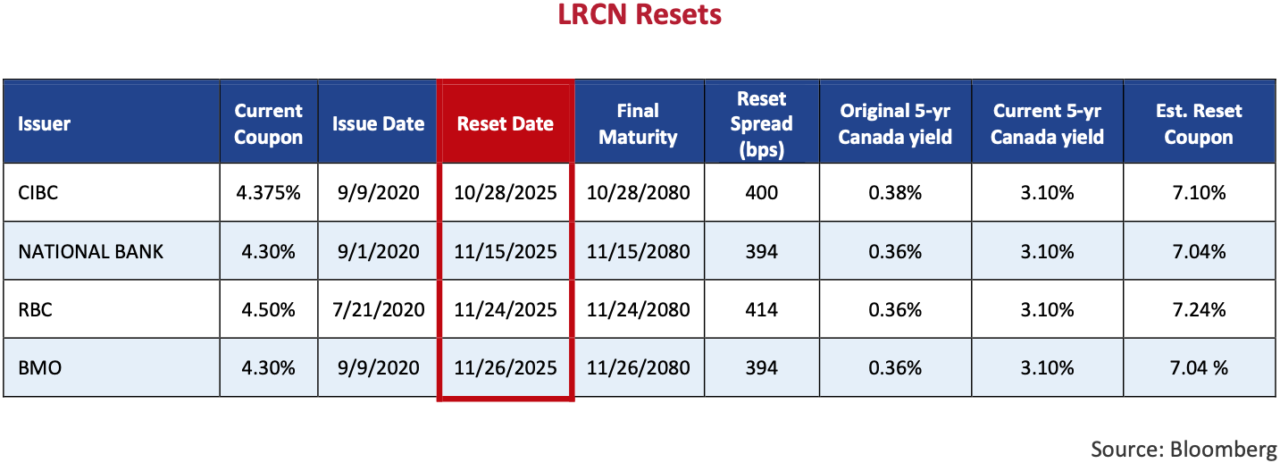
Whether the banks actually do call them is not guaranteed. The good news for investors in that scenario is that, if the LRCNs remain outstanding, they will see a significant rise in their coupon payments. We can see in the table that in 2020, the 5-year GoC yield was a paltry 0.36%. The 5-year GoC yield is now 3.1%, meaning these securities would begin to pay coupons north of 7% following their reset dates. For context, we see perpetual preferreds in the market trading below 6% current yields. The bad news for investors is that, if the banks are not interested in calling outstanding LRCNs, these securities will begin to be priced to future call dates, or even their final maturity date. In a downside scenario, credit spread widening on a security viewed as 60-years in term is much more negative than credit spread widening on a security viewed as 5-years in term.
Junk Yields
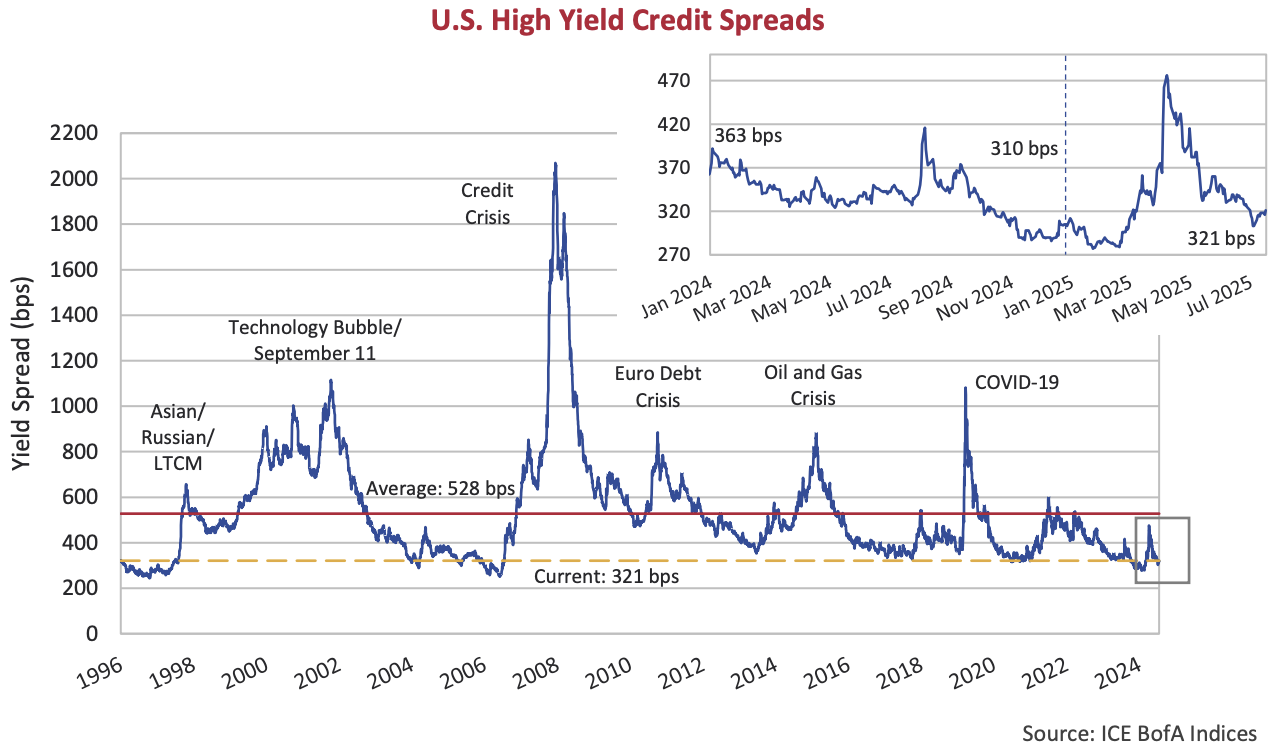
Credit spreads in the high yield market also peaked in early April and have recovered nearly all of the widening. The tight this year came near the end of January at 277 bps before relenting and spiking up to a wide of 471 bps on April 7th. Since then, spreads have come right back at almost the same velocity and are now priced at 321 bps. Perhaps we shouldn’t be surprised at this point, but the appetite for yield in the most speculative end of credit markets continues to prevail. High yield bonds are priced for perfection, and we continue to question whether the trade is too asymmetric at these levels. On one hand, investors hope to collect a reasonable running yield; on the other, the possibility of price volatility and capital loss through defaults or liability management transactions looms large.
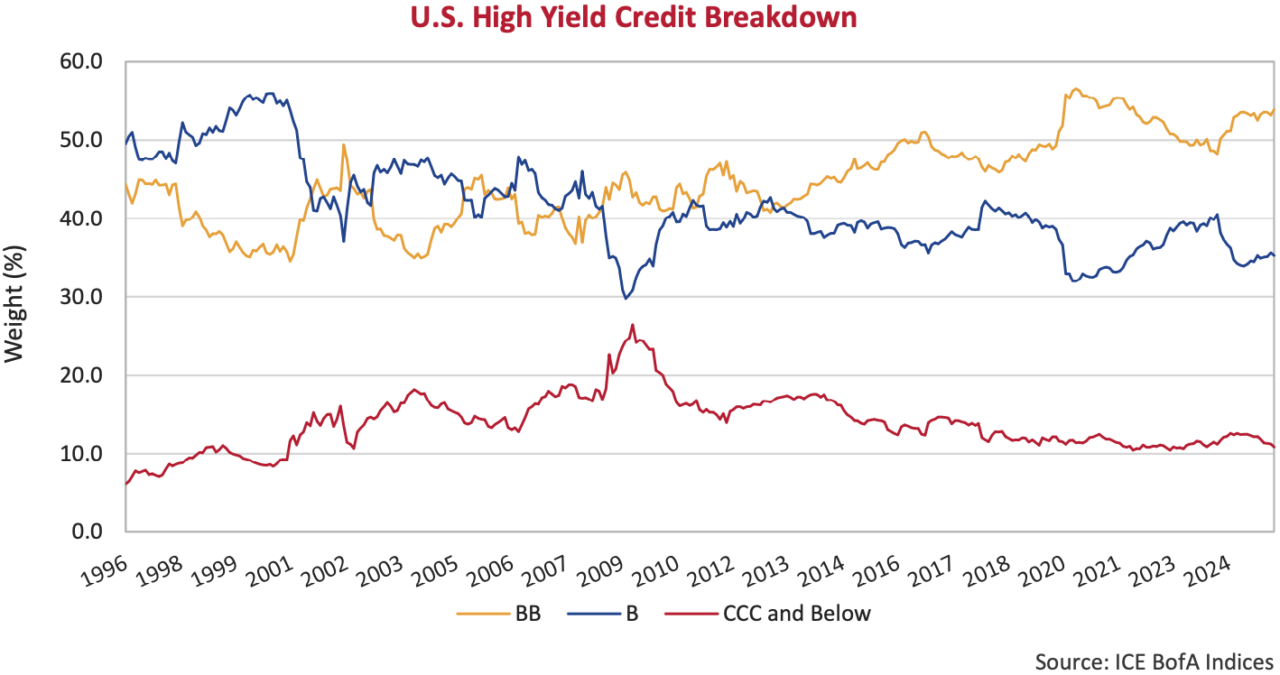
In our interactions with clients and other stakeholders, we are often asked if our expectations of fair value have changed given an increasing quality bias within the high yield market. The assertion is that given a higher level of BB rated issues in the index, that current spread levels are actually reasonable. It is true that the high yield market has a higher credit quality bias today than ever before. Below we have plotted the composition of the U.S. high yield index by credit quality. The composition tends to ebb and flow with credit cycles, but the weight in BB issues has persisted higher and today makes up 54% of the index.
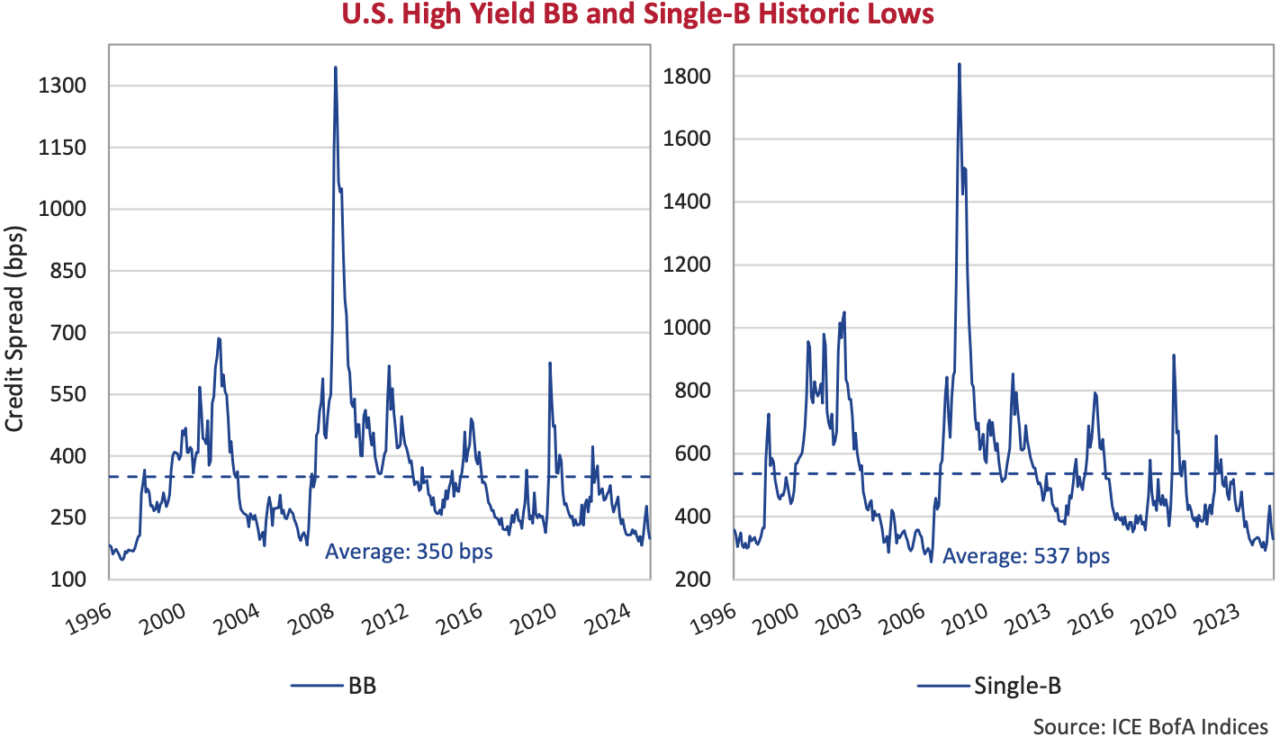
Despite the changing composition of the high yield market, we remain unconvinced by the pitch. Below we have isolated and plotted the credit spread of the BB and B rated components of the U.S. high yield index. Within BB, credit spreads are around the historic lows and at over half the index, this has a bias on the overall. However, if we look at the credit spread of lower quality B rated issues, it is also expensive. At Canso we are focused on bottom-up security selection and pricing individual credit risk. We are finding very few opportunities within high yield, at any rating.
The Hits Keep Coming
Year-to-date has seen numerous blockbuster movies hit the big screen, including A MineCraft Movie and Superman, both produced by Warner Bros. Pictures. While shareholders at Warner Bros. Discovery (WBD), the parent company, may be cheering, bondholders have been left reeling as the company completed one of the larger “Distressed Exchanges” to date. The goal for the Board was to separate the growing assets, namely the content production studios and HBO, from the legacy networks cable business, whose value is being eroded by cord cutting and advertising revenue declines, while leaving much of the roughly US$35 billion in debt at the legacy business.
Bondholders were given a choice between becoming heavily subordinated or taking a haircut to the value of their bonds. With only a 5-day window to decide on whether to support the transaction or risk being left behind if others chose to accept the deal – bondholders were stuck in a classic Prisoner’s Dilemma. To add insult to injury, the company inserted anti-cooperative/boycott clauses into the consenting noteholder indentures, making it harder, if not impossible, for bondholders to form a united front to fend off any future transactions.
What concerns us at Canso is the proliferation of these transactions. Distressed Exchanges, or Liability Management Exercises (LMEs) as these purveyors like to call them, were historically used by Private Equity sponsored companies on the verge of bankruptcy to inflict pain on rival private creditors, in hopes of staying off a payment default. They have now spilled over into high rated, cash flow positive, public equities. WBD was only recently downgraded to below investment grade. Years of weakening creditor protections and excess liquidity provided the backdrop for this to happen.
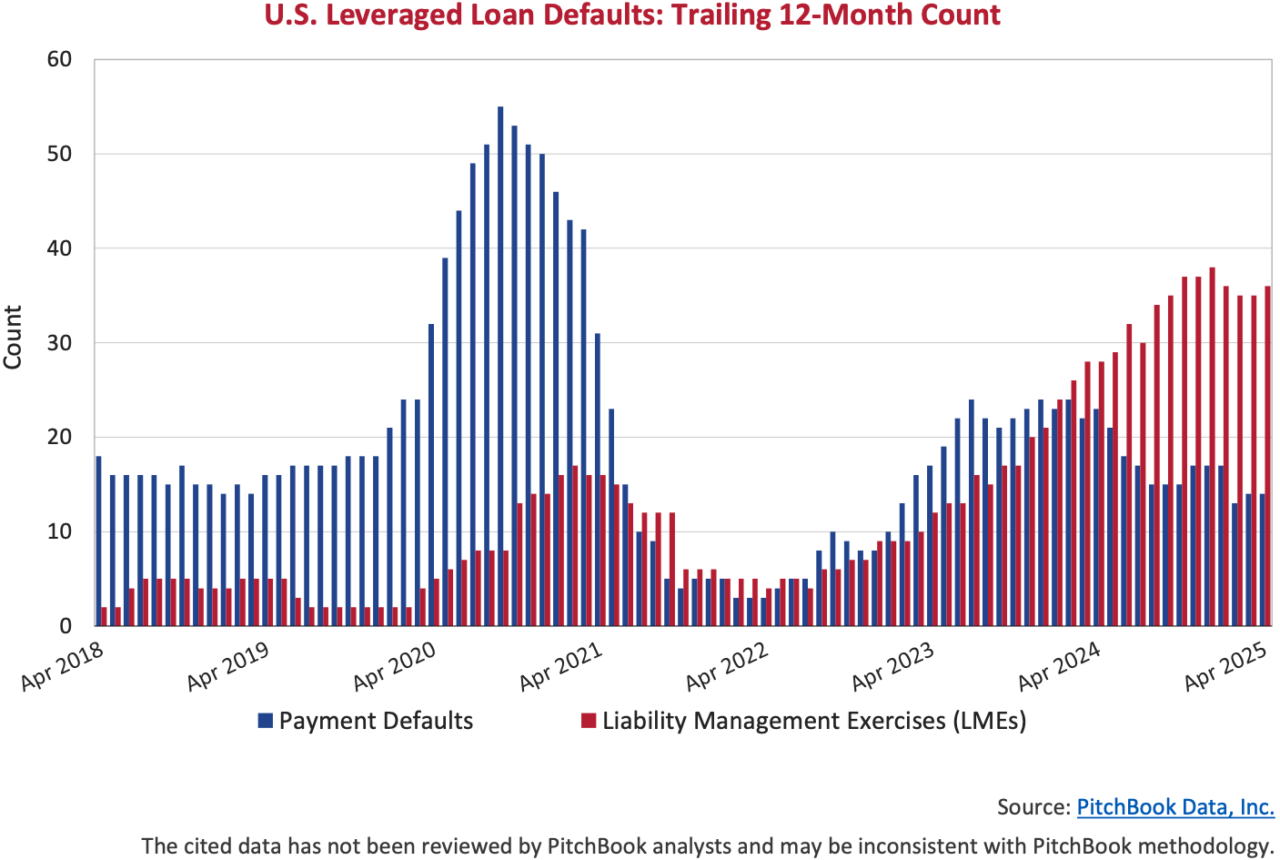
We can see in the chart above that traditional payment defaults are hovering around long-term average while LMEs are on the rise. We continue to assert that it is as important now as ever to do proper due diligence and understand what you are buying. At current valuations for fixed income investors, the upside is limited. Running yield or modest additional spread compressions is a best-case scenario. The downside, on the other hand, is significant. In this market environment, we will continue to favour quality and liquidity until paid for the risks.
Footnotes:
- Source: Fool, Motley. (2025, May 22). The U.S. Government’s Credit Rating Just Got Downgraded for the Third Time Since 2011. History Says the Stock Market Will Do This Next.