

US Market is Flying High
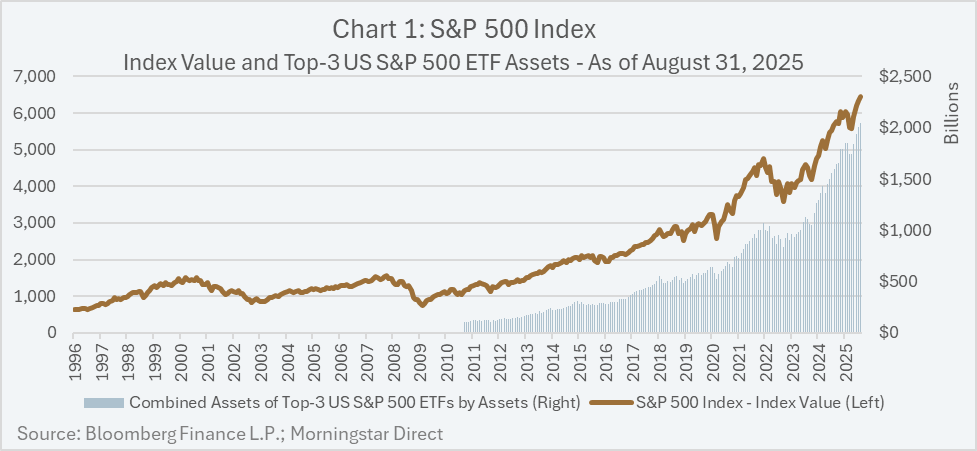
The S&P 500 Index1 (“S&P 500” or the “Index”) has been on a tear. As of August 31, 2025, the Index hit an all-time high returning 9.8%, year-to-date, after it returned 24.2% and 23.3%, in 2023 and 2024, respectively.
Driving the positive performance of the S&P 500 has largely been stocks in the Information Technology (“Technology”) sector, where the recent investment theme of Artificial Intelligence has turbocharged investor expectations of future growth. As of August 31, 2025, the Technology sector comprised 33.5% of the Index, compared to only 20.0% a decade ago.
Retail investors have taken notice of the price appreciation and have piled assets into Exchange Traded Funds (“ETFs”) that replicate the S&P 500. As of August 31, 2025, the top three largest US ETFs2 by assets were all proxies for the S&P 500 offered by different ETF providers. As illustrated in Chart 1, the combined total assets of these ETFs were over $2 trillion, which had doubled from $1 trillion to $2 trillion in a little over two years, while it took more than a decade for the same ETFs to accumulate combined assets of $1 trillion.
Time to Pivot?
Fast-moving markets can be difficult to manage, as investors can often experience emotional biases such as the fear of missing out, which can overpower prudent investment practices such as diversification and “buy-low-sell-high”.
The S&P 500 has been a go-to destination for investors seeking easy, diversified exposure within the US equity market, however, now may be a good time for investors to look to US mid cap and US small cap3 stocks to provide investors with potentially greater diversification to reduce risk, and attain more attractive valuations for potentially greater returns looking forward.
Increase Diversification
Correlation4 is a commonly used metric that quantifies diversification between two asset classes. As of August 31, 2025, the 3-year correlation between the S&P 500 and the NASDAQ 100 Index5 (“NASDAQ”) was 0.90, whereas the S&P Midcap 400 Index (“S&P Midcap”) and S&P Smallcap 600 Index (“S&P Smallcap”) had 3-year correlations of 0.69 and 0.62, respectively. The lower correlations relative to the NASDAQ suggest that US mid cap and US small cap stocks could improve diversification and lower risk within the US equity asset class by reducing concentration to the Technology sector.

More Attractive Valuations
A common valuation method for stocks is the Forward P/E ratio (“P/E ratio”)6, where a higher P/E ratio typically indicates less value and a lower P/E ratio typically indicates more value. With that said, the P/E ratio can be evaluated through different lenses to give context to the relative opportunities between different stocks.
First, through an absolute lens. As of August 31, 2025, the P/E ratios of the S&P 500, S&P Midcap, and S&P Smallcap were 24.3x,18.9x and 18.6x, respectively, which suggests the S&P Smallcap offered the most attractive valuation and the S&P 500 the least attractive valuation.
Second, through a relative lens compared to its historical average. Over the past 25-years ending August 31, 2025, the average P/E ratio for the S&P 500, S&P Midcap, and S&P Smallcap, were 17.9x, 18.1x, and 19.8x, respectively. Based on the P/E ratios as of August 31, 2025, their differences compared to their historical averages were +6.4x, +0.8x, and -1.2x, respectively. This also suggests the S&P Smallcap offered the most attractive valuation and the S&P 500 the least attractive valuation relative to their historical averages.
Third, through the lens of historical forward performance at different starting P/E ratios. As illustrated in Chart 3, given the P/E ratios as of August 31, 2025 (i.e. 24.3x, 18.9x and 18.6x), the expected forward annualized 5-year returns for the S&P 500, S&P Midcap, and S&P Smallcap were 1.4%, 8.7%, and 8.9%, respectively, based on an analysis of their historical returns. This, again, suggests the S&P Smallcap offered the most attractive opportunity for future returns, and the S&P 500 offered the least attractive opportunity for future returns based on their P/E ratios as of August 31, 2025.
Table 1 summarizes the outcomes of the different P/E ratio valuation lenses.


Conclusion
Despite the recent attractive returns of the S&P 500, this could be an opportunity for investors to rebalance their US equity exposure to include more US mid cap and US small cap stocks to reduce risk and possibly achieve greater returns going forward. US mid cap and US small cap currently exhibit less correlation to the volatile Technology sector and offer more attractive valuation metrics compared to the S&P 500.
While this paper used passive market indices for its analysis, greater value could possibly be extracted by active managers that operate in the US mid cap and US small cap asset classes. Companies in these asset classes tend to be earlier-stage and less followed by investors compared to the large cap companies that dominate the S&P 500, where skilled investment professionals could better identify company-specific opportunities.
Lysander Funds
Lysander Funds offers different funds that focus on mid cap and small cap stocks in both the US and Canadian markets. These funds are managed by our partner portfolio managers, Pembroke Management Limited and Triasima Portfolio Management Inc. For more information on these funds, please speak with a professional financial advisor, or visit lysanderfunds.com.
Footnotes
1 The S&P 500 is a market-cap weighted index, meaning larger and relatively better performing stocks receive higher weights in the index.
2 The three funds are: Vanguard 500 Index Fund, SPDR S&P 500 ETF, and iShares Core S&P 500 ETF.
3 In this paper, references to US mid cap and US small cap are to the S&P Midcap 400 Index and S&P Smallcap 600 Index, respectively.
4 Correlation is a statistical relationship between two variables that measures the extent they move together. The values range between +1 and -1, each meaning they move perfectly in the same and opposite directions.
5 NASDAQ 100 Index is a market-cap weighted index of non-financial companies, which is heavily skewed to stocks in the Technology sector.
6 Forward P/E ratio is a common valuation metric where the stock price is divided by the forward 12-month estimate of earnings. For this paper, the Forward P/E ratios were provided by Bloomberg Finance L.P.