

2026 US Equity Rotation
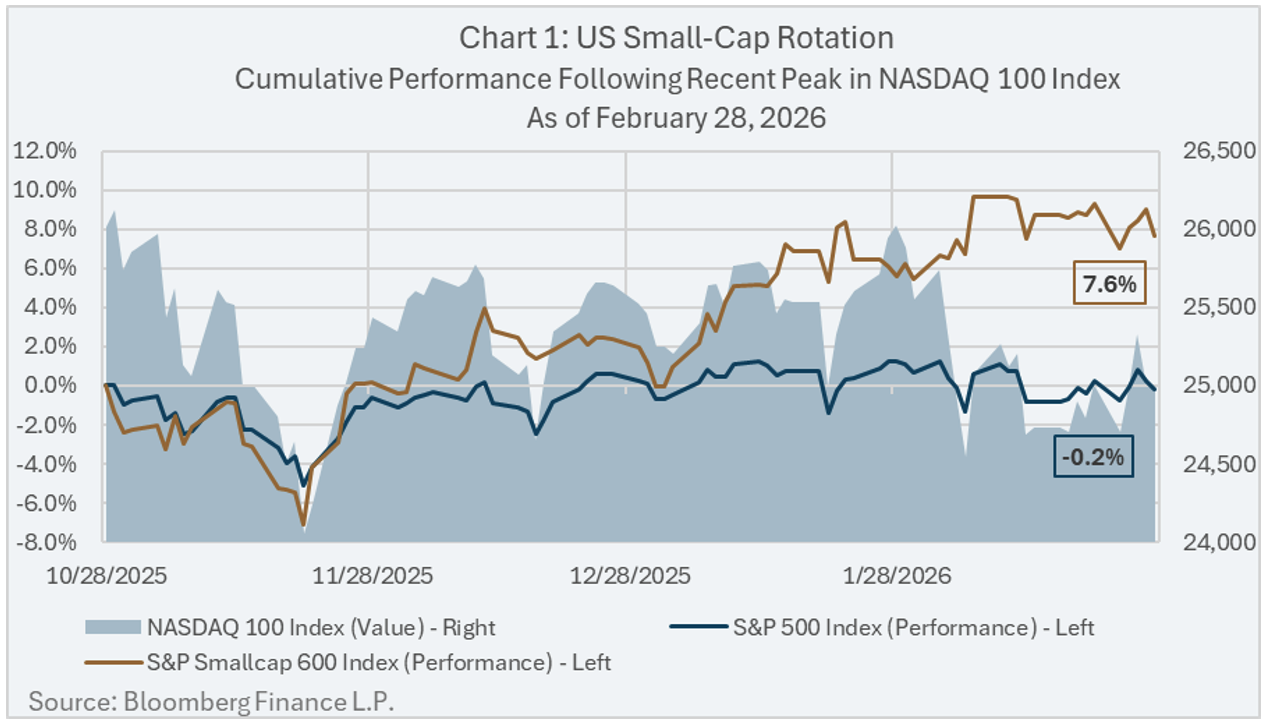
Investors seem to be cooling on US technology stocks after a three year stretch of strong returns following the launch of ChatGPT in November 2022. Since its recent peak on October 29, 2025, the NASDAQ 100 Index1 has returned -4.4%, as of February 28, 20262.
The sell-off in US technology stocks has also impacted the widely followed S&P 500 Index, having returned -0.2% over the some time period. In recent years the S&P 500 Index has become increasingly sensitive to the performance of the US technology sector, with its weight in the Index rising from 25.7% on December 31, 2022, to 36.1% on October 31, 20252.
However, as illustrated in Chart 1, the recent weakness of the US technology sector has not been felt evenly across the broad US equity market. US small-cap stocks (represented by the S&P Smallcap 600 Index) returned 7.6%, from the NASDAQ 100 Index peak on October 29, 2025 to February 28, 2026.
While skeptics may argue that a time period of less than four months is too short to be considered a durable trend, history suggests otherwise. A similar and more durable rotation occurred during the dot-com bubble of the early 2000’s.
2000 US Equity Rotation
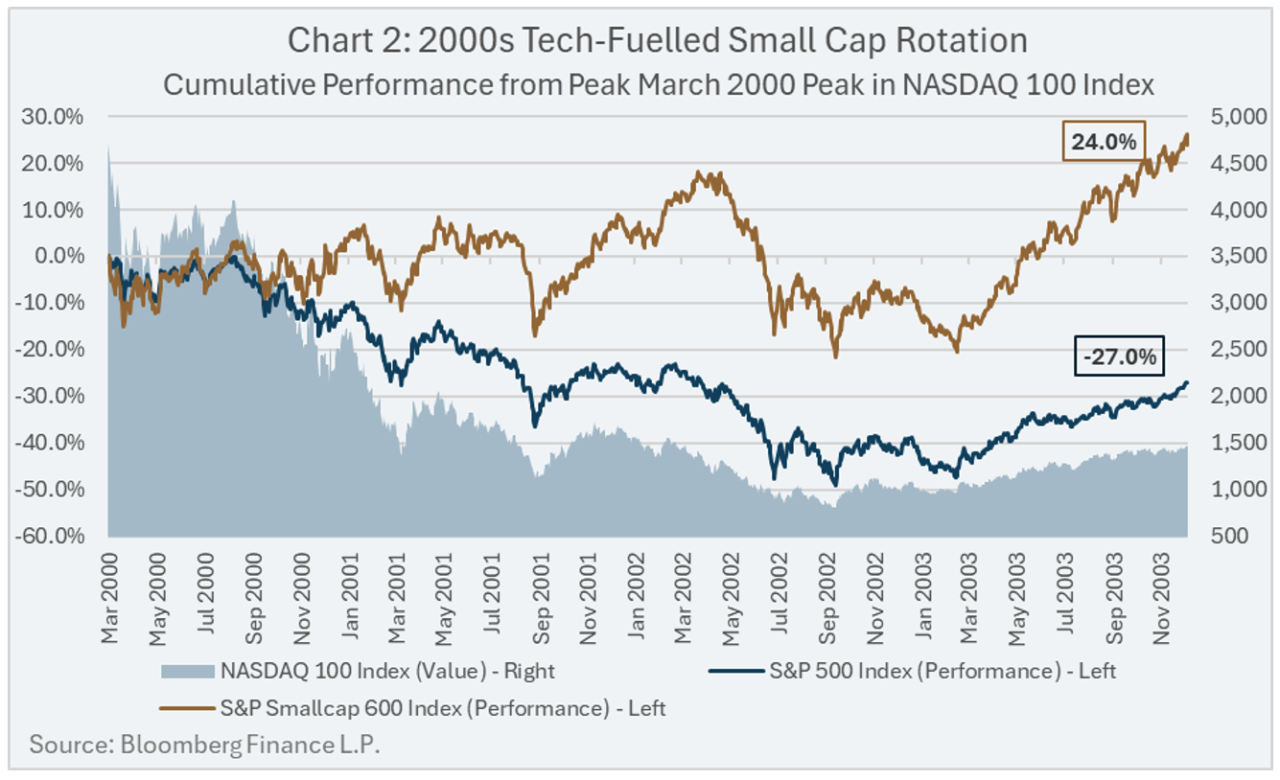
On March 29, 2000, the NASDAQ 100 Index peaked following a major run-up in the US technology sector. As shown in Chart 2, following the NASDAQ 100 Index peak, there was a similar rotation out of US large-cap technology stocks and into US small-cap stocks that proved to be a durable trend. By December 31, 2003, following the NASDAQ 100 Index peak, the cumulative performance of the S&P Smallcap 600 Index was 24%, compared to the -27.0% cumulative performance of the S&P 500 Index.
Over the longer-term, the small-cap outperformance persisted. From March 29, 2000 and February 19, 2026 the S&P Smallcap 600 Index delivered an annualized return of 8.1% compared to 6.0% for the S&P 500 Index.
Conclusion
The current rotation taking place in the US equity market underscores the importance of diversification, not only across asset classes, but also across sectors within an asset class.
Increasingly, investors are using investment vehicles that mirror broad market indexes to gain exposure to different geographies – for example, the S&P 500 Index is a typical proxy for exposure to US equities. This approach, although easy to execute, can create the impression of diversification while masking underlying sector concentration – notably large cap technology in today’s S&P 500. Investors may benefit by complementing their US large-cap exposure with an allocation to US small-cap equity to enhance diversification and potentially achieve better risk-adjusted returns over time.
Lysander Funds
Lysander Funds has partnered with Pembroke Management Limited to offer Canadian investors an actively managed mutual fund that concentrates on the US small-cap and mid-cap equity – Lysander-Pembroke U.S. Small-Mid Cap Fund.
Footnotes
- NASDAQ 100 Index is a market-cap weighted index of non-financial companies, which is heavily skewed to stocks in the Technology sector.
- Source: Bloomberg Finance L.P.