

Golden Era
Fear and uncertainty moved aside this summer, and optimism is now abound. Central Bankers are cutting rates, equity markets are touching new highs, and the Toronto Blue Jays are headed to the World Series! In credit markets, we also continue to experience historically strong market conditions. A recent Bloomberg article has aptly described a golden age for credit markets:
“It is, by almost any measure, a golden era for US credit markets. Companies are selling debt at a near record clip; relative borrowing costs are hovering around historic lows; and investors are pocketing the best returns in years.”1
While bonds and stocks danced through the third quarter, gold waltzed ahead, gaining nearly 12% in the period for a gain of 60% so far this year. The price of the yellow metal rose above US$4,000 an ounce for the first time ever this month, while its close cousin silver surpassed US$50 an ounce, eclipsing its 1980’s high.
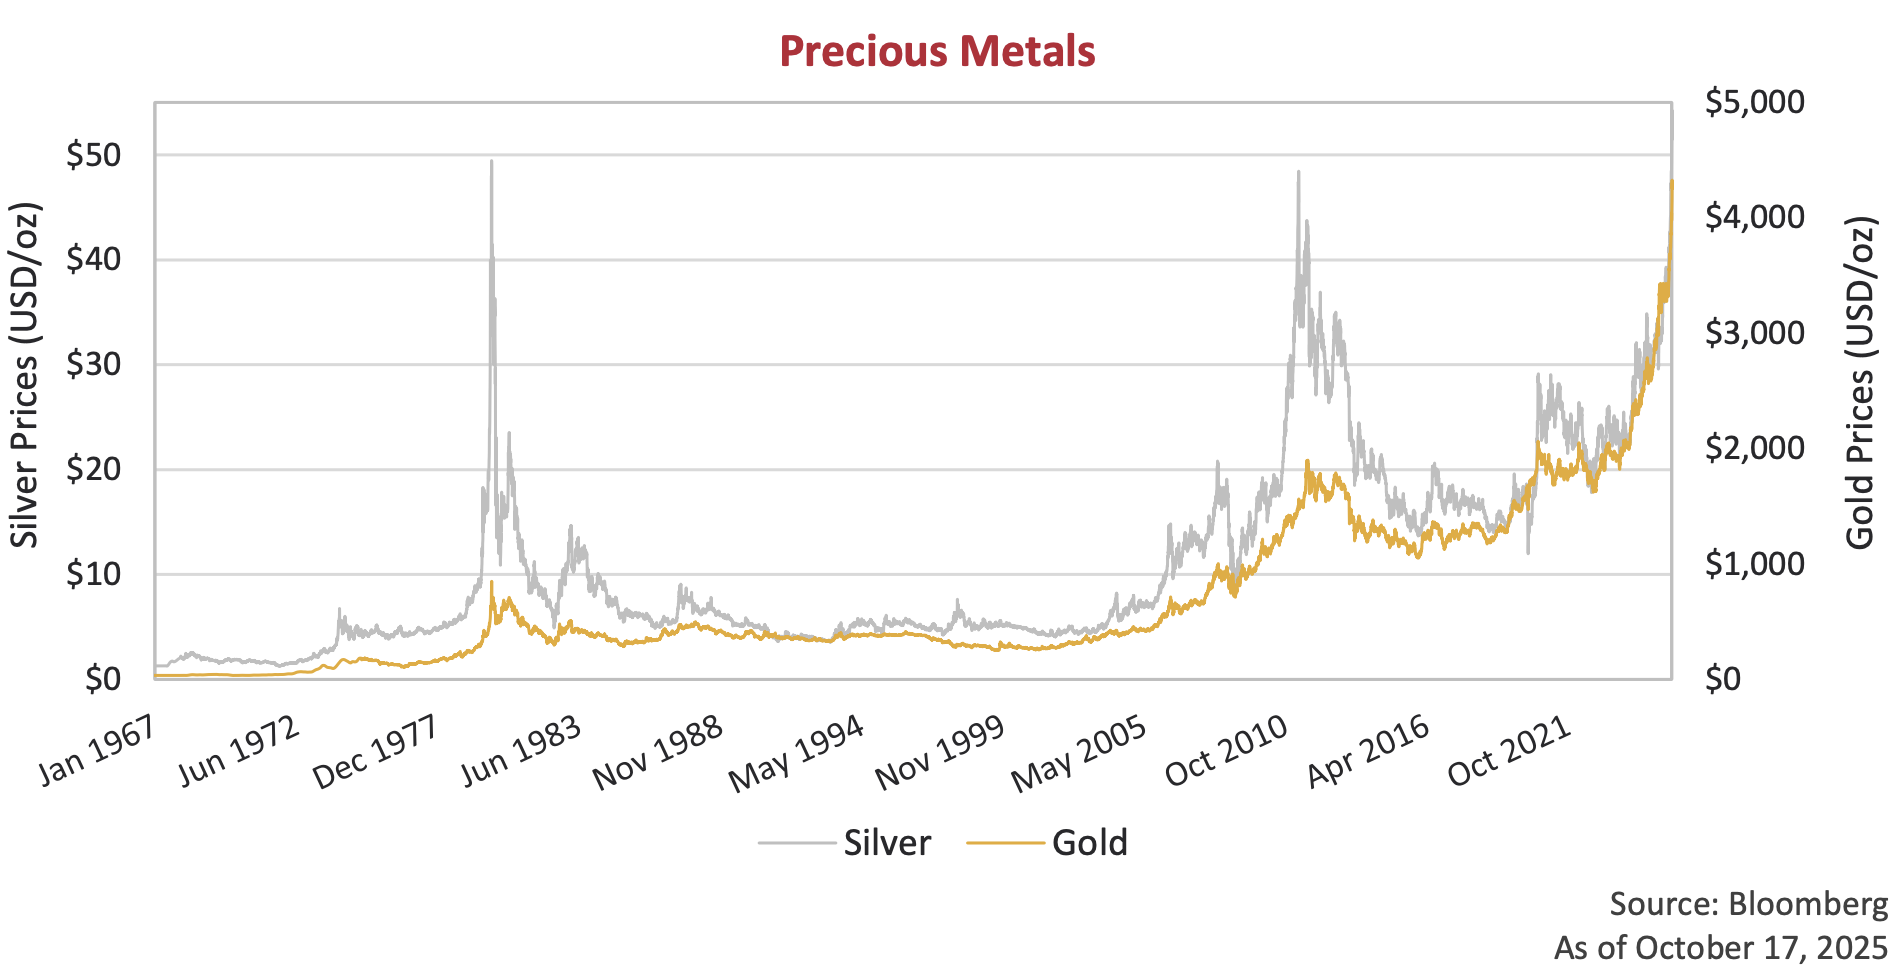
The oldest hedges are proving to be the shiniest. Bullion is being seen by some (or many) as safer than the U.S. dollar. And despite central bank easing, longer term government bond yields remain out of favour due to trepidation over tariff inflation and ever higher deficits.
Vibe Check
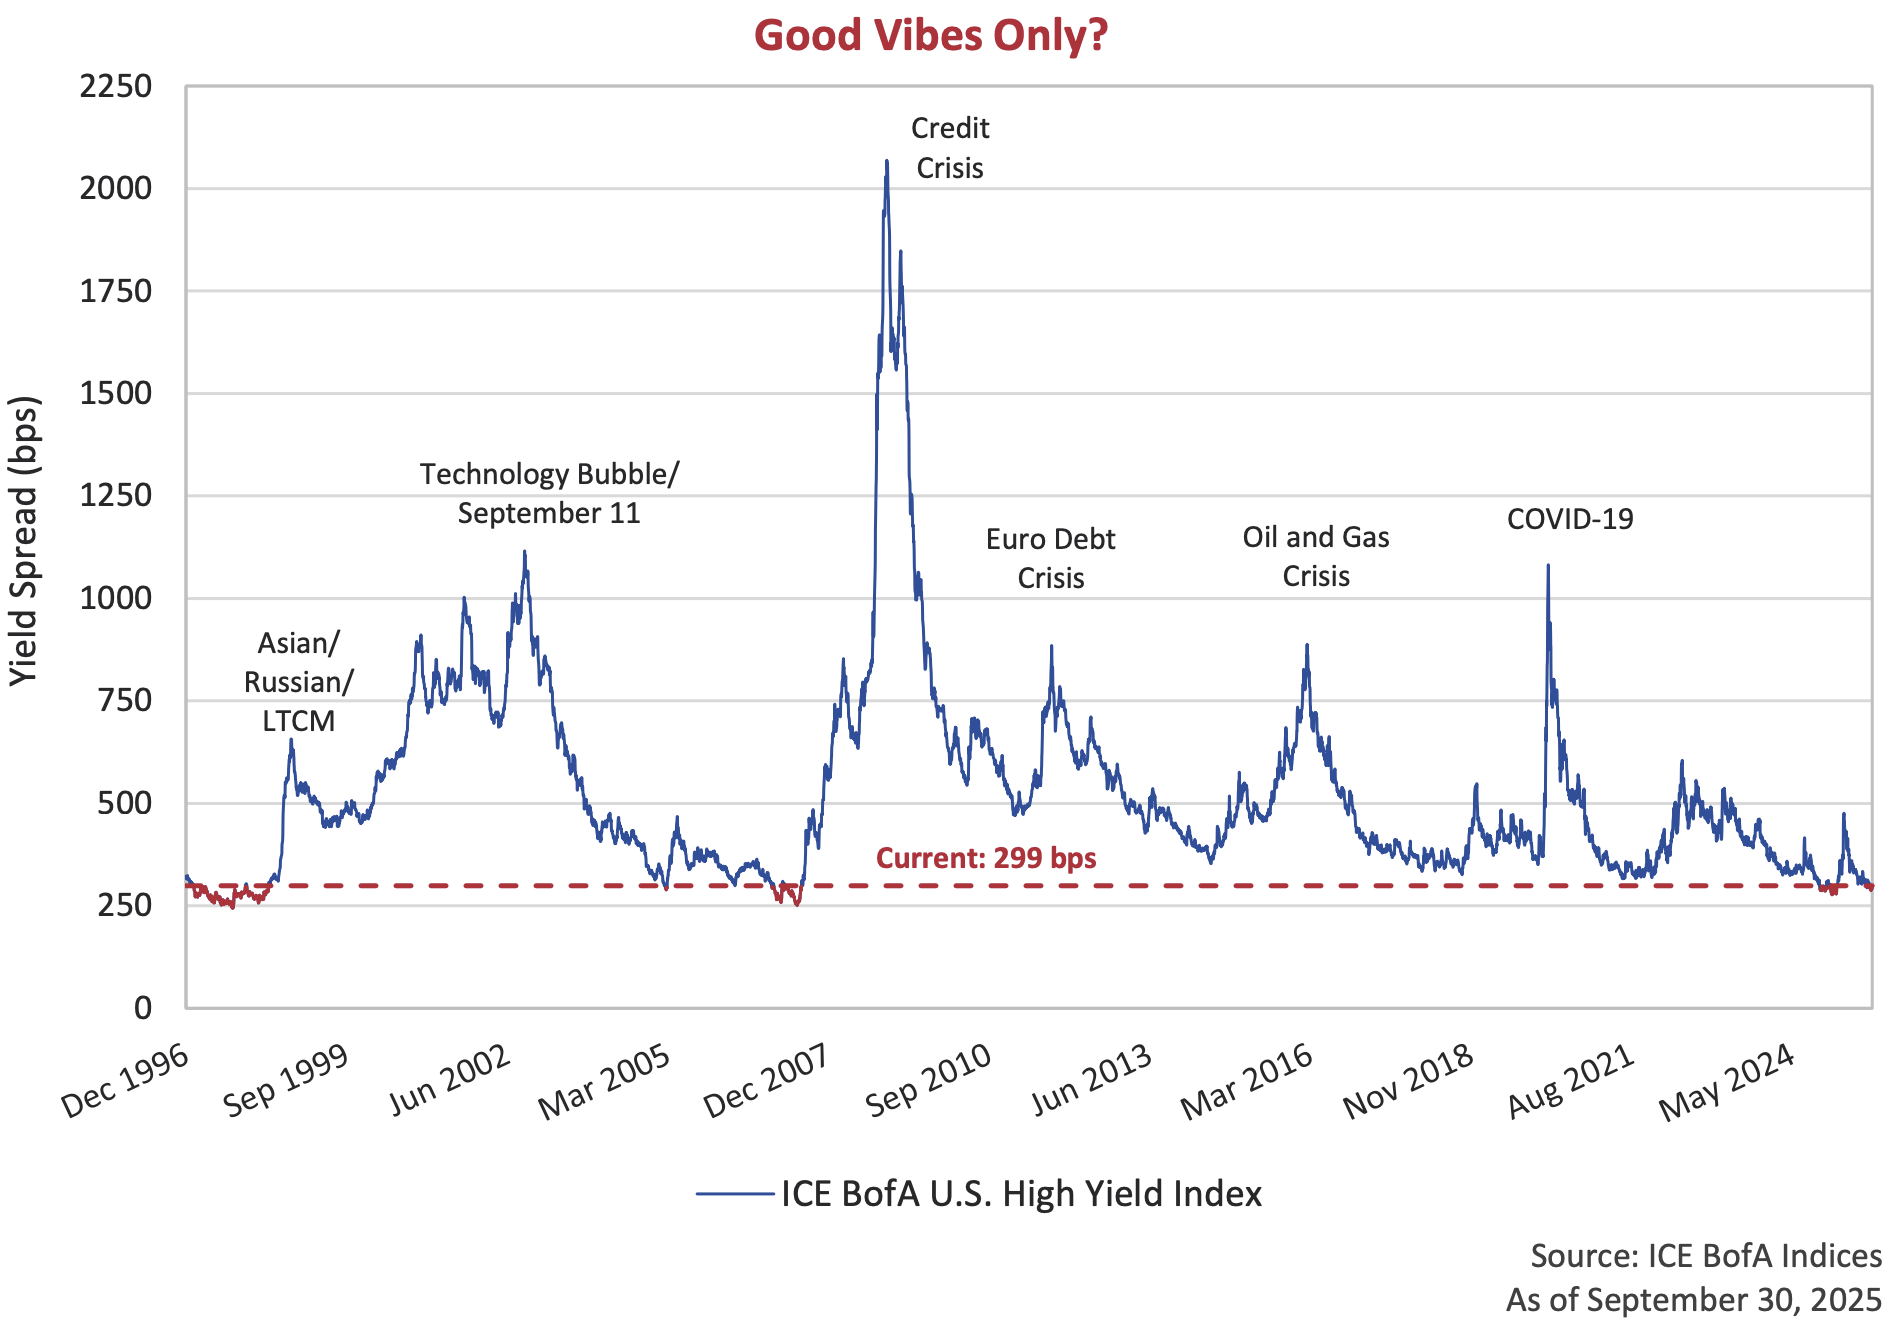
We don’t endeavour to predict the future and will happily leave the dubious task of forecasting to someone else. Our focus is, as always, on finding undervalued securities. And as we have been saying for some time, it is getting harder and harder to find value. The ICE BofA U.S. High Yield Index closed the third quarter at a spread of 299 basis points (bps). The Index has only priced inside 300 bps on 3% of trading days this century. Below we have placed emphasis on those days in red to highlight the left tail we are living in. Could the market tighten further from here? Of course. But absent special situations, we’ll leave that bet for others.
The Bottom Line
The third quarter of 2025 was kinder to financial markets compared to the very turbulent second quarter. After the initial rebound from April’s Liberation Day lows, the rally persisted throughout the third quarter. Resilient corporate earnings, continued enthusiasm for Artificial Intelligence-related investments, and the onset of a new round of interest rate cuts fueled markets upward. All indices below finished in the black.
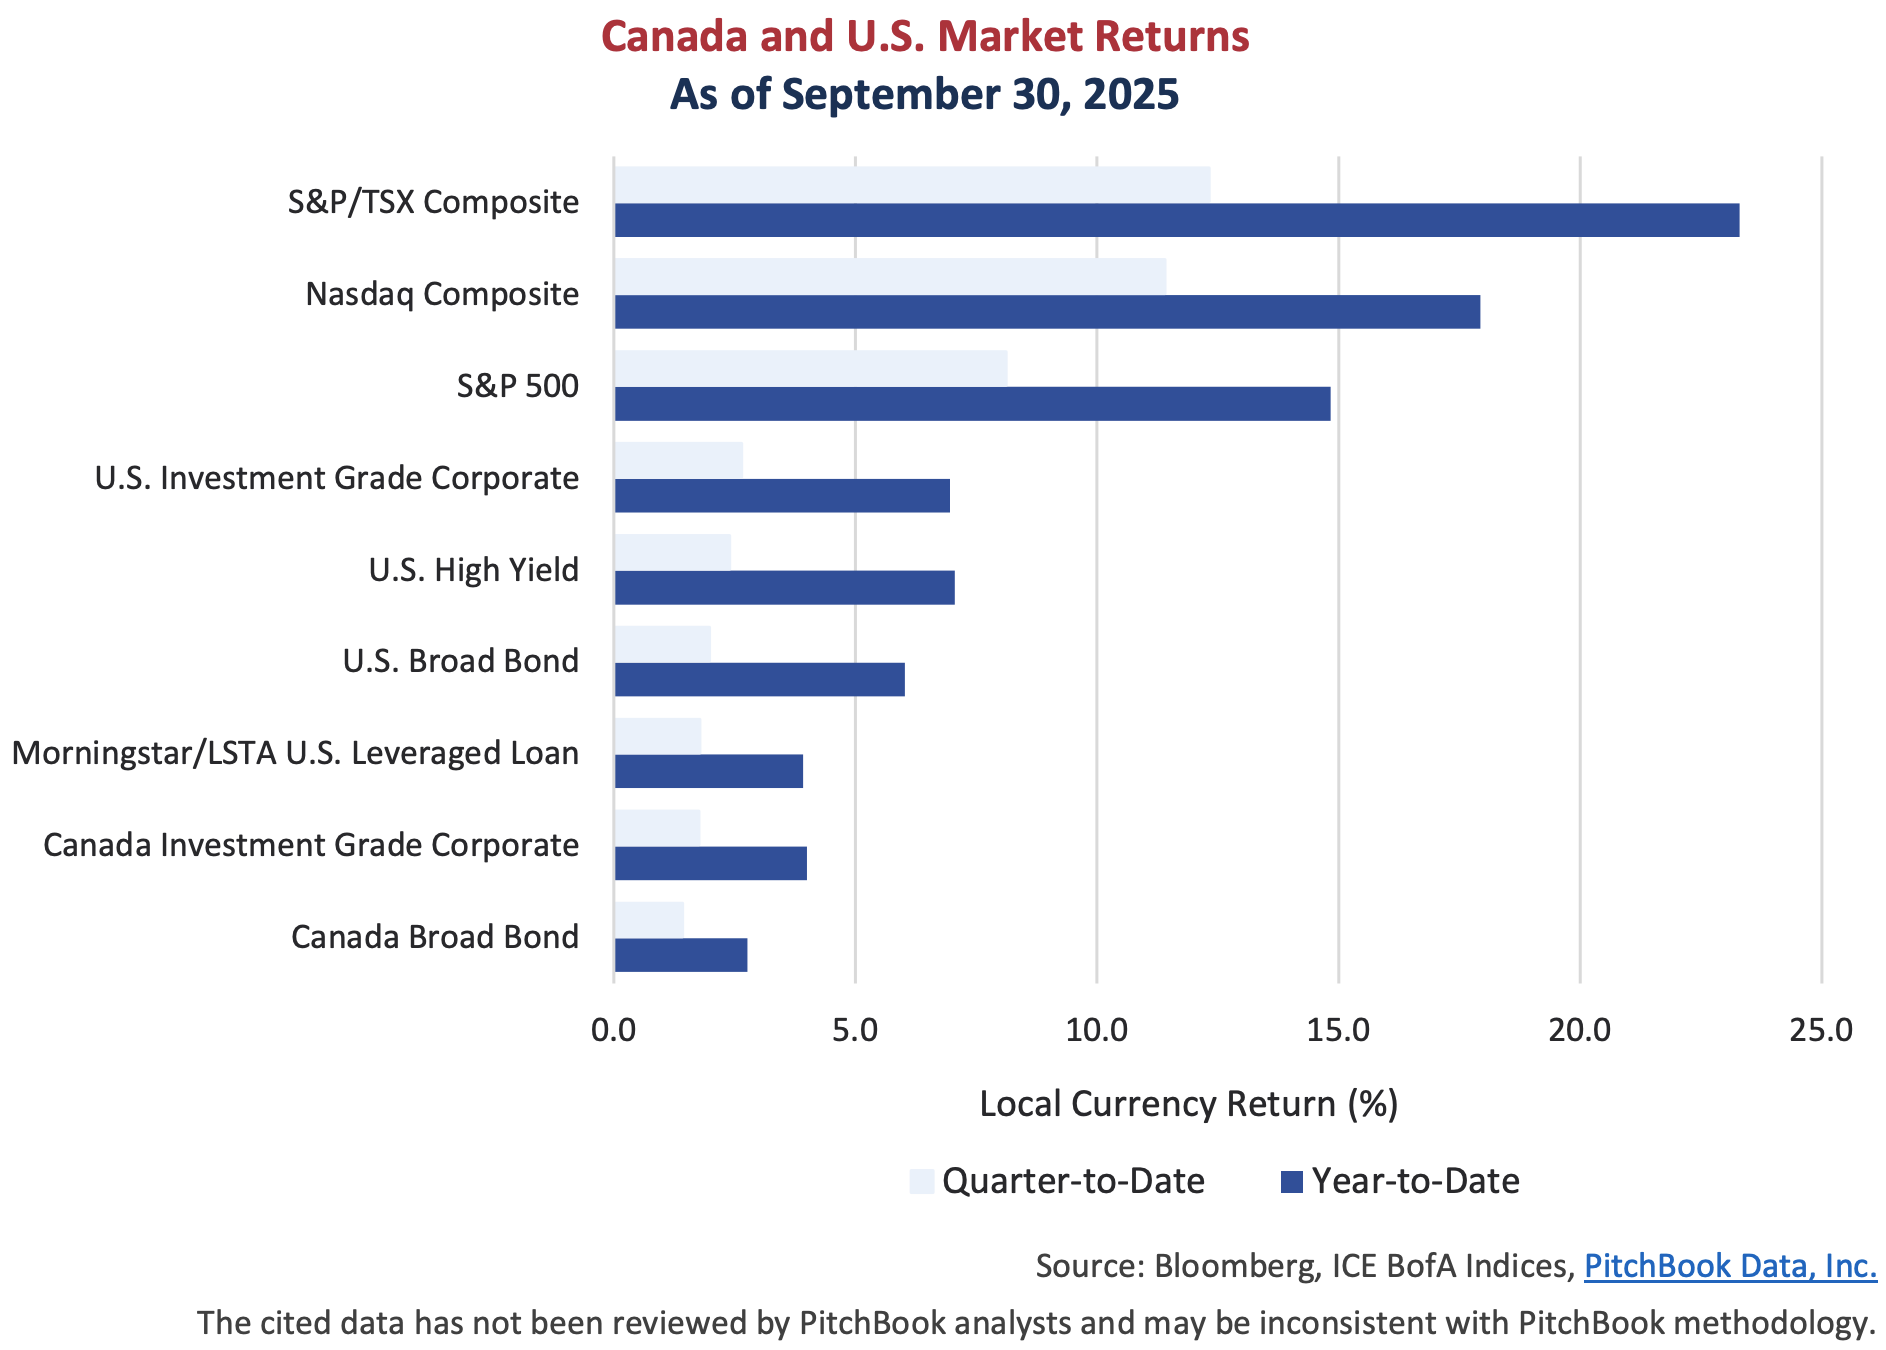
The three major North American equities indices posted strong gains, with the S&P 500 up 8.1% and the tech heavy Nasdaq up 11.4%. The Canadian S&P/TSX Composite is outperforming both, up 12.3% in the quarter and 23.3% year-to-date, as it is benefiting from a resource-heavy sector representation. Falling government yields lifted bond indices higher while the additional boost from shrinking risk premiums drove corporate bond market outperformance. U.S. investment grade and high yield markets are up 7% through the first 9 months of the year, while Canadian bond markets are a bit behind because of a steepening yield curve.
Corporate Action
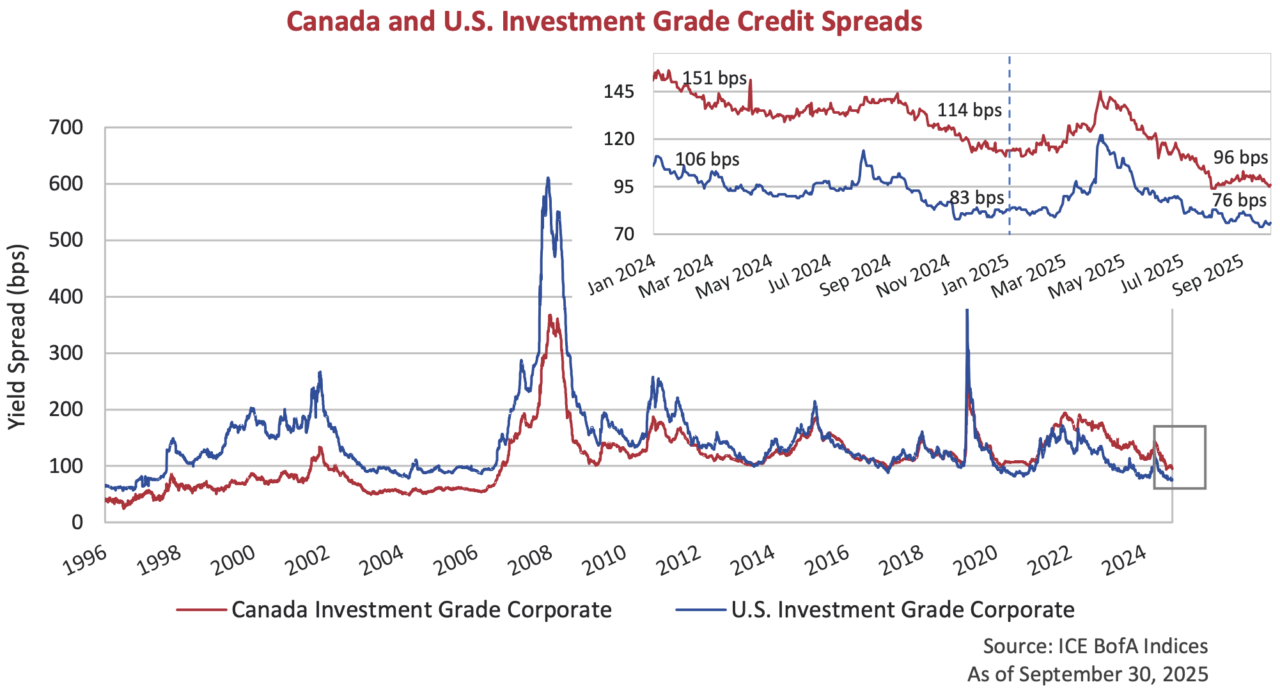
Credit spreads in the higher quality investment grade side of the corporate bond market have also continued to perform well. We have plotted the spreads of the Canadian and U.S. investment grade indices below. Spreads in both Canada and the U.S. were 12 and 13 bps tighter in the quarter. With the continued rally, the wake of the Liberation Day widening has dissipated, and spreads are now comfortably tighter this year. Canadian spreads now sit inside 100 bps for the first time since 2021 while U.S. investment grade continues to look increasingly expensive, finishing the third quarter at 76 bps.
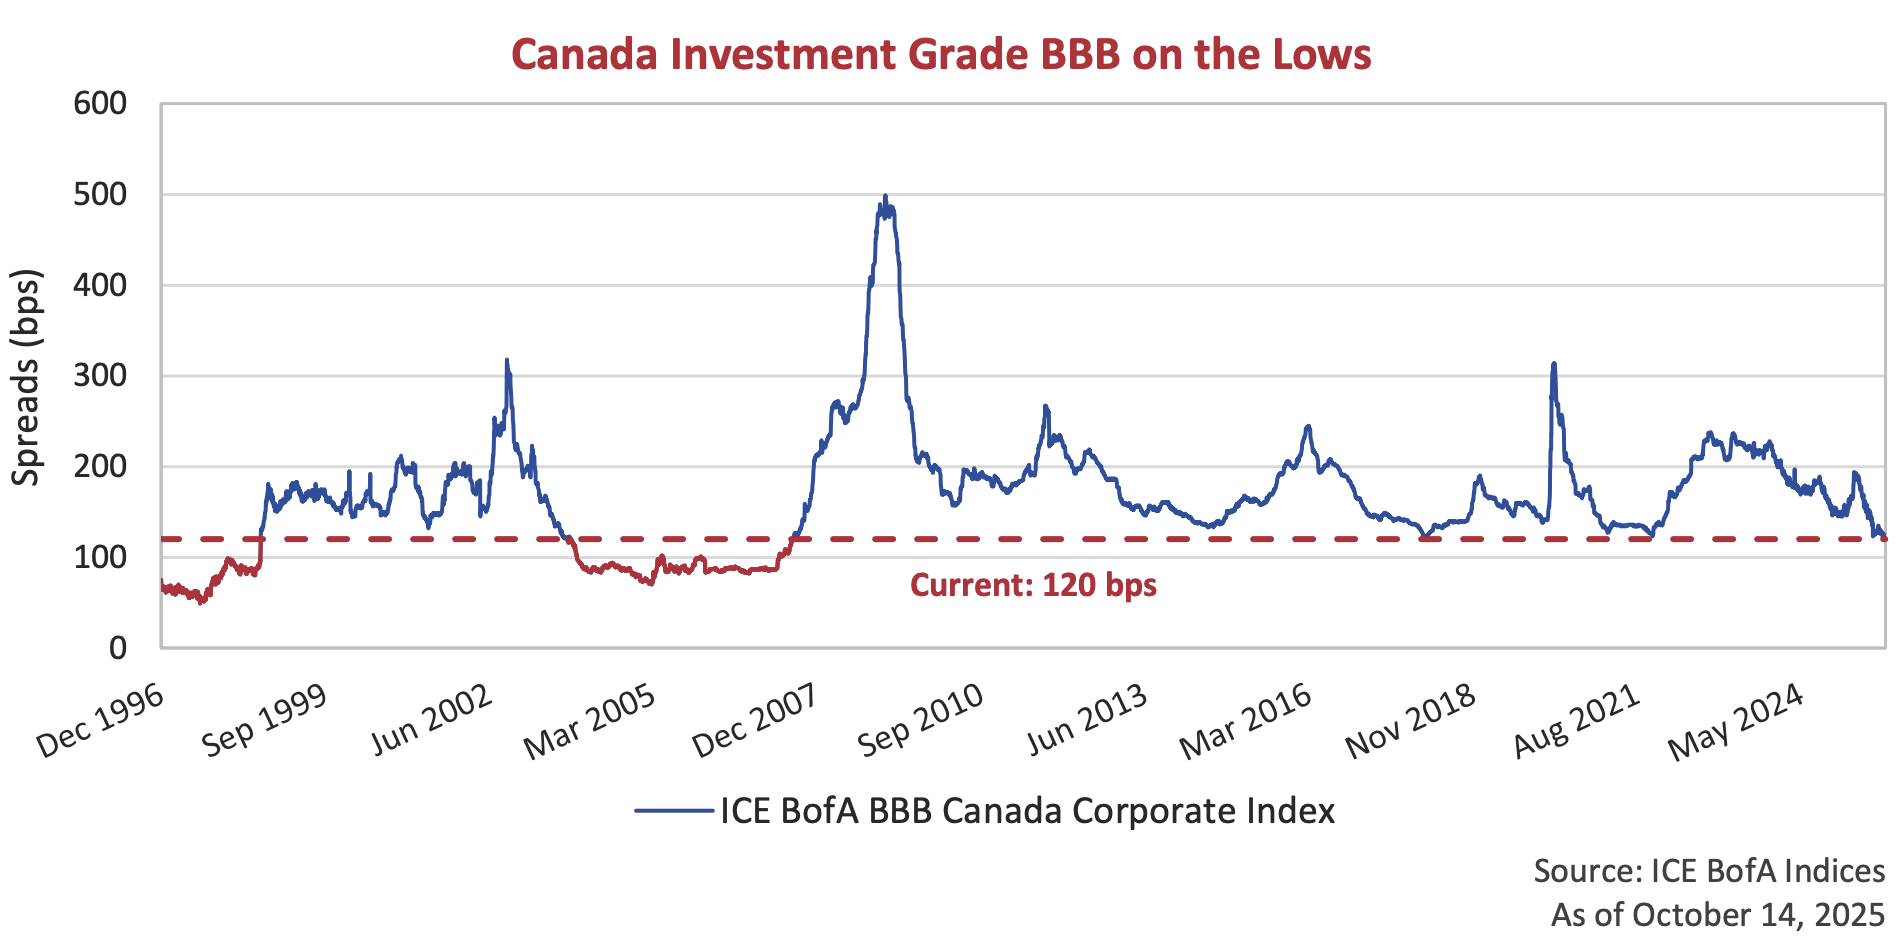
The BBB component of the Canadian investment grade index has continued to be a stand-out performer. We have been calling attention to this trend for a few quarters now and do so again. Our attention has largely been in the long end of the curve where bonds have repriced tighter and tighter. Movements this past quarter have turned our focus back to the BBB component wholistically. Spreads in BBB issuers outperformed in the quarter tightening 20 bps and now sit 46 bps inside the long-term average. We once again draw emphasis on the richness of valuations with the red line below. The last time spreads were this tight, the first place you’d look to fix that leaky sink was the Yellow Pages. Yellow Pages, coincidently, was one of the largest BBB rated issuers at the time.
Then and Now
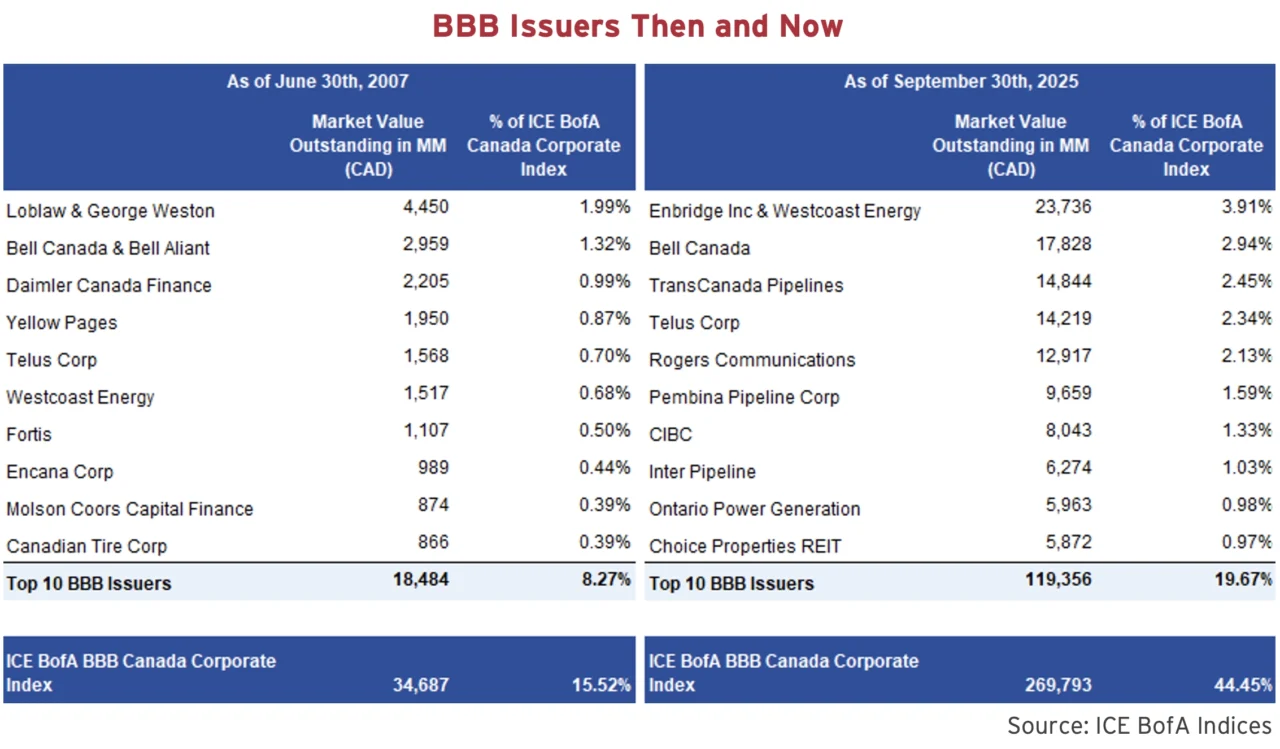
Looking back to June 2007, the last time the BBB index traded inside of where it sits today, we can see that much has changed over the past 18 years. To begin, the overall size of the BBB index has grown almost 8 times, from $35 billion then to $270 billion today. The BBB component now makes up 45% of the Investment Grade Index versus only 16% in June 2007. Only three names have stayed in the Top 10: Bell Canada, Telus and Westcoast Energy. Bell Canada and Telus have each grown their Canadian dollar borrowings significantly while Westcoast Energy now sits under the Enbridge umbrella. Three other names: Daimler Canada Finance, Yellow Pages and Encana, have left the index through restructurings, downgrades and relocations south of the border. And the final four companies remain BBB issuers but have been supplanted by new entrants. What was a diversified list across multiple sectors is now dominated by pipeline and telecom companies.
Signs of Life?
In the past, we have written about the seeming closure of the new issue preferred share market in Canada. The shrinking market for preferred shares in Canada has been driven by aggressive redemptions by banks as their regulator, the Office of the Superintendent of Financial Institutions (OSFI), looks to reduce the reliance on retail investors for Additional Tier One (AT1) Capital. The market has also been affected by other large historical issuers, like utilities, telcos, and midstream companies, choosing to issue hybrid bonds as opposed to preferred shares. These structures are attractive to issuers as they target institutional investors, and the financing cost is pre-tax deductible interest as opposed to after-tax dividend payments.
Well, there were signs of life in September. The new issue preferred share market, which hadn’t seen a traditional structure preferred issue since 2022, finally re-opened. Both Power Corp and its related company, Great West Lifeco, came to the market with $200 million fixed-rate straight perpetual preferred share offerings. The deals have both performed well since issuance amidst a product starved and flow driven market. We are encouraged to see the reopening of the market, but we are not convinced this is a sign of a changing tide. So far in 2025, 13 issues have been redeemed representing approximately $3.7 billion par value. The Big Six banks account for 7 of the 13 calls, totalling $2.4 billion par. On the other side, the allure of attractive financing terms through AT1 and hybrid structures continues to be the focus of issuers.
No Issues with New Issues
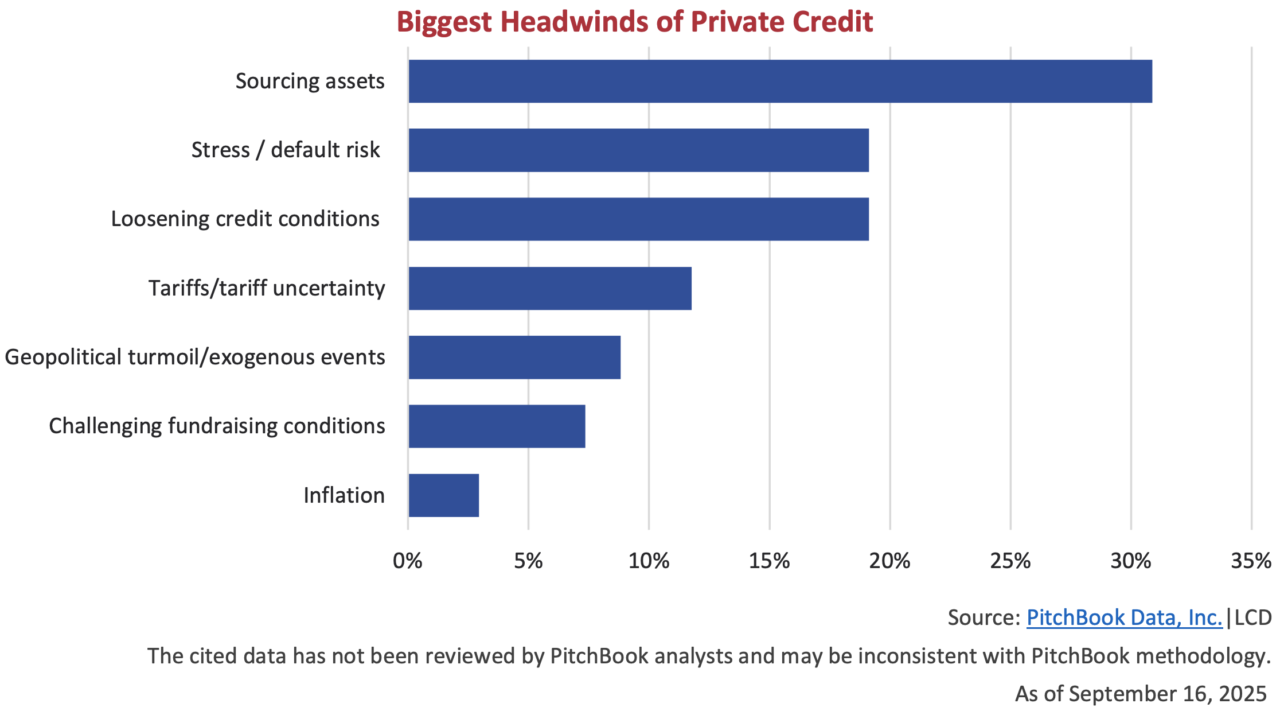
As we stated at the beginning of our newsletter, times are good if you are a borrower. Yields are dropping, terms are favourable, and capital is abundant. This sentiment extends all the way down to the most speculative ends of the credit markets. Pitchbook reports that US$400 billion of levered loans priced in Q3, the highest quarterly total on record, with many borrowers taking advantage of lower coupons or extended maturities. Furthermore, US$118 billion of high yield bonds were placed in the quarter. This represents the strongest quarter for high yield bond issuance since 2021 and one of the highest totals of all time. The third prong of the sub-investment grade markets is private credit. We point to an interesting survey conducted by Pitchbook|LCD below (notably, taken during the period of September 6th through 16th, before First Brands filed for bankruptcy). Interestingly, the number one concern of private credit survey respondents was not poor deal terms or potential credit stresses, but the ability to “source assets”. Too many dollars chasing too few opportunities. In the infamous words in 2007 of former Citigroup CEO Chuck Prince “… as long as the music is playing, you’ve got to get up and dance.”2
Under the Hood
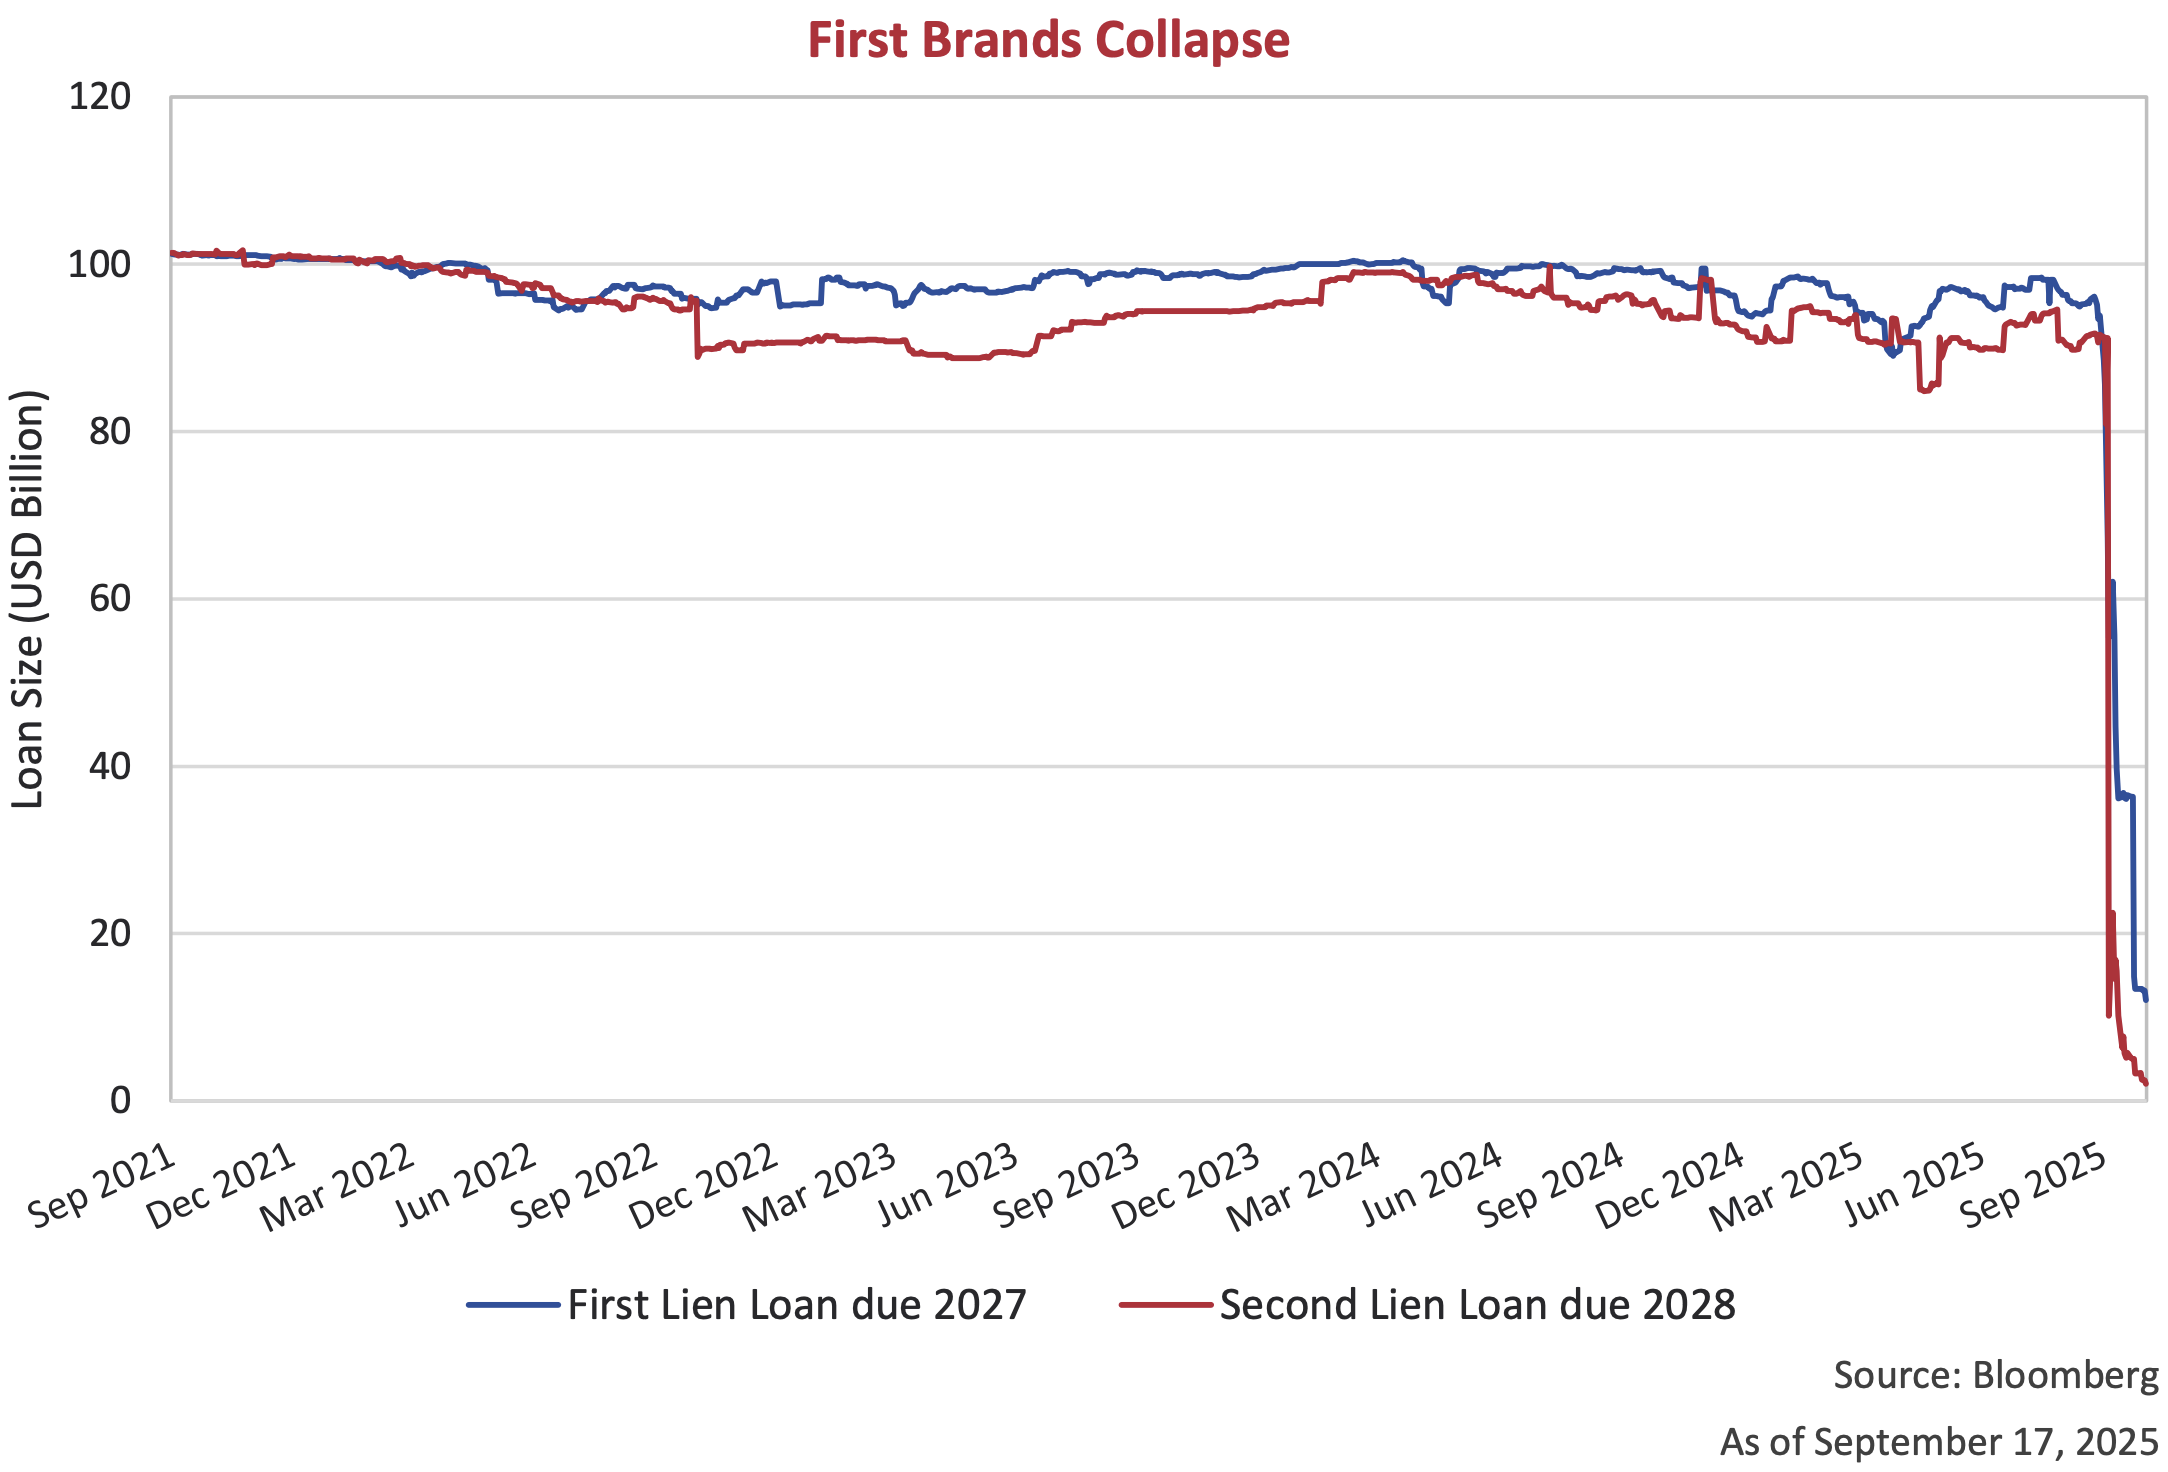
On September 28, First Brands Group, a Michigan-based auto parts company known for brands like FRAM®, Raybestos, and TRICO®, filed for Chapter 11 bankruptcy, carrying over US$6 billion in balance sheet debt and more than US$4 billion in off-balance-sheet obligations. The collapse stemmed from a combination of aggressive acquisitions, opaque financing practices, and “accounting irregularities” (legal speak for: we’re looking into a potential fraud). Efforts to refinance US$6 billion in debt this summer failed, prompting lenders to demand a quality-of-earnings review and sent the price of the term loans into free-fall. While the company navigates the courtroom and lenders scramble to recover claims, authorities are investigating whether the same receivables were used as collateral multiple times, with US$2.3 billion in factoring liabilities currently under review.
The bankruptcy has rippled through the private credit market with hundreds of collateralized loan obligations (CLOs) exposed, and some of the biggest names on Wall Street facing losses. Among them is UBS, which has more than US$500 million tied to First Brands’ debt and invoice-linked financing. The First Brands Group bankruptcy is an example of debt deals gone wrong in a hot credit market. It serves also as a reminder of the risks that come with the opaqueness of the private credit market.
As we have said before, many investors have been chasing yield in private credit without fully appreciating downside risk. Credit investors, public and private alike, risk being blindsided in the absence of deep fundamental due diligence. Digging into covenants, understanding collateral quality, and scrutinizing off-balance-sheet exposures, is more critical than ever in the current market environment.
Bond Buyers Beware
As we move into the last quarter of the year, one thing remains clear, markets will continue to move in cycles. So long as humans are involved, there will be ebbs and flows driven by sentiment, policy, and economic fundamentals. Spreads remain tight, and valuations are elevated, suggesting we are approaching the later stages of the credit cycle. The collapse of First Brands raises an important question, is this a canary in the coal mine signaling broader vulnerabilities, or simply a one-off bust? Commenting on the First Brands collapse, CEO of JPMorgan Chase, Jamie Dimon stated that “when you see one cockroach, there are probably more… Everyone should be forewarned on this.” In response, Marc Lipschultz of Blue Owl Capital, was quick to respond that this is a failure of the traditional syndicated loan market not of direct lending. While only time will tell, we believe this is a time for vigilance and continue to favour quality and liquidity. Investors should remain mindful of the risks that accompany complacency, even as pockets of opportunity persist.
Footnotes:
- Ronalds-Hannon, Eliza and Weinman, Aaron. (2025, October 12). From Tricolor to Saks, Bonds are Now Crashing at Breakneck Speed.
- Nakamoto, Michiyo and Wighton, David. (2007, July 9). Citigroup chief stays bullish on buy-outs.